

Has the prevalence of overweight, obesity and central obesity levelled off in the United States? Trends, patterns, disparities, and future projections for the obesity epidemic
- PMID: 32016289
- PMCID: PMC7394965
- DOI: 10.1093/ije/dyz273
Has the prevalence of overweight, obesity and central obesity levelled off in the United States? Trends, patterns, disparities, and future projections for the obesity epidemic
Abstract
Background: Obesity (OB) is a serious epidemic in the United States.
Methods: We examined OB patterns and time trends across socio-economic and geographic parameters and projected the future situation. Large national databases were used. Overweight (OW), OB and severe obesity (SOB) were defined using body mass index cut-points/percentiles; central obesity (CO), waist circumference cut-point in adults and waist:height ratio cutoff in youth. Various meta-regression analysis models were fit for projection analyses.
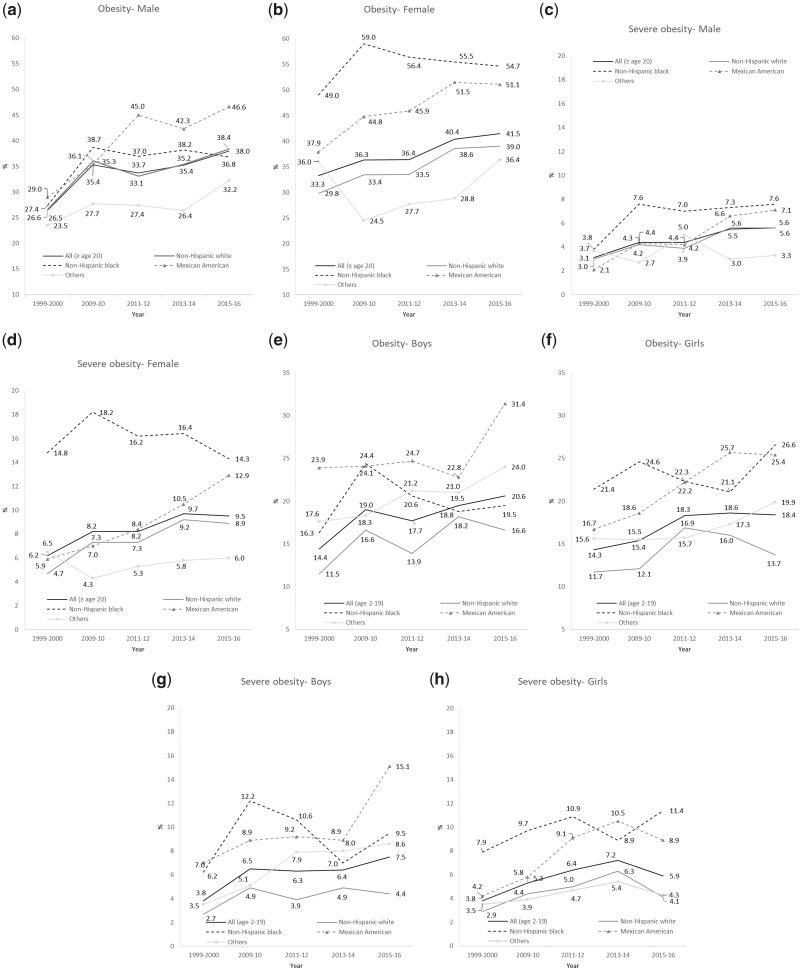
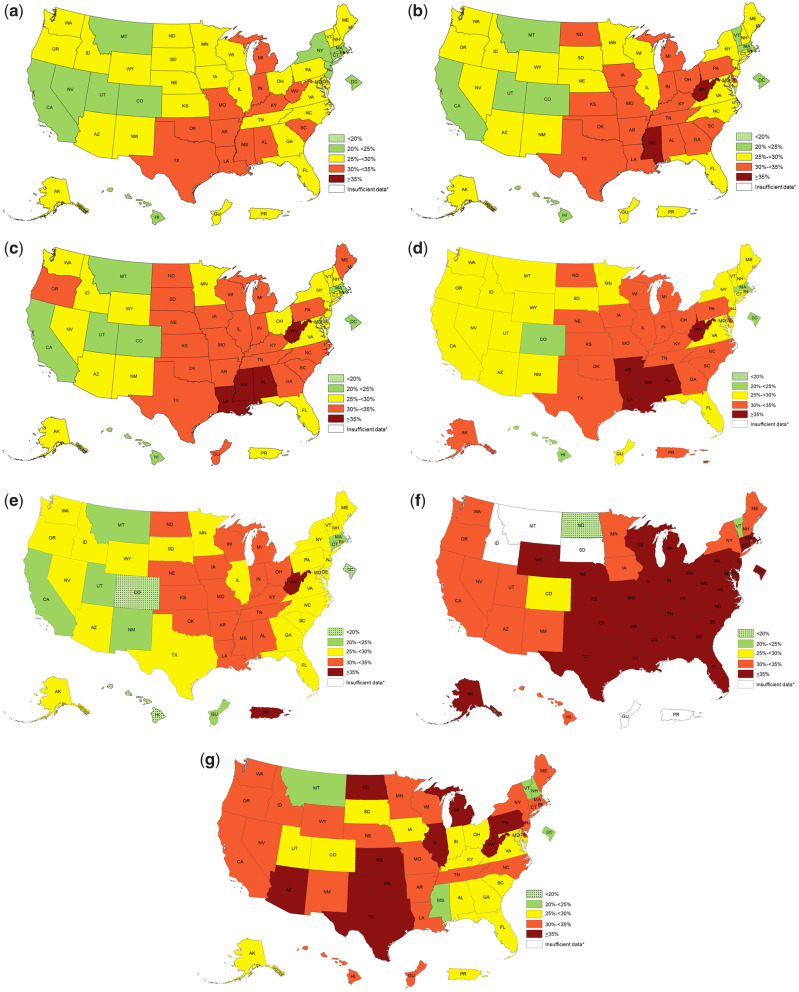
Results: OB prevalence had consistently risen since 1999 and considerable differences existed across groups and regions. Among adults, men's OB (33.7%) and OW (71.6%) levelled off in 2009-2012, resuming the increase to 38.0 and 74.7% in 2015-2016, respectively. Women showed an uninterrupted increase in OB/OW prevalence since 1999, reaching 41.5% (OB) and 68.9% (OW) in 2015-2016. SOB levelled off in 2013-2016 (men: 5.5-5.6%; women: 9.7-9.5%), after annual increases of 0.2% between 1999 and 2012. Non-Hispanic Blacks had the highest prevalence in women's OB/SOB and men's SOB. OB prevalence in boys rose continuously to 20.6% and SOB to 7.5% in 2015-2016, but not in girls. By 2030, most Americans will be OB/OW and nearly 50% of adults OB, whereas ∼33% of children aged 6-11 and ∼50% of adolescents aged 12-19 will be OB/OW. Since 1999, CO has risen steadily, and by 2030 is projected to reach 55.6% in men, 80.0% in women, 47.6% among girls and 38.9% among boys. Regional differences exist in adult OB prevalence (2011-2016) and across ethnicities; South (32.0%) and Midwest (31.4%) had the highest rates.
Conclusions: US obesity prevalence has been rising, despite a temporary pause in 2009-2012. Wide disparities across groups and geographical regions persist. Effective, sustainable, culturally-tailored interventions are needed.
Keywords: Obesity; body mass index; central obesity; overweight; projection; trend.
© The Author(s) 2020; all rights reserved. Published by Oxford University Press on behalf of the International Epidemiological Association.
Figures
References
-
- Jensen MD, Ryan DH, Apovian CM. et al. AHA/ACC/TOS guideline for the management of overweight and obesity in adults: a report of the American College of Cardiology/American Heart Association Task Force on Practice Guidelines and The Obesity Society. J Am Coll Cardiol 2014;63:2985–3023. - PubMed
-
- World Health Organization. Obesity: preventing and managing the global epidemic. Report of a WHO consultation. World Health Organization Technical Report Series, 2000;1–253;i–xii. - PubMed
-
- National Institutes of Health, National Heart, Lung, and Blood Institute. Clinical guidelines on the identification, evaluation, and treatment of overweight and obesity in adults. Executive summary, 1998.
-
- Wang Y, Beydoun MA.. The obesity epidemic in the United States--gender, age, socioeconomic, racial/ethnic, and geographic characteristics: a systematic review and meta-regression analysis. Epidemiol Rev 2007;29:6–28. - PubMed
Publication types
MeSH terms
Grants and funding
LinkOut - more resources
Full Text Sources
Medical
Miscellaneous
