. 2020 Sep 1;112(9):902-912.
doi: 10.1093/jnci/djaa017.

Radiomics Response Signature for Identification of Metastatic Colorectal Cancer Sensitive to Therapies Targeting EGFR Pathway

Affiliations

Radiomics Response Signature for Identification of Metastatic Colorectal Cancer Sensitive to Therapies Targeting EGFR Pathway

Laurent Dercle et al. J Natl Cancer Inst. .

Abstract

Background: The authors sought to forecast survival and enhance treatment decisions for patients with liver metastatic colorectal cancer by using on-treatment radiomics signature to predict tumor sensitiveness to irinotecan, 5-fluorouracil, and leucovorin (FOLFIRI) alone (F) or in combination with cetuximab (FC).

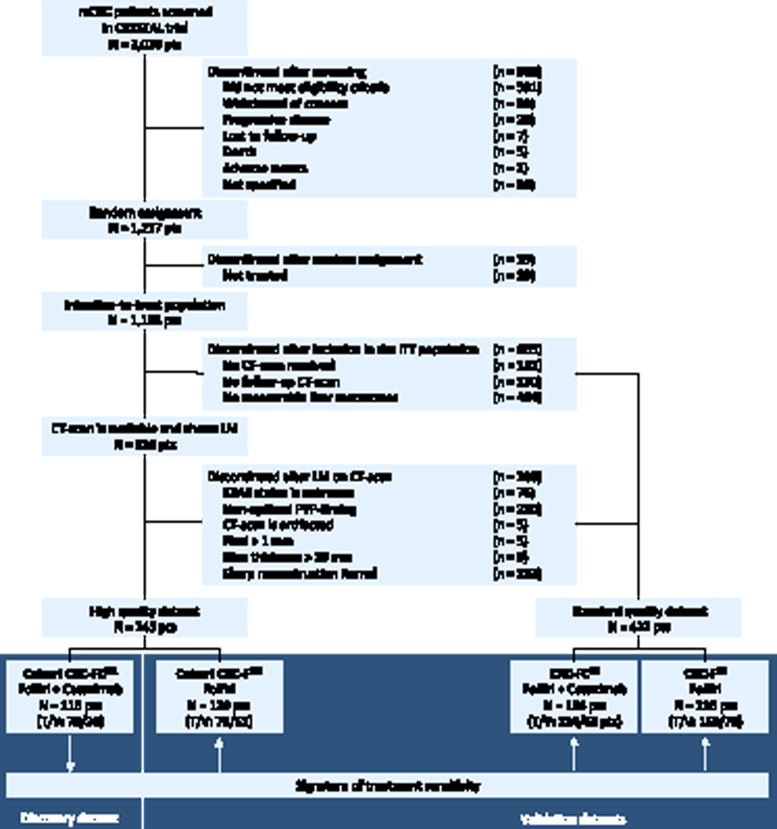
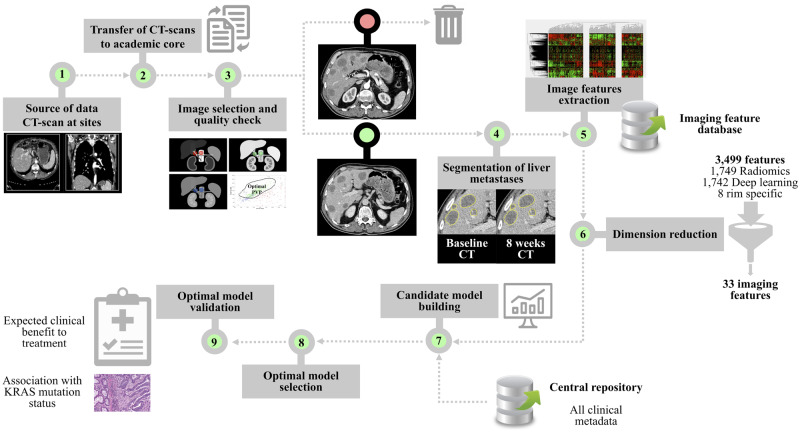
Methods: We retrospectively analyzed 667 metastatic colorectal cancer patients treated with F or FC. Computed tomography quality was classified as high (HQ) or standard (SD). Four datasets were created using the nomenclature (treatment) - (quality). Patients were randomly assigned (2:1) to training or validation sets: FCHQ: 78:38, FCSD: 124:62, FHQ: 78:51, FSD: 158:78. Four tumor-imaging biomarkers measured quantitative radiomics changes between standard of care computed tomography scans at baseline and 8 weeks. Using machine learning, the performance of the signature to classify tumors as treatment sensitive or treatment insensitive was trained and validated using receiver operating characteristic (ROC) curves. Hazard ratio and Cox regression models evaluated association with overall survival (OS).

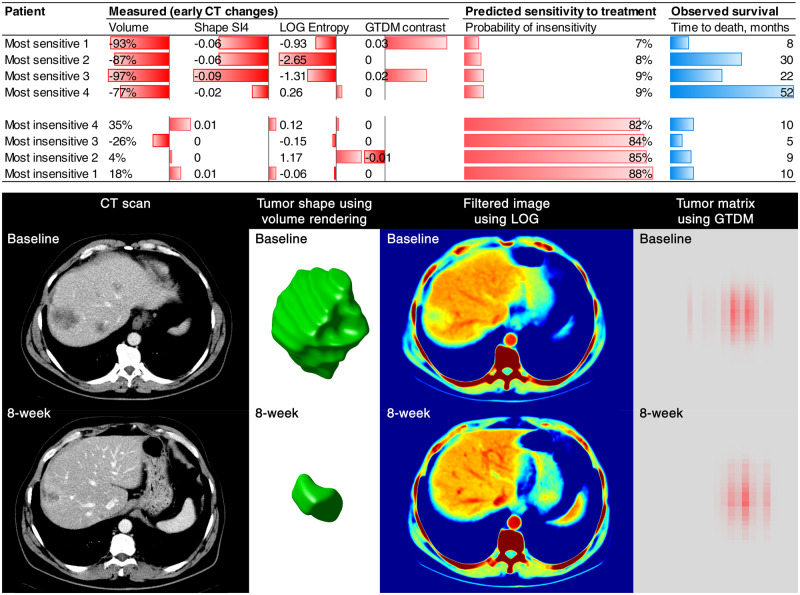
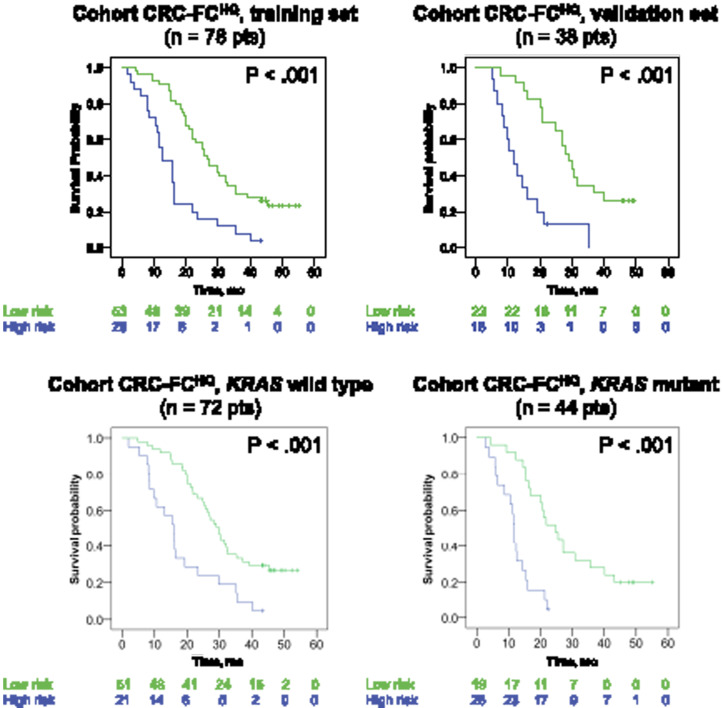
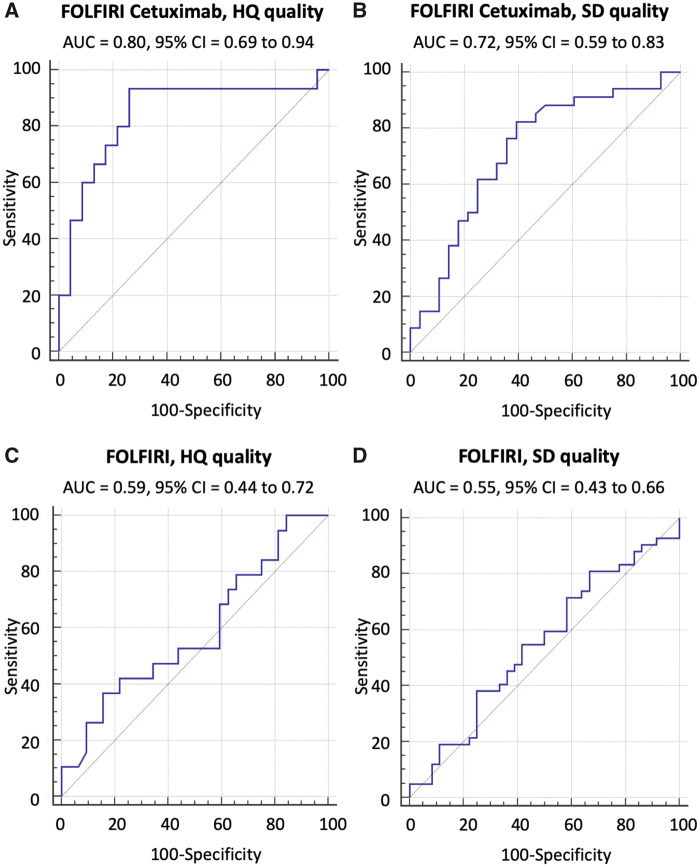
Results: The signature (area under the ROC curve [95% confidence interval (CI)]) used temporal decrease in tumor spatial heterogeneity plus boundary infiltration to successfully predict sensitivity to antiepidermal growth factor receptor therapy (FCHQ: 0.80 [95% CI = 0.69 to 0.94], FCSD: 0.72 [95% CI = 0.59 to 0.83]) but failed with chemotherapy (FHQ: 0.59 [95% CI = 0.44 to 0.72], FSD: 0.55 [95% CI = 0.43 to 0.66]). In cetuximab-containing sets, radiomics signature outperformed existing biomarkers (KRAS-mutational status, and tumor shrinkage by RECIST 1.1) for detection of treatment sensitivity and was strongly associated with OS (two-sided P < .005).

Conclusions: Radiomics response signature can serve as an intermediate surrogate marker of OS. The signature outperformed known biomarkers in providing an early prediction of treatment sensitivity and could be used to guide cetuximab treatment continuation decisions.


Figures

Figure 1.
Figure 1.
CONSORT diagram. Patients could be excluded for multiple reasons. The withdrawal boxes show the number of patients excluded at each step. LM = liver metastasis; T = training set; V = validation set. The artificial intelligence (AI) signature was developed (training set) and validated (validation set) in the FOLFIRI+cetuximab discovery cohort with high-quality (HQ) dataset.
Figure 2.
Figure 2.
Artificial intelligence (AI) workflow. Steps 1–2: Computed tomography (CT) scans acquired at study sites are transferred to our academic core. Step 3. Image selection and quality check using a computer-aided algorithm designed by machine-learning. Step 4. Segmentation of liver metastases on CT scan by an expert radiologist at baseline and 8 weeks in each patient. Step 5. Combination of all segmented lesions to compute a tumor imaging phenotype in each patient based on imaging features extraction in each segmented liver metastasis (3499 imaging features characterizing changes between baseline and 8 weeks). Step 6. Dimension reduction using machine learning. Identification of reproducible, nonredundant and informative candidate imaging features for model building. Step 7. Candidate model building to enhance strategic decision-making (training set). Step 8. Optimal model selection in the training set using threefold cross-validation to evaluate the performance of candidate models in terms of area under the receiver operating characteristic curve. Step 9. Signature validation (validation set).
Figure 3.
Figure 3.
Visual representation of the four imaging features included in the signature. The changes in the radiomics features in the patients with the lowest and the highest probability of insensitivity to treatment according to the radiomics signature are presented on this graph (most sensitive 1–4 vs most insensitive 1–4). The changes in tumor imaging phenotype of the patient “most sensitive 1” is displayed below. As demonstrated, CT-scan images are transformed to other mathematical spaces for feature extraction, for example, CT image is transformed to LOG space for computing the entropy value (spatial heterogeneity), and tumor pixels within segmentation contour are transformed to GTDM matrix for computing the contrast value.
Figure 4.
Figure 4.
Risk stratification using the signature in the discovery cohort. The discovery cohort included mCRC patients treated with FOLFIRI+ cetuximab. Kaplan-Meier graphs depicting overall survival in patients stratified at high-risk (signature >0.5) or low-risk (signature ≤0.5) at 8 weeks by the signature. P values are based on dataset-stratified two-sided log-rank tests. A, B) Survival probability in the training and in the validation sets. C, D) Survival probability in KRAS wild-type and KRAS mutant groups. CRC = colorectal cancer; F = FOLFIRI; FC = FOLFIRI+cetuximab; HQ= High computed tomography quality; SD = Standard computed tomography quality.
Figure 5.
Figure 5.
Performance of the signature in the validation sets of the three independent testing cohorts. CT quality was classified as high (HQ) or standard (SD). The Random Forest algorithm using the 4 Radiomics features signature developed and used in the FCHQ analysis was applied to the other training data sets for calibration. Then, its performance was validated in the four validation sets. Area under the receiver operating characteristic curve (AUC) and AUC’s 95% confidence interval (CI) were used to indicate classification performance. The signature (AUC [95CI]) used temporal decrease in tumor spatial heterogeneity plus boundary infiltration to successfully predict sensitivity to anti-EGFR therapy (FCHQ [A], FCSD [B]) but failed with chemotherapy (FHQ [C], FSD [D]). F = FOLFIRI; FC = FOLFIRI+cetuximab; HQ= High computed tomography quality; SD = Standard computed tomography quality.

Comment in

  • The Evolving Status of Radiomics.
    Alderson PO, Summers RM. Alderson PO, et al. J Natl Cancer Inst. 2020 Sep 1;112(9):869-870. doi: 10.1093/jnci/djaa018. J Natl Cancer Inst. 2020. PMID: 32016420 Free PMC article. No abstract available.

Similar articles

Cited by

References

    1. Van Cutsem E, Cervantes A, Nordlinger B,. et al. Metastatic colorectal cancer: ESMO Clinical Practice Guidelines for diagnosis, treatment and follow-up. Ann Oncol. 2014;25(suppl 3):iii1–9. - PubMed
    1. Schwartz LH, Mazumdar M, Brown W, et al. Variability in response assessment in solid tumors: effect of number of lesions chosen for measurement. Clin Cancer Res. 2003;9(12):4318–4323. - PubMed
    1. Oxnard GR, Zhao B, Sima CS, et al. Variability of lung tumor measurements on repeat computed tomography scans taken within 15 minutes. J Clin Oncol. 2011;29(23):3114–3119. - PMC - PubMed
    1. Zhao B, James LP, Moskowitz CS, et al. Evaluating variability in tumor measurements from same-day repeat CT scans of patients with non-small cell lung cancer. Radiology. 2009;252(1):263–272. - PMC - PubMed
    1. Zhao B, Tan Y, Bell DJ, et al. Exploring intra- and inter-reader variability in uni-dimensional, bi-dimensional, and volumetric measurements of solid tumors on CT scans reconstructed at different slice intervals. Eur J Radiol. 2013;82(6):959–968. - PMC - PubMed

Publication types

MeSH terms