. 2020 Mar 18;48(5):2544-2563.
doi: 10.1093/nar/gkaa047.

Differential evolution in 3'UTRs leads to specific gene expression in Staphylococcus

Affiliations

Differential evolution in 3'UTRs leads to specific gene expression in Staphylococcus

Pilar Menendez-Gil et al. Nucleic Acids Res. .

Abstract

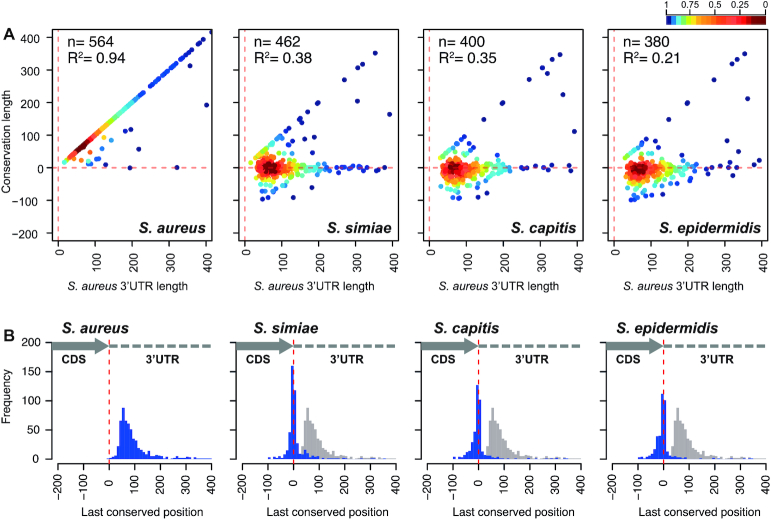
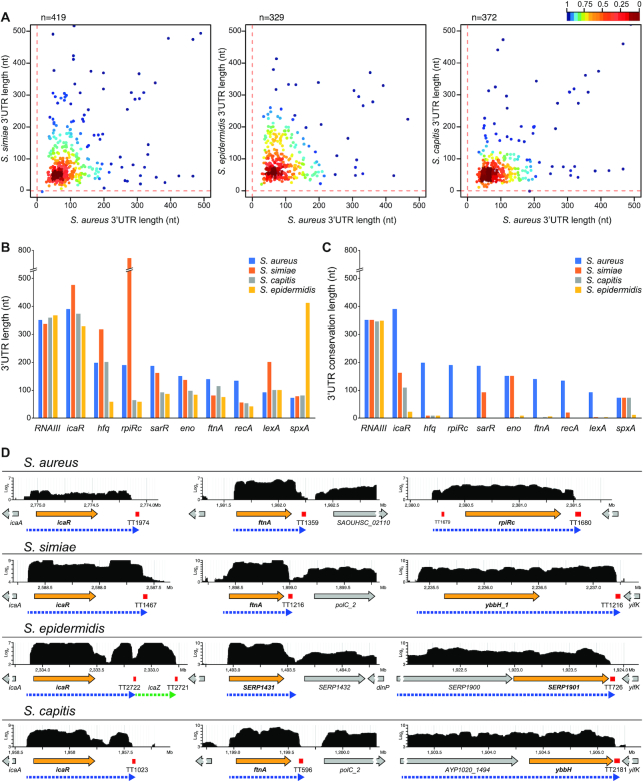
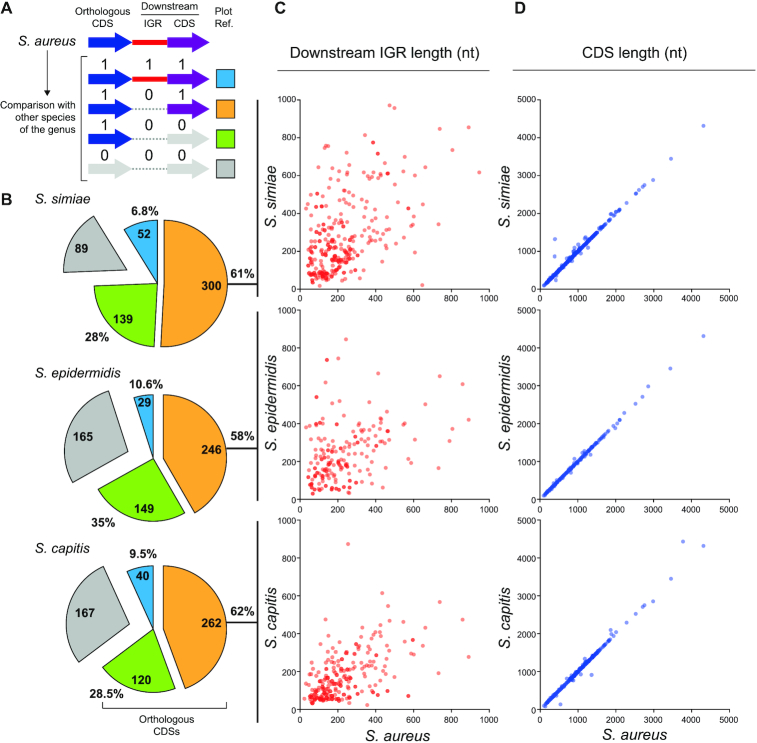
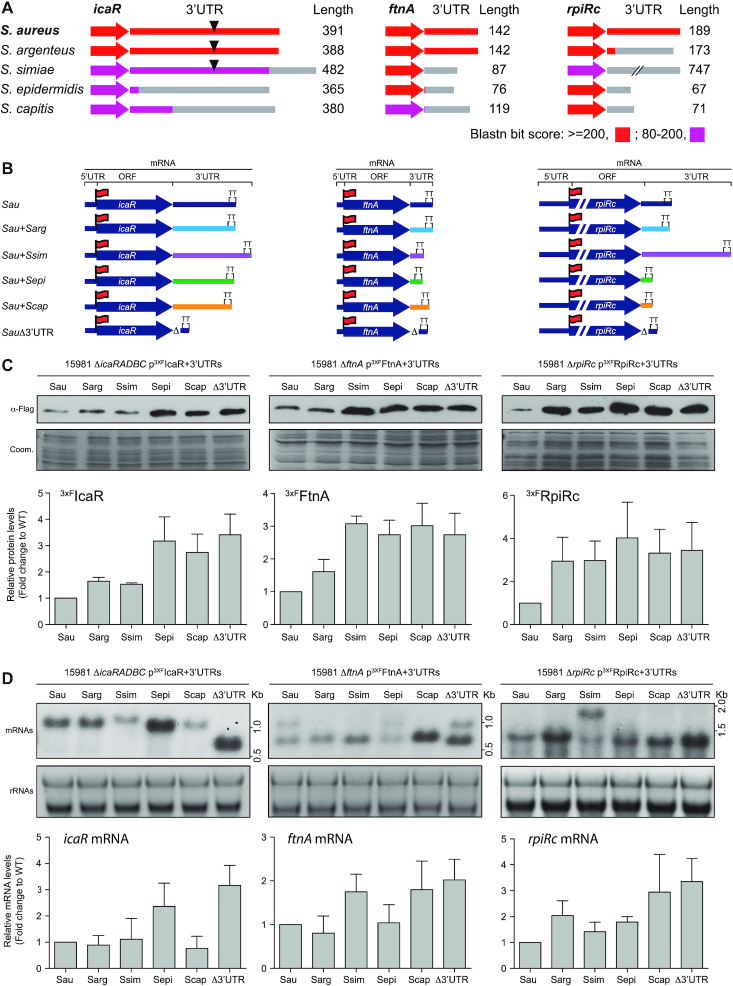
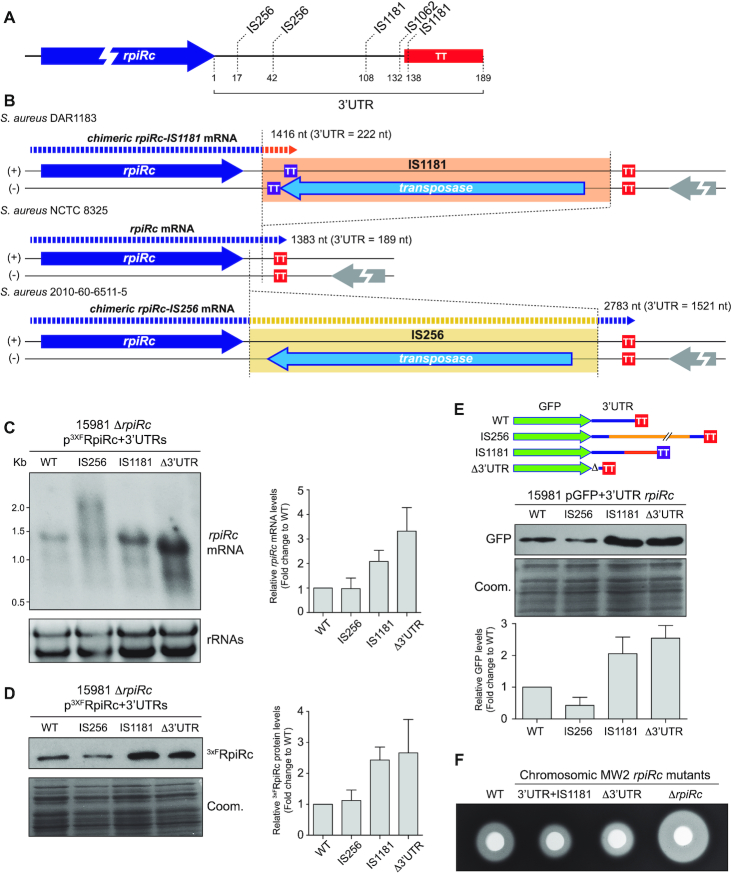
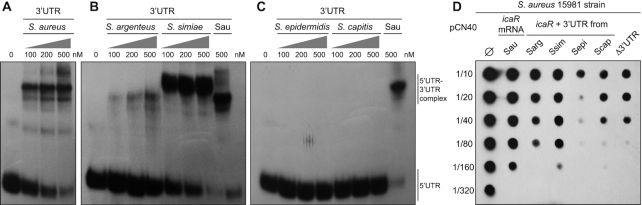
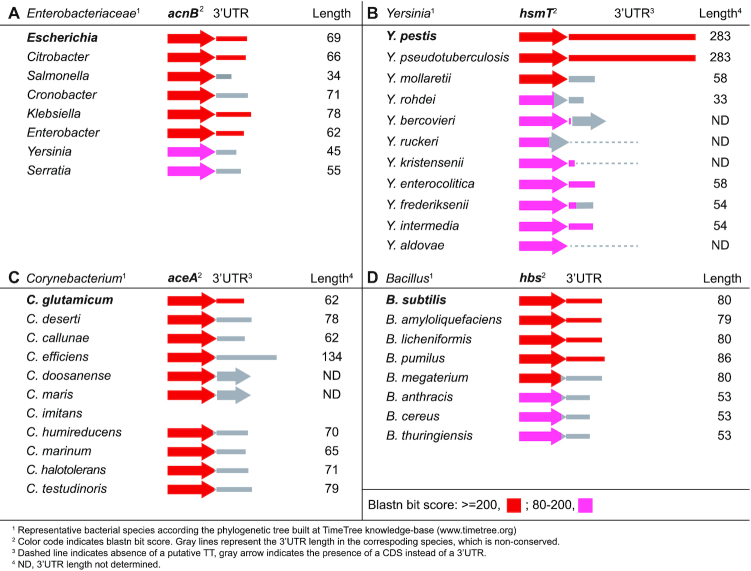
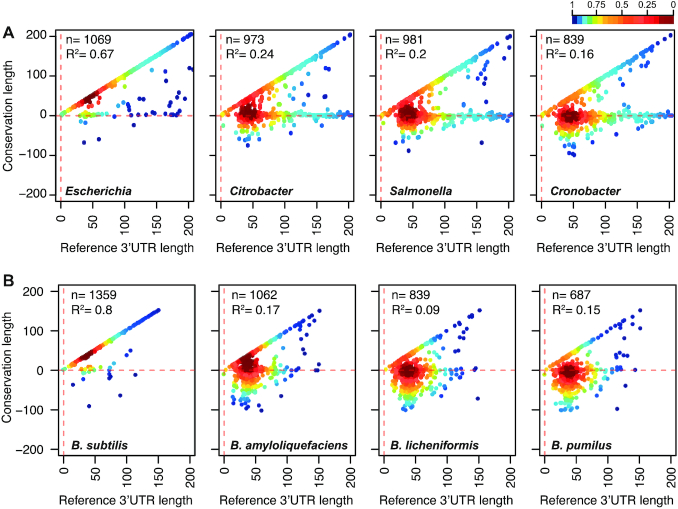
The evolution of gene expression regulation has contributed to species differentiation. The 3' untranslated regions (3'UTRs) of mRNAs include regulatory elements that modulate gene expression; however, our knowledge of their implications in the divergence of bacterial species is currently limited. In this study, we performed genome-wide comparative analyses of mRNAs encoding orthologous proteins from the genus Staphylococcus and found that mRNA conservation was lost mostly downstream of the coding sequence (CDS), indicating the presence of high sequence diversity in the 3'UTRs of orthologous genes. Transcriptomic mapping of different staphylococcal species confirmed that 3'UTRs were also variable in length. We constructed chimeric mRNAs carrying the 3'UTR of orthologous genes and demonstrated that 3'UTR sequence variations affect protein production. This suggested that species-specific functional 3'UTRs might be specifically selected during evolution. 3'UTR variations may occur through different processes, including gene rearrangements, local nucleotide changes, and the transposition of insertion sequences. By extending the conservation analyses to specific 3'UTRs, as well as the entire set of Escherichia coli and Bacillus subtilis mRNAs, we showed that 3'UTR variability is widespread in bacteria. In summary, our work unveils an evolutionary bias within 3'UTRs that results in species-specific non-coding sequences that may contribute to bacterial diversity.


Figures

Figure 1.
Figure 1.
High-throughput conservation analysis of 3′UTRs from mRNAs encoding orthologous proteins among phylogenetically-related staphylococcal species. (A) Scatter plots representing the conservation of 3′ end regions of S. aureus mRNAs compared to different closely-related staphylococcal species. The S. aureus NCTC 8325 3′UTR sequence query database was compared by blastn to S. aureus MW2, S. simiae NCTC13838, S. capitis AYP1020 and S. epidermidis RP62A genome sequences. Each dot represents the last conserved nucleotide (y axis) of a specific species in function of the S. aureus 3′UTR length (x axis). Based on the transcriptomic maps previously described (5), each query sequence included the last 200 nucleotides of the corresponding CDS plus the whole 3′UTR of monocistronic mRNAs. The plot was coloured by applying the Kernel density estimation, which indicates the proximity of the dots: blue, isolated dots; red, overlapping dots. The number (n) of plotted mRNAs encoding orthologous proteins and the square correlation coefficient (R2) are indicated. (B) Histogram plots showing the distribution of the last conserved nucleotide position (blue bars) among the S. aureus monocistronic mRNAs compared to the indicated staphylococcal species. Each blue bar represents the number of conserved 3′UTRs at a given position in windows of 10 nt (width of the bar). Grey bars represent the S. aureus distribution, which is included as a reference. The dashed red line indicates the position of the stop codon.
Figure 2.
Figure 2.
The lengths of the 3′UTRs do not correlate among staphylococcal species. (A) Scatter plots representing the real 3′UTR lengths of each staphylococcal species in function of the 3′UTR lengths of the corresponding orthologous S. aureus mRNAs. The length of the 3′UTRs from S. aureus orthologous monocistronic mRNAs were annotated by combining the transcriptomic data and the prediction of Rho-independent transcriptional terminators by TransTermHP (32). Only 3′UTRs shorter than 500 nt are represented. The plot was coloured by applying the Kernel density estimation, which indicates the proximity of the dots: blue, isolated dots; red, overlapping dots. (B) Plot representing the 3′UTR length of relevant orthologous genes in the indicated staphylococcal species. (C) Plot representing the 3′UTR conservation length of the orthologous genes analysed in B, which was determined by the blastn algorithm. RNAIII is included as an example of an mRNA with a highly conserved 3′UTR. (D) Browser images showing the RNA transcribed from the icaR, ftnA and rpiRc chromosomic regions of the S. aureus, S. simiae, S. epidermidis and S. capitis strains. The RNA-seq data was mapped to the corresponding genomes, and the transcriptomic maps were loaded onto a server based on Jbrowse (27). The complete transcriptomic maps are available at http://rnamaps.unavarra.es/.
Figure 3.
Figure 3.
Nucleotide sequence variation occurring downstream of orthologous CDSs may explain 3′UTR diversity. (A) Schematic representation of the conservation analysis performed on IGRs and CDSs located downstream of an orthologous CDS. Whole-genome comparisons between S. aureus and its phylogenetically-related species were performed using Mauve (49). Values 1 and 0 were assigned to conserved and non-conserved IGRs/CDSs, respectively, and a different colour was attributed depending on the conservation configuration. Blue: the IGR and CDS downstream of the orthologous CDS are conserved; orange: the downstream CDS is conserved but not the IGR; green: both downstream regions are not conserved, and grey: no orthologous CDS was found in the analysed species. (B) Pie chart quantifying the different categories represented in A. (C) Plot showing the length of the IGR downstream of each orthologous CDS in the different species compared to that of S. aureus. (D) Plot showing the length of the orthologous CDS in the different species compared to that of S. aureus. Note that only the IGRs and CDSs that fall under the orange category are plotted in C and D.
Figure 4.
Figure 4.
Changes in 3′UTRs sequences affect protein expression. (A) Schematic representation of the conservation analysis of the icaR, ftnA and rpiRc mRNAs among phylogenetically-related species. The colour code indicates the blastn bit score. The 3′UTR lengths in the corresponding species are indicated and represented as grey lines. Black triangles indicate the presence of the UCCCC motif. (B) Schematic representation of the constructed chimeric mRNAs, which comprises the S. aureus CDS and a 3′UTR from a different staphylococcal species (for strains and plasmids details see supplementary data). Red flags indicate the insertion of the 3xFLAG tag in the N-terminus. (C) Western blot showing the levels of an orthologous protein when it is expressed from different chimeric mRNAs. The Western blot was developed using peroxidase conjugated anti-FLAG antibodies. A Coomassie stained gel portion is shown as a loading control. (D) Northern blot showing the mRNA levels expressed from the constructs represented in B. These were detected using CDS-specific antisense radiolabelled RNA probes. Ribosomal RNAs stained with Midori Green are shown as loading controls. Western and Northern blots images show the representative results from at least three independent replicates. Protein and mRNA levels were quantified by densitometry of Western blot images and Northern blot autoradiographies using ImageJ (http://rsbweb.nih.gov/ij/). Each of the protein or mRNA levels was normalized to the levels of S. aureus. Sau, S. aureus; Sarg, S.argenteus; Ssim,S. simiae; Sepi, S. epidermidis; Scap,S. capitis.
Figure 5.
Figure 5.
Disruption of the rpiRc 3′UTR sequence by IS transposition events affects the expression of RpiRc. (A) Schematic representation showing the main insertion sites of ISs in the rpiRc 3′UTR of S. aureus. (B) Schematic representation showing the putative chimeric mRNAs that are generated when IS1181 and IS256 are inserted in the rpiRc 3′UTR of the S. aureus DAR1183 and 2010-60-6511-5 strains, respectively. Since IS1181 harbours a stem loop that serves as a transcriptional terminator (TT) in the same strand as the rpiRc gene, which is opposite to the transposase gene, the insertion generates a chimeric 3′UTR that is 222 nt-long. In contrast, the IS256 lacks TTs, generating a chimeric mRNA that includes the whole IS256 sequence. (C) Northern blots showing the mRNA levels expressed from the constructs harbouring the WT rpiRc gene and the IS insertions that mimic the configurations found in the S. aureus DAR1183 and 2010-60-6511-5 strains. The plasmid expressing the rpiRc mRNA Δ3′UTR was included as a control. The mRNA levels of rpiRc were detected with a CDS-specific antisense radiolabelled RNA probe. Ribosomal RNAs stained with Midori Green are shown as loading controls. (D) Western blot showing the 3xFRpiRc protein levels expressed from the constructions used in C. The Western blot was developed using peroxidase conjugated anti-FLAG antibodies. A Coomassie stained gel portion is shown as a loading control. The Western and Northern blot images show the representative results from at least three independent experiments. The protein and mRNA levels were quantified by densitometry of Western blot and Northern blot autoradiographies using ImageJ (http://rsbweb.nih.gov/ij/). Each of the protein or mRNA levels was normalized to the levels of the WT rpiRc mRNA. (E) Western blot showing the GFP protein levels of the constructs harbouring the gfp fused to the 3′UTR, 3′UTR+IS256, 3′UTR+IS1181 of rpiRc and the Δ3′UTR as a control. Western blot was developed using monoclonal anti-GFP antibodies and quantified as described in D. (F) Haemolytic halos produced by the haemolysins contained in the supernatant of the cultures from S. aureus MW2 wild-type (WT) and their isogenic chromosomic mutants: Δ3′UTR, ΔrpiRc and 3′UTR+IS1181. The supernatants were concentrated 10 times and loaded into 5-mm holes in Columbia Sheep blood (5%) agar plates.
Figure 6.
Figure 6.
Species-specific variations in icaR 3′UTRs resulted in different PIA-PNAG levels. Electrophoretic mobility shift assays (EMSAs) between the synthetic S. aureus icaR 5′UTR and the synthetic icaR 3′UTR from: (A) S. aureus as a positive control; (B) S. argenteus and S. simiae, which carry the UCCCC motif necessary for 5′’UTR interaction, as previously described (5); (C) S. epidermidis and S. capitis, which lack the UCCCC motif. The autoradiographies of the band-shifts result from incubating a 32P-labelled synthetic S. aureus 5′UTR RNA fragment (40,000 cpm) with increasing amounts of the different synthetic 3′UTR RNAs (100–500 nM). The UTR complexes are indicated on the right side of the autoradiography. (D) Quantification of PIA-PNAG exopolysaccharide production in the S. aureus 15981 strains expressing the different chimeric icaR mRNAs. Serial dilutions of the samples were spotted onto nitrocellulose membranes and PIA-PNAG expression was developed with specific anti-PIA-PNAG antibodies. ∅ indicates the presence of an empty pCN40 plasmid. Sau, S. aureus; Sarg, S. argenteus; Ssim, S. simiae; Sepi, S. epidermidis; Scap, S. capitis. Images show representative results from at least two independent experiments.
Figure 7.
Figure 7.
Schematic representation of the conservation analysis of regulatory 3′UTRs among phylogenetically-related species. Blastn analyses were performed using the E. coli acnB (A), Y. pestis hmsT (B), C. glutamicum aceA (C) and B. subtilis hbs (D) mRNAs as queries, which carried 3′UTRs with proven regulatory capacities (4,6–8). The colour code indicates the blastn bit score. The estimated 3′UTR lengths are indicated and represented by grey lines.
Figure 8.
Figure 8.
3′UTR sequence variations are widely distributed in bacteria. Scatter plots representing the conservation of the 3′ end regions of E. coli (A) and B. subtilis (B) mRNAs compared to their corresponding 3′ end regions in phylogenetically-related species. The E. coli BW25113 3′UTR sequence query database was compared to the E. coli O157-H7 str EC4115, Citrobacter koseri ATCC BAA-895, Salmonella Typhimurium SL1344 and Enterobacter aerogenes KCTC 2190 strains. The B. subtilis 168 3′UTR sequence query database was compared to the B. subtilis OH 131.1, B. amyloliquefaciens DSM7, B. licheniformis ATCC 14580, and B. pumilus SH-B9 strains. Each dot represents the last conserved nucleotide, according to blastn, of an indicated species (y axis) in function of the E. coli and B. subtilis 3′UTR lengths (x axis). The plot was coloured by applying the Kernel density estimation, which indicates the proximity of the dots. Blue: isolated dots; red: overlapping dots. The number (n) of plotted mRNAs encoding orthologous proteins and the square correlation coefficient (R2) are indicated.

Similar articles

Cited by

References

    1. Waters L.S., Storz G.. Regulatory RNAs in bacteria. Cell. 2009; 136:615–628. - PMC - PubMed
    1. Gripenland J., Netterling S., Loh E., Tiensuu T., Toledo-Arana A., Johansson J.. RNAs: regulators of bacterial virulence. Nat. Rev. Micro. 2010; 8:857–866. - PubMed
    1. Bouloc P., Repoila F.. Fresh layers of RNA-mediated regulation in Gram-positive bacteria. Curr. Opin. Microbiol. 2016; 30:30–35. - PubMed
    1. Maeda T., Wachi M.. 3′ untranslated region-dependent degradation of the aceA mRNA, encoding the glyoxylate cycle enzyme isocitrate lyase, by RNase E/G in Corynebacterium glutamicum. Appl. Environ Microbiol. 2012; 78:8753–8761. - PMC - PubMed
    1. Ruiz de Los M,I., Vergara-Irigaray M., Segura V., Villanueva M., Bitarte N., Saramago M., Domingues S., Arraiano C.M., Fechter P., Romby P. et al.. Base pairing interaction between 5′- and 3′-UTRs controls icaR mRNA translation in Staphylococcus aureus. PLoS Genet. 2013; 9:e1004001. - PMC - PubMed

Publication types