. 2020 Apr 17;48(7):3869-3887.
doi: 10.1093/nar/gkaa067.

Concurrent binding to DNA and RNA facilitates the pluripotency reprogramming activity of Sox2

Affiliations

Concurrent binding to DNA and RNA facilitates the pluripotency reprogramming activity of Sox2

Linlin Hou et al. Nucleic Acids Res. .

Abstract

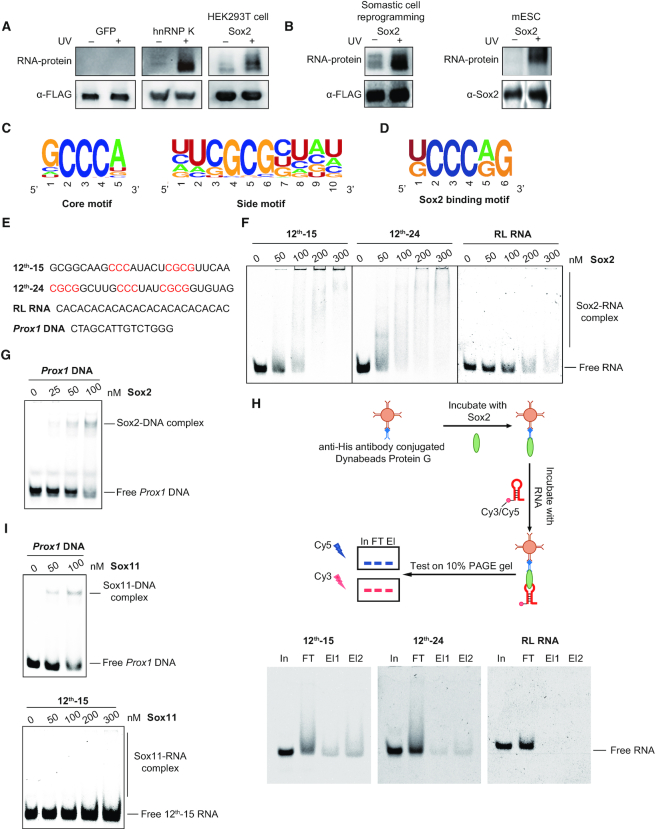
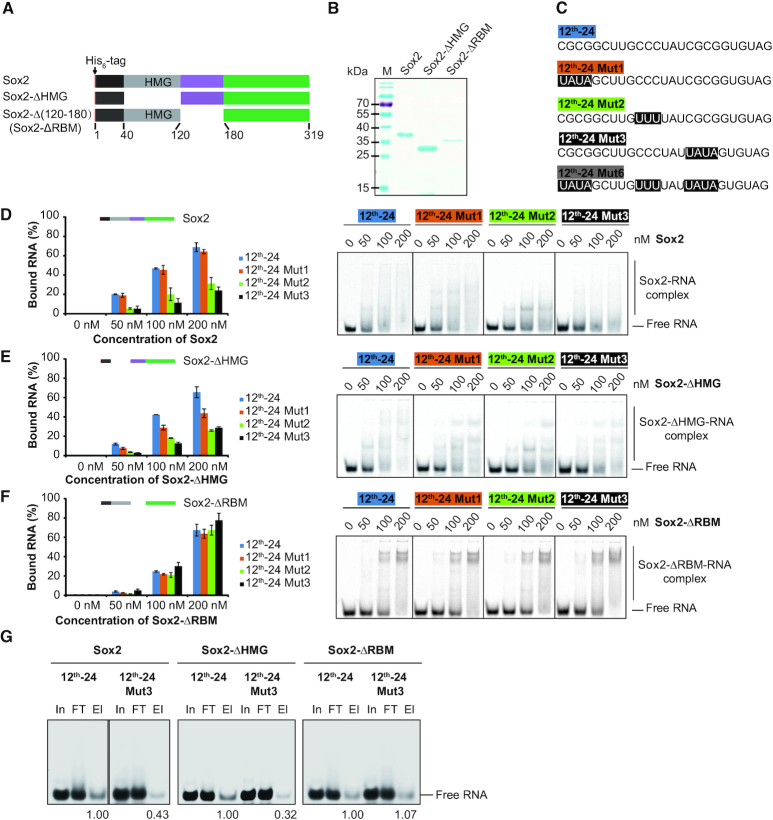
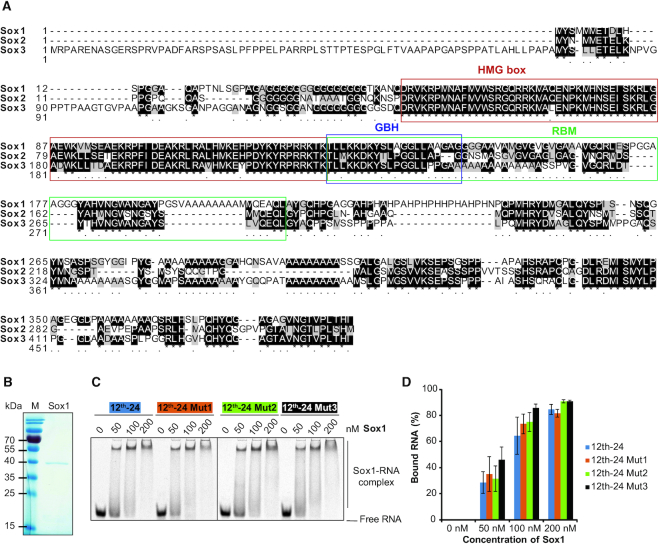
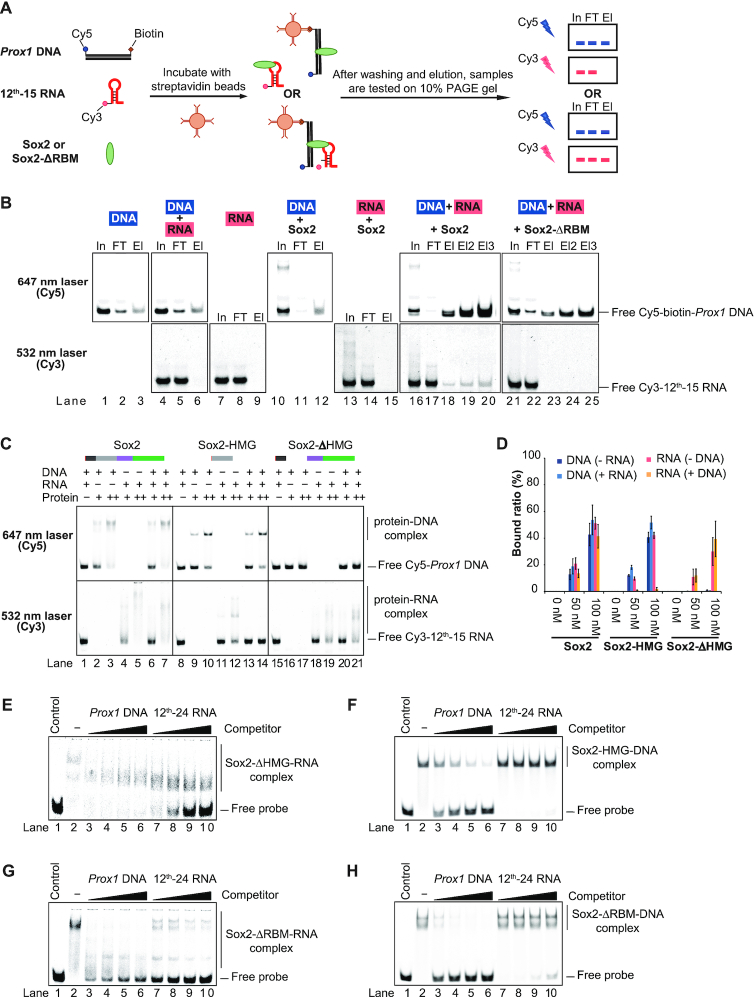
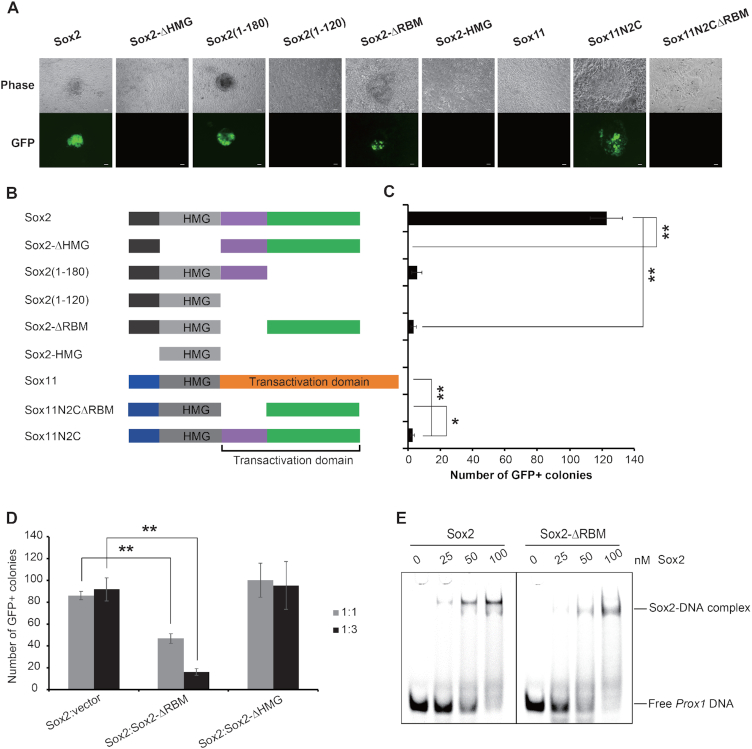
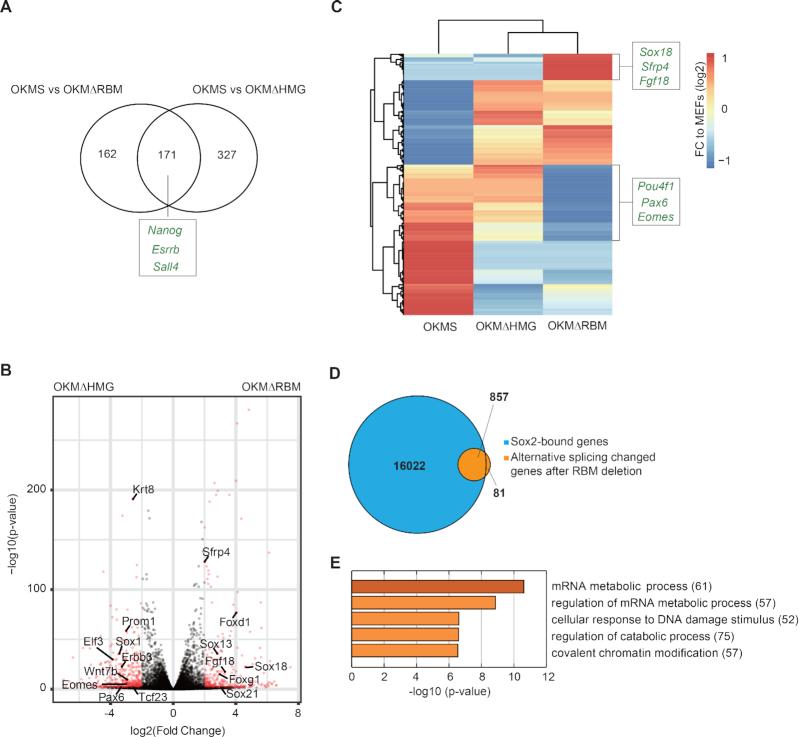
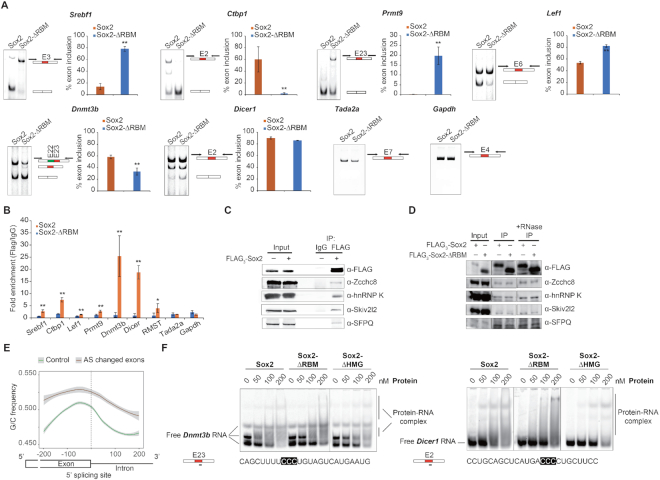
Some transcription factors that specifically bind double-stranded DNA appear to also function as RNA-binding proteins. Here, we demonstrate that the transcription factor Sox2 is able to directly bind RNA in vitro as well as in mouse and human cells. Sox2 targets RNA via a 60-amino-acid RNA binding motif (RBM) positioned C-terminally of the DNA binding high mobility group (HMG) box. Sox2 can associate with RNA and DNA simultaneously to form ternary RNA/Sox2/DNA complexes. Deletion of the RBM does not affect selection of target genes but mitigates binding to pluripotency related transcripts, switches exon usage and impairs the reprogramming of somatic cells to a pluripotent state. Our findings designate Sox2 as a multi-functional factor that associates with RNA whilst binding to cognate DNA sequences, suggesting that it may co-transcriptionally regulate RNA metabolism during somatic cell reprogramming.


Figures

Figure 1.
Figure 1.
Sox2 preferentially binds G/C-rich RNA sequences. (A) RNA binding activity of Sox2 was detected by PAR-CLIP. The upper panel shows the protein-bound RNA detected by biotin chemiluminescence. Antibody against FLAG tag was used to confirm the protein size and as loading control. FLAG-tagged Sox2, GFP (negative control) and hnRNP K (positive control) were expressed in HEK293T cells. (B) Same as in (A), FLAG-tagged Sox2 was expressed in MEFs at day 6 of pluripotency reprogramming, and endogenous Sox2 antibody was used in mESCs. Antibody against Sox2 or FLAG tag was used to confirm the protein size and as loading control. (C) Consensus motifs discovered by MEME in sequences enriched after 12 rounds of RNA SELEX with full length His6-Sox2 as bait (Supplementary Table S2). (D) Consensus motifs found by MEME in PAR-CLIP sequencing data for Sox2 expressed in HEK293T cells. (E) Nucleic acid ligands used for the EMSAs in (F–I). Bases highlighted in red are the SELEX consensus. 12th-15 RNA and 12th-24 RNA are Cy3- or Cy5-labelled RNA selected by SELEX after 12-round enrichment; RL RNA is a randomly chosen CA-rich RNA from the original RNA library; Prox1 DNA is a Cy5-labelled DNA with Sox2-binding motif. (F) EMSAs for the binding of 0–300 nM Sox2 to 50 nM fluorescently-labelled RNAs. The concentrations of Sox2 are as indicated above each panel. Shift patterns of free RNA and RNA bound by Sox2 (Sox2-RNA complex) are labelled to the right. (G) EMSAs of Cy5-labelled Prox1 DNA (50 nM) with increasing concentrations (0–100 nM) of Sox2. (H) In vitro RIP with 100 nM Sox2 and 100 nM fluorescently-labelled RNAs. In: input; FT: flow-through; El: elution. (I) EMSAs of Cy5-labelled Prox1 DNA (50 nM) (left panel) or Cy3-labelled 12th-15 RNA (50 nM) (right panel) with increasing concentrations of Sox11.
Figure 2.
Figure 2.
Identification of a novel RNA binding motif of Sox2. (A) Schematic representation of the His6-Sox2 constructs used for binding assays. (B) Coomassie stained 12% SDS-PAGE with purified His6-Sox2 constructs. M: protein marker and sizes are given in kDa. (C) RNA ligands used for the EMSAs. Bases shaded in black denote sequences that are altered between the SELEX consensus (12th-24) and mutant versions (12th-24 Mut1, 12th-24 Mut2, 12th-24 Mut3 and 12th-24 Mut6). (D–F) Comparison of the binding activities of Sox2 constructs to the 12th-24 RNA and mutants thereof. Fractions of bound RNA (left panels) were determined by EMSAs (right panels) using densitometric analysis using the ImageQuantTL software. Barplots represent the mean ± SD (n = 3). (G) In vitro RIP with 100 nM Sox2 construct and 100 nM fluorescently-labelled RNAs. The names of Sox2 constructs and RNA substrates are as indicated above each panel. In: input; FT: flow-through; El: elution. Relative levels of eluted 12th-24 and 12th-24 Mut3 are noted.
Figure 3.
Figure 3.
The group B homology domain does not confer sequence selective RNA binding. (A) Multiple sequence alignment of mouse SoxB1 group done with ClustalX 2.0.9 (http://www.clustal.org/download/2.0.9/). The DNA-binding HMG domains are framed in red. The RNA-binding motif (RBM) of Sox2 and its N-terminal part corresponding to the group B homology domain are boxed in green or blue, respectively. (B) Recombinant Sox1 resolved by SDS-PAGE and visualized by Coomassie staining. M: protein size markers in kDa. (C, D) Comparison of the binding of Sox1 to 12th-24 RNA and its mutants. Representative EMSAs are shown in (C) and the fractional RNA binding is plotted in (D). The concentrations of Sox1 are as indicated and complexes are labelled to the right. Data are represented as mean ± SD (n = 2).
Figure 4.
Figure 4.
Sox2 forms a ternary complex with DNA and RNA. (A) Schematic representation of the RNA fishing experiment to test for the simultaneous binding of RNA and DNA to Sox2. (B) After immobilization of biotinylated DNA on magnetic streptavidin beads and washing, the eluates were analysed by native 10% PAGE gels. Components of the reaction mixtures are labelled on the top of each gel. The lasers used to sequentially detect Cy5-labelled DNA and Cy3-labelled RNA are indicated to the left. Results shown in the same column in upper or lower panels were from identical gels but scanned with different lasers. In: input; FT: flow-through; El: elution. (C) EMSAs of Sox2 constructs with Cy5-DNA and Cy3-RNA. Concentrations of DNA, RNA and protein are labelled with ‘–’, ‘+’ and ‘++’ indicating 0 nM, 50 nM and 100 nM, respectively. In each column, the upper panel and bottom panel are results from identical gels but scanned with the Cy5 (top) or the Cy3 excitation wavelength (bottom). (D) Quantification of the results shown in (C). The barplot shows the mean ± SD (n = 3). (E–H) Competition EMSAs using Sox2-ΔHMG-Cy5-RNA (E), Sox2-HMG-Cy5-DNA (F), Sox2-ΔRBM-RNA (G) and Sox2-ΔRBM-DNA (H) complexes with increasing concentrations of unlabelled Prox1 DNA or unlabelled 12th-24 RNA (from 500 to 4000 nM). Control: free Cy5-Prox1 DNA or Cy5-12th-24 RNA only; ‘-’, Cy5-Prox1 DNA or Cy5-12th-24 RNA with Sox2 constructs but without competitor.
Figure 5.
Figure 5.
Deletion of the Sox2 RBM impairs iPSC generation. (A) Morphology of mouse iPSCs generated by Sox2 or Sox11 constructs in combination with Oct4, c-Myc and Klf4 under LIF/Serum conditions generated from OG2 MEFs expressing a transgenic Oct4-GFP reporter. Colonies were photographed using a fluorescence microscope 12 days after the viral infection. The scale bar indicates 100 μm. (B) A schematic representation of Sox2 and Sox11 constructs used for iPSCs generation. (C) The iPSC generation efficiency of these constructs is presented by the absolute number of GFP-positive colonies in a well of a 12-well cell culture. Barplot shows the mean ± SD of three biological replicates and differences between selected samples were compared using ANOVA (* and ** indicate P-values of < 0.05 and < 0.01, respectively). (D) The numbers of iPSC colonies generated by Sox2 plus empty vector, Sox2-ΔRBM or Sox2-ΔHMG at 1:1 or 1:3 ratio of viral supernatants from three independent experiments are shown. Data are represented as mean ± SD, and ANOVA was used to assess significance (** indicates P-value of < 0.01). (E) Comparison of the binding activities of Sox2 and Sox2-ΔRBM to Prox1 DNA. The reactions were analyzed by EMSAs in 10% native PAGE gels. Concentrations of Sox2 constructs are labelled above each lane. Free DNA and protein-DNA complex are marked.
Figure 6.
Figure 6.
Deletion of the Sox2-RBM and Sox2-HMG have different effects on gene expression and splicing. (A) The Venn diagram compares gene sets differentially upregulated (determined with DESeq2 (38)) in OKMS versus OKMΔRBM with OKMS and OKMΔHMG. Examples of genes related to pluripotency that are depleted in both Sox2 deletion mutants compared to the OSKM control are marked. (B) Volcano plot highlighting differentially expressed genes determined with DESeq2 from OKMΔRBM and OKMΔHMG RNA-seq data. Genes at –log10(P-value) > 2 and absolute log2(fold change) value >0.5 are in red. Representative genes related to differentiation in OKMΔRBM are labelled on the right. (C) Differentially expressed genes upon OKSM, OKMΔHMG and OKMΔRBM are shown. The names of representative genes related to differentiation are depicted. (D) 938 transcripts were detected to undergo alternative splicing under Sox2-ΔRBM compared to Sox2 control conditions at day 12 of iPSC generation using rMATS (33). The Venn diagram shows the overlap genes bound by Sox2 (blue) at early reprogramming stages (35) and genes affected by alternative splicing after RBM deletion (orange). (E) The top five GO terms provided by metascape (http://www.metascape.org) of 857 genes shown in (D). The number of genes in each GO term is labelled in brackets.
Figure 7.
Figure 7.
Deletion of the Sox2-RBM affects exon selection and RNA binding. (A) RT-PCR assays examining mRNA splicing levels of a group of pluripotency-related genes (Srebf1, Ctbp1, Lef1, Prmt9, Dnmt3b and Dicer1) and control genes (Tada2a, Gapdh) at day 12 of iPSC generation under Sox2-ΔRBM or Sox2 control conditions. Histograms show quantifications of each RT-PCR measurements. Error bars represent the mean ± SD from two biological replicates. Differences were compared using ANOVA (** indicates P-value of < 0.01). (B) RIP of FLAG3-Sox2 and FLAG3-Sox2-ΔRBM using anti-FLAG. RIP enrichment was measured by qRT–PCR, and values were normalized to background immunoprecipitation measured by isotype IgG. ANOVA was used to assess statistical significance (* and ** indicate P-values of <0.05 and <0.01, respectively). (C) FLAG3-Sox2 was transfected into MEF cells along with Oct4, Klf4 and c-Myc. Co-immunoprecipitations were performed with IgG or anti-FLAG antibody and immunoblots with anti-FLAG, anti-Zcchc8, anti-hnRNP K, anti-Skiv2l2 and anti-SFPQ. (D) FLAG3-Sox2 or FLAG3-Sox2-ΔRBM was transfected into MEF cells along with Oct4, Klf4 and c-Myc. Co-immunoprecipitations were performed with anti-FLAG antibody and immunoblots with anti-FLAG, anti-Zcchc8, anti-hnRNP K, anti-Skiv2l2 and anti-SFPQ. (E) G/C content around the 5′ splice sites of exons affected by AS (red, n = 749) and exons not affected by AS (control, green, n = 14 342). The dotted black line highlights the 5′ splicing sites. (F) Comparison of the binding activities of Sox2 constructs to Dnmt3b and Dicer1 RNA. The locations and sequences of RNAs are marked under each panel. Fractions of bound RNA were determined by EMSAs on 10% native gels.

Similar articles

Cited by

References

    1. Hudson W.H., Ortlund E.A.. The structure, function and evolution of proteins that bind DNA and RNA. Nat. Rev. Mol. Cell Biol. 2014; 15:749–760. - PMC - PubMed
    1. Sigova A.A., Abraham B.J., Ji X., Molinie B., Hannett N.M., Guo Y.E., Jangi M., Giallourakis C.C., Sharp P.A., Young R.A.. Transcription factor trapping by RNA in gene regulatory elements. Science. 2015; 350:978–981. - PMC - PubMed
    1. Melikishvili M., Chariker J.H., Rouchka E.C., Fondufe-Mittendorf Y.N.. Transcriptome-wide identification of the RNA-binding landscape of the chromatin-associated protein PARP1 reveals functions in RNA biogenesis. Cell Discov. 2017; 3:17043. - PMC - PubMed
    1. Matveeva E., Maiorano J., Zhang Q., Eteleeb A.M., Convertini P.. Involvement of PARP1 in the regulation of alternative splicing. Cell Discov. 2016; 2:15046. - PMC - PubMed
    1. Kino T., Hurt D.E., Ichijo T., Nader N., Chrousos G.P.. Noncoding RNA gas5 is a growth arrest- and starvation-associated repressor of the glucocorticoid receptor. Sci. Signal. 2010; 3:ra8. - PMC - PubMed

Publication types