. 2020 Mar;34(3):4653-4669.
doi: 10.1096/fj.201902455R. Epub 2020 Feb 4.

Dynamics of transmissible gastroenteritis virus internalization unraveled by single-virus tracking in live cells

Affiliations

Dynamics of transmissible gastroenteritis virus internalization unraveled by single-virus tracking in live cells

Jian Wang et al. FASEB J. 2020 Mar.

Abstract

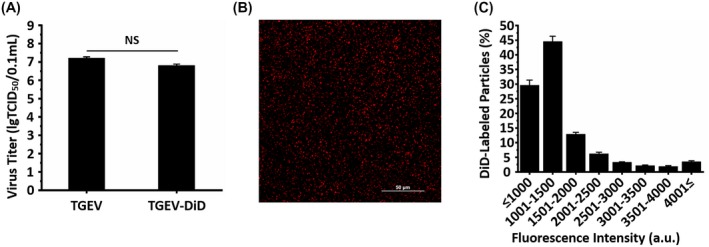
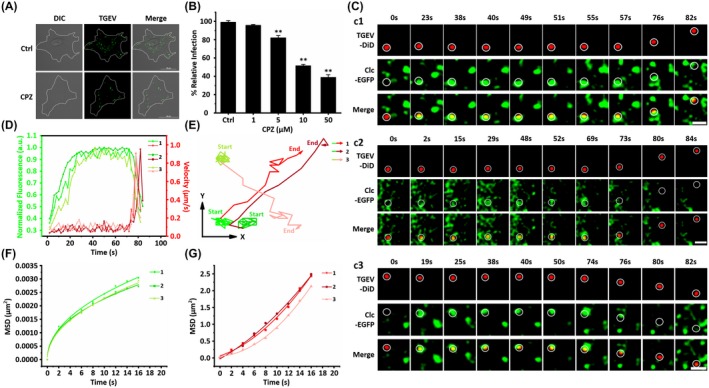
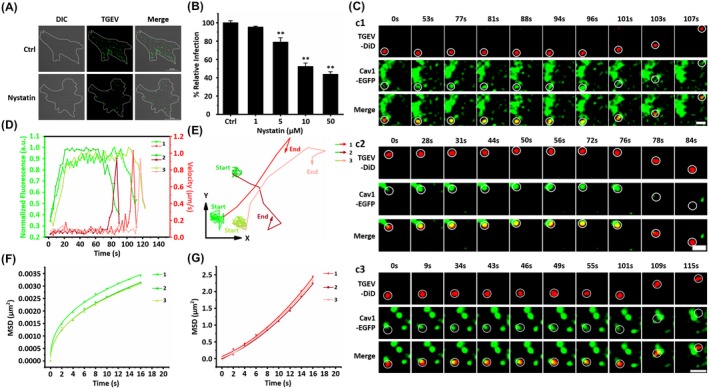
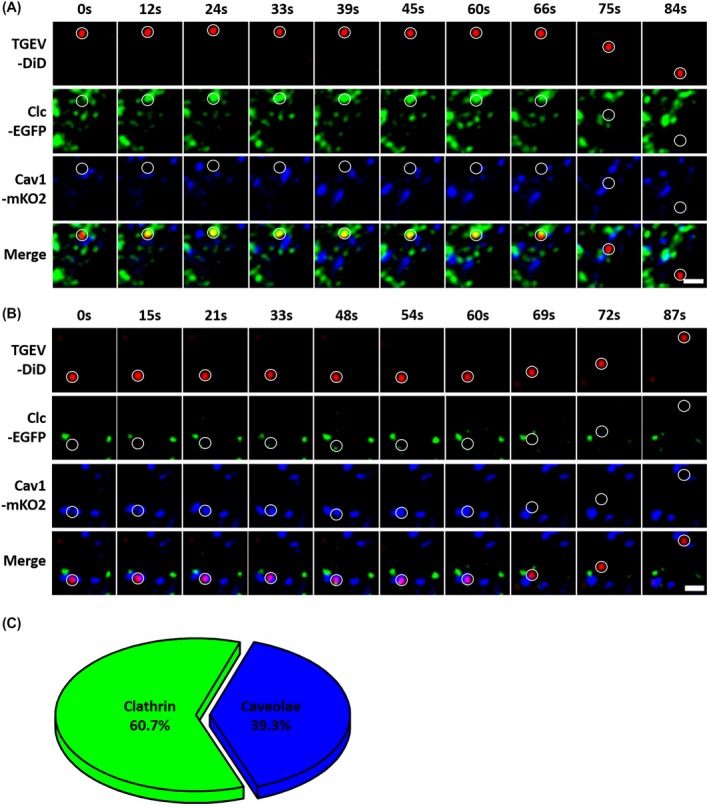
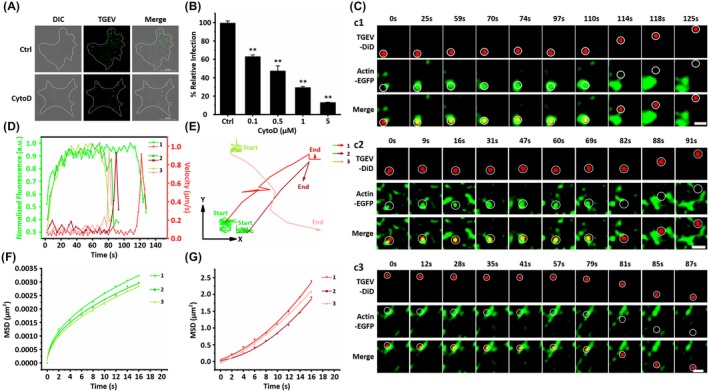
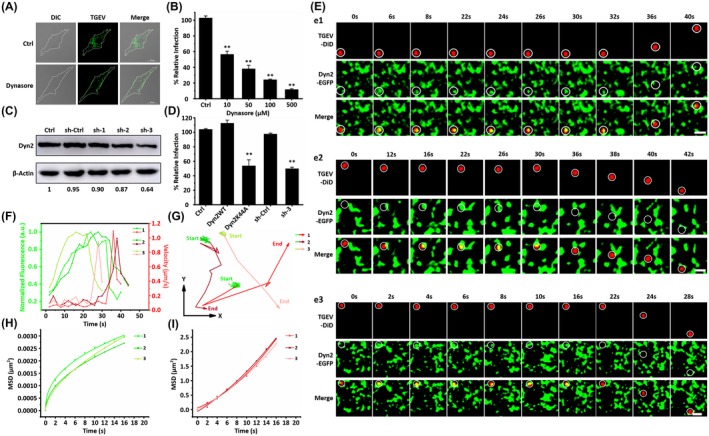
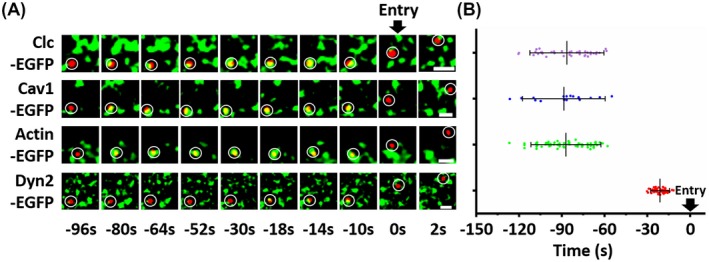
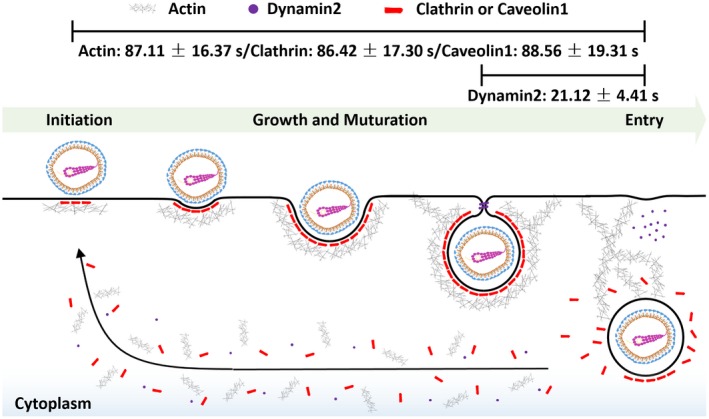
Transmissible gastroenteritis virus (TGEV) is a swine enteropathogenic coronavirus that causes significant economic losses in swine industry. Current studies on TGEV internalization mainly focus on viral receptors, but the internalization mechanism is still unclear. In this study, we used single-virus tracking to obtain the detailed insights into the dynamic events of the TGEV internalization and depict the whole sequential process. We observed that TGEVs could be internalized through clathrin- and caveolae-mediated endocytosis, and the internalization of TGEVs was almost completed within ~2 minutes after TGEVs attached to the cell membrane. Furthermore, the interactions of TGEVs with actin and dynamin 2 in real time during the TGEV internalization were visualized. To our knowledge, this is the first report that single-virus tracking technique is used to visualize the entire dynamic process of the TGEV internalization: before the TGEV internalization, with the assistance of actin, clathrin, and caveolin 1 would gather around the virus to form the vesicle containing the TGEV, and after ~60 seconds, dynamin 2 would be recruited to promote membrane fission. These results demonstrate that TGEVs enter ST cells via clathrin- and caveolae-mediated endocytic, actin-dependent, and dynamin 2-dependent pathways.

Keywords: TGEV; actin; caveolae; clathrin; dynamin 2.


Conflict of interest statement

The authors declared that they have no conflicts of interest to this work.

Figures

Figure 1
Figure 1
Performances of DiD‐labeled TGEVs. A, Virus titers of unlabeled and DiD‐labeled TGEVs. Data represent the results of three independent experiments implemented in triplicates. NS, nonsignificant. B, Representative image showing DiD‐labeled TGEVs visualized by fluorescence microscopy using a 647‐nm laser. Scale bar, 50 μm. C, Fluorescence intensity histogram of 198 062 individual DiD‐labeled TGEVs. The fluorescence intensity was analyzed using the NIS‐Elements software. a.u., arbitrary units. All graphs show mean ± SD
Figure 2
Figure 2
Live cell imaging of the TGEV internalization via clathrin‐mediated endocytosis. A, Representative immunofluorescence images of TGEVs in control and CPZ treated cells. The ST cells were treated or untreated with 10 μM CPZ for 30 min and subsequently inoculated with TGEVs for 2 h, and then the ST cells were fixed and the infected TGEVs were stained with the anti‐TGEV primary antibody and the fluorescent secondary antibody. Scale bar, 20 μm. B, Effects of CPZ with different concentrations on TGEV infection. The ST cells were treated or untreated with the indicated concentrations of CPZ for 30 min and inoculated with TGEVs for 2 h, subsequently, the relative TGEV levels were measured by qPCR. Data present as mean ± SD from three independent experiments. **P < .01 by t test. C, Time‐lapse images of the internalization of three TGEVs via clathrin‐mediated endocytosis shown in Videos S1‐S3. Circles indicate the positions of the TGEVs in each panel. Scale bar, 2 μm. D, Fluorescence intensity curves of clathrin at the site of virus and velocity curves of viral diffusion corresponding to (C). E, Trajectories of viral diffusion corresponding to (C). F and G, MSD vs time plots of viral movement. The colors are in accordance with those in (E)
Figure 3
Figure 3
Live cell imaging of the TGEV internalization via caveolae‐mediated endocytosis. A, Representative immunofluorescence images of TGEVs in control and nystatin treated cells. The ST cells were treated or untreated with 10 μM nystatin for 30 min and subsequently inoculated with TGEVs for 2 h, and then the ST cells were fixed and the infected TGEVs were stained with the anti‐TGEV primary antibody and the fluorescent secondary antibody. Scale bar, 20 μm. B, Effects of nystatin with different concentrations on TGEV infection. The ST cells were treated or untreated with the indicated concentrations of nystatin for 30 min and inoculated with TGEVs for 2 h, subsequently, the relative TGEV levels were measured by qPCR. Data present as mean ± SD from three independent experiments. **P < .01 by t test. C, Time‐lapse images of the internalization of three TGEVs via caveolae‐mediated endocytosis shown in Video S4‐S6. Circles indicate the positions of the TGEVs in each panel. Scale bar, 2 μm. D, Fluorescence intensity curves of Cav1 at the site of virus and velocity curves of viral diffusion corresponding to (C). E, Trajectories of viral diffusion corresponding to (C). F and G, MSD vs time plots of viral movement. The colors are in accordance with those in (E)
Figure 4
Figure 4
The proportion of the TGEV internalization via clathrin‐ or caveolae‐mediated endocytosis. A, Time‐lapse images of TGEV internalized via clathrin‐mediated endocytosis in co‐transfected ST cells. Circles indicate the positions of the TGEVs in each panel. Scale bar, 2 μm. B, Time‐lapse images of TGEV internalized via caveolae‐mediated endocytosis in co‐transfected ST cells. Circles indicate the positions of the TGEVs in each panel. Scale bar, 2 μm. C, The pie chart of the proportion of TGEV internalized via clathrin‐ or caveolae‐mediated endocytosis
Figure 5
Figure 5
Actin promotes TGEV internalization. A, Representative immunofluorescence images of TGEVs in control and CytoD‐treated cells. The ST cells were treated or untreated with 1 μM CytoD for 30 min and subsequently inoculated with TGEVs for 2 h, and then the ST cells were fixed and the infected TGEVs were stained with the anti‐TGEV primary antibody and the fluorescent secondary antibody. Scale bar, 20 μm. B, Effects of CytoD with different concentrations on TGEV infection. The ST cells were treated or untreated with the indicated concentrations of CytoD for 30 min and inoculated with TGEVs for 2 h, subsequently, the relative TGEV levels were measured by qPCR. Data present as mean ± SD from three independent experiments. **P < .01 by t test. C, Time‐lapse images of the internalization of three TGEVs through actin‐dependent pathway shown in Videos S7‐S9. Circles indicate the positions of the TGEVs in each panel. Scale bar, 2 μm. D, Fluorescence intensity curves of actin at the site of virus and velocity curves of viral diffusion corresponding to (C). E, Trajectories of viral diffusion corresponding to (C). F and G, MSD vs time plots of viral movement. The colors are in accordance with those in (E)
Figure 6
Figure 6
Dynamin 2 promotes TGEV internalization. A, Representative immunofluorescence images of TGEVs in control and dynasore‐treated cells. The ST cells were treated or untreated with 100 μM dynasore for 30 min and subsequently inoculated with TGEVs for 2 h, and then the ST cells were fixed and the infected TGEVs were stained with the anti‐TGEV primary antibody and the fluorescent secondary antibody. Scale bar, 20 μm. B, Effects of dynasore with different concentrations on TGEV infection. The ST cells were treated or untreated with the indicated concentrations of dynasore for 30 min and inoculated with TGEVs for 2 h, subsequently, the relative TGEV levels were measured by qPCR. Data present as mean ± SD from three independent experiments. **P < .01 by t test. C, Analysis on the expression of Dyn2 in the ST cells transfected with shRNAs. The ST cells were transfected with shRNAs for 24 h and subsequently lysed and collected to measure the expression level of Dyn2 by western blot. D, Effects of Dyn2WT, Dyn2K44A, sh‐ctrl, and sh‐3 on TGEV infection. The ST cells were transfected with corresponding plasmids and shRNAs for 24 h and inoculated with TGEVs for 2 h, subsequently, the relative TGEV levels were measured by qPCR. Data present as mean ± SD from three independent experiments. **P < .01 by t test. E, Time‐lapse images of the internalization of three TGEVs through Dyn2‐dependent pathway shown in Videos S10‐S12. Circles indicate the positions of the TGEVs in each panel. Scale bar, 2 μm. F, Fluorescence intensity curves of Dyn2 at the site of virus and velocity curves of viral diffusion corresponding to (E). G, Trajectories of viral diffusion corresponding to (E). H and I, MSD vs time plots of viral movement. The colors are in accordance with those in (G)
Figure 7
Figure 7
Average time duration from the beginning of recruitment of endocytic related proteins to TGEV entry. A, Four events of the TGEV internalization through clathrin‐ and caveolae‐mediated endocytosis, actin‐ and Dyn2‐dependent pathway, respectively. The time of each frame in the four events is unified. B, Statistical analysis on the average duration from the beginning of recruitment of endocytic related proteins to TGEV entry. Only the internalized TGEVs were used in the analysis. Each dot represents an individual TGEV. The numbers of virus particles are 38, 17, 65, and 51 corresponding to clathrin‐ and caveolae‐mediated endocytosis, actin‐ and Dyn2‐dependent pathways, respectively. Data present as mean ± SD
Figure 8
Figure 8
Scheme of TGEV internalization in the ST cell. TGEV enters ST cells via clathrin‐ and caveolae‐mediated endocytosis. The vesicle containing the TGEV is first initiated at the binding site of virus and grows with the assistance of actin. Dyn2 is subsequently recruited in the late stage of TGEV internalization to pinch off the vesicle from the cell membrane. Finally, virus is successfully internalized, and the endocytic proteins rapidly disassemble

Similar articles

Cited by

References

    1. Laude H, Rasschaert D, Delmas B, Godet M, Gelfi J, Charley B. Molecular biology of transmissible gastroenteritis virus. Vet Microbiol. 1990;23:147‐154. - PMC - PubMed
    1. Salanueva IJ, Carrascosa JL, Risco C. Structural maturation of the transmissible gastroenteritis coronavirus. J Virol. 1999;73:7952‐7964. - PMC - PubMed
    1. Delmas B, Gelfi J, L'Haridon R, et al. Aminopeptidase N is a major receptor for the enteropathogenic coronavirus TGEV. Nature. 1992;357:417‐420. - PMC - PubMed
    1. Schwegmann‐Wessels C, Bauer S, Winter C, Enjuanes L, Laude H, Herrler G. The sialic acid binding activity of the S protein facilitates infection by porcine transmissible gastroenteritis coronavirus. Virol J. 2011;8:435. - PMC - PubMed
    1. Hansen GH, Delmas B, Besnardeau L, et al. The coronavirus transmissible gastroenteritis virus causes infection after receptor‐mediated endocytosis and acid‐dependent fusion with an intracellular compartment. J Virol. 1998;72:527‐534. - PMC - PubMed

Publication types

LinkOut - more resources