

Local- and landscape-scale variables shape insect diversity in an urban biodiversity hot spot
- PMID: 32017294
- PMCID: PMC7317463
- DOI: 10.1002/eap.2089
Local- and landscape-scale variables shape insect diversity in an urban biodiversity hot spot
Abstract
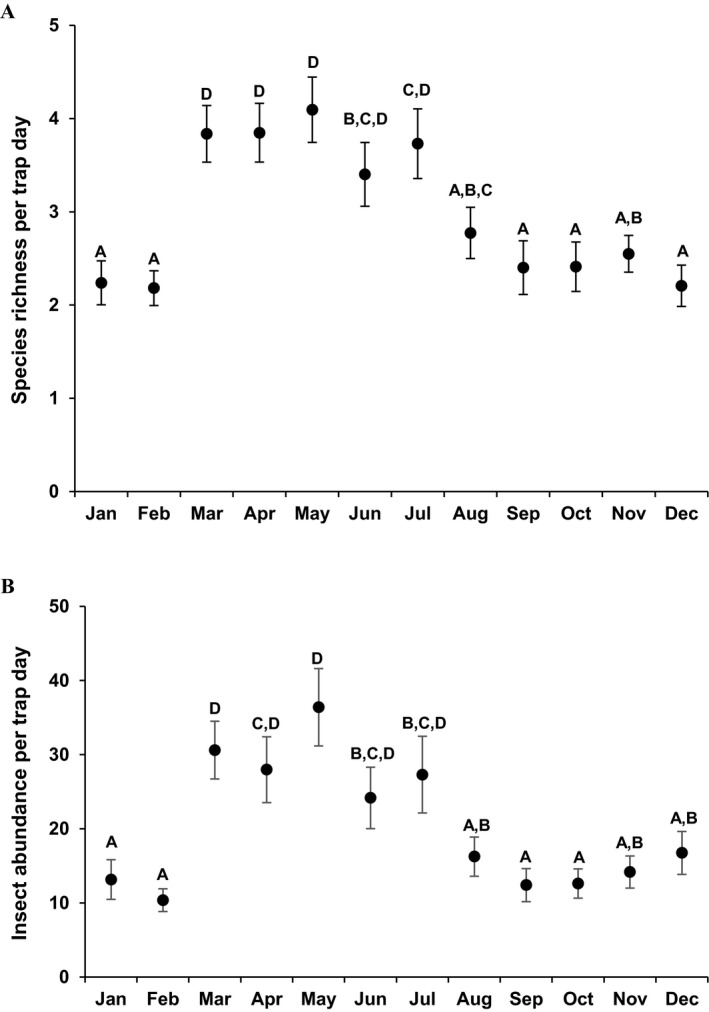
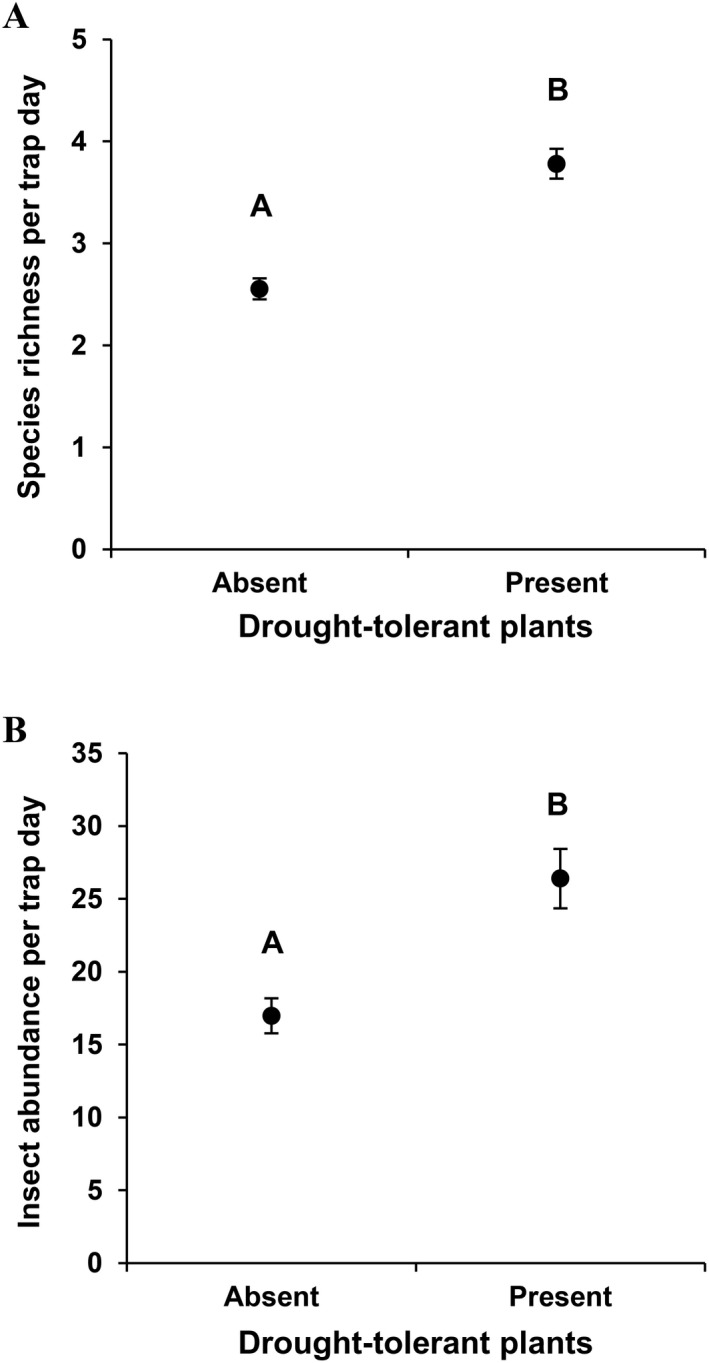
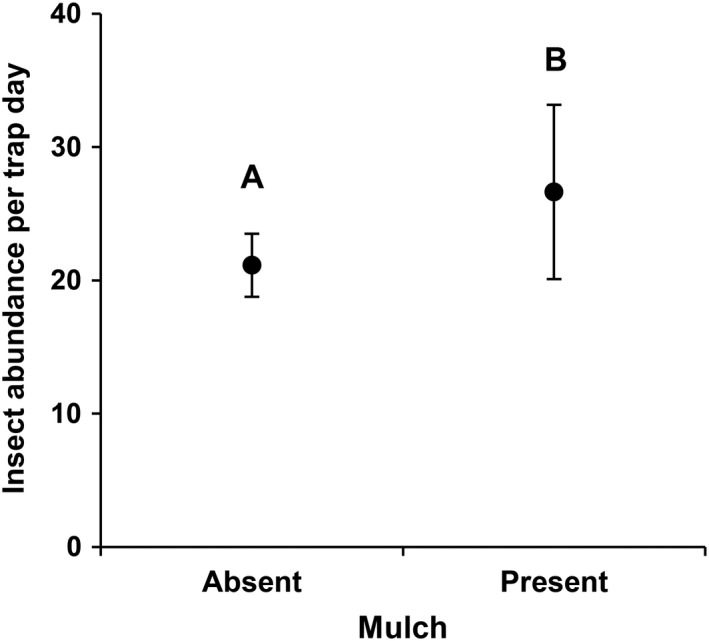
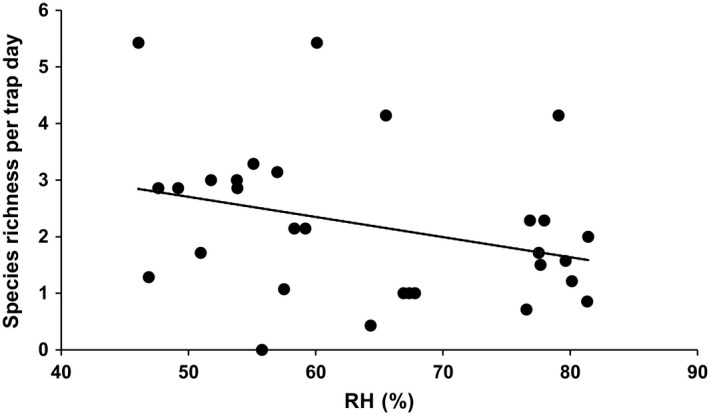
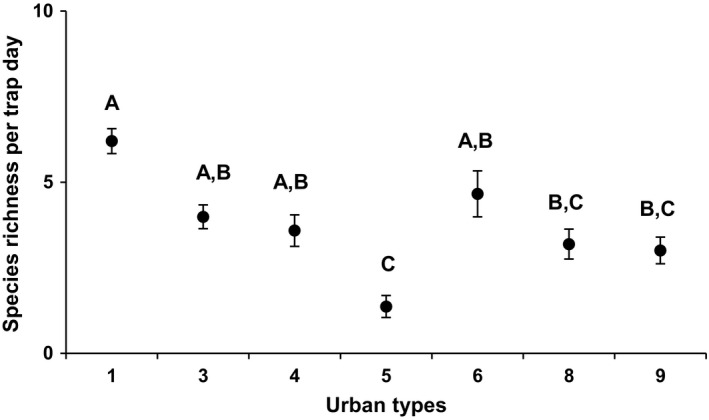
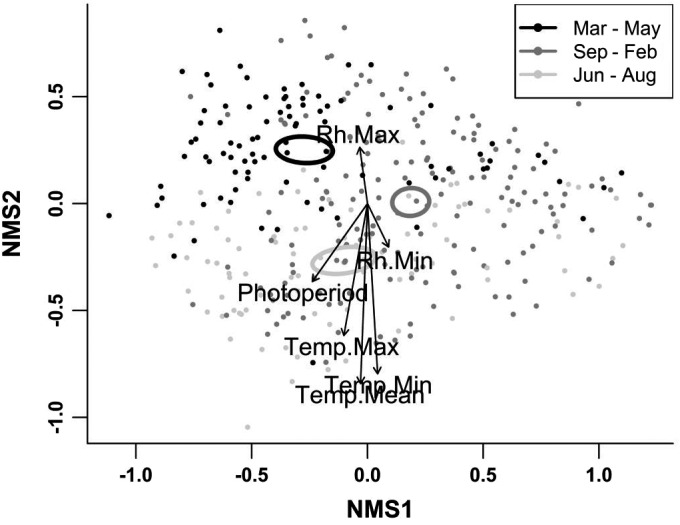
Local community structure is shaped by processes acting at local and landscape scales. The relative importance of drivers operating across different spatial scales is difficult to test without observations across regional or latitudinal gradients. Cities exhibit strong but predictable environmental gradients overlaying a mosaic of highly variable but repeated habitat types within a constrained area. Thus, cities present a unique opportunity to explore how both local and landscape factors influence local biotic communities. We used insect communities to examine the interactions among local environmental variables (such as temperature and relative humidity), local habitat characteristics (such as plant community composition), and broad-scale patterns of urbanization (including biophysical, human-built, and socioeconomic variables) on local insect abundance, species richness, and species composition in Los Angeles, a hot, dry, near-desert city. After accounting for seasonal trends, insect species richness and abundance were highest in drier and hotter sites, but the magnitude of local environmental effects varied with the degree of urbanization. In contrast, insect species composition was best predicted by broad-scale urbanization trends, with the more native communities occurring in less urbanized sites and more cosmopolitan insects occurring in highly urbanized sites. However, insect species richness and abundance were >30% higher and insect composition was similar across sites that hosted either native or drought-tolerant plants, regardless of the degree of urbanization. These results demonstrate that urban insect biodiversity is a product of interacting mechanisms working at both local and landscape scales. However, local-scale changes to urban habitats, such as cultivating plants that are adapted to the natural environment nearest the city, can positively impact urban biodiversity regardless of location.
Keywords: Diptera; Hymenoptera; Lepidoptera; Los Angeles; citizen science; community ecology.
© 2020 The Authors. Ecological Applications published by Wiley Periodicals, Inc. on behalf of Ecological Society of America.
Figures
References
-
- Anderson, M. J. , Ellingsen K. E., and McArdle B. H.. 2006. Multivariate dispersion as a measure of beta diversity. Ecology Letters 9:683–693. - PubMed
-
- Anderson, M. , Gorley R., and Clarke K.. 2008. PERMANOVA+ for Primer. Primer‐E, Plymouth, UK.
-
- Anderson, M. J. , Crist T. O., Chase J. M., Vellend M., Inouye B. D., Freestone A. L., Sanders N. J., Cornell H. V., Comita L. S., and Davies K. F.. 2011. Navigating the multiple meanings of β diversity: a roadmap for the practicing ecologist. Ecology Letters 14:19–28. - PubMed
-
- Anderson, E. C. , Egerer M. H., Fouch N., Clarke M., and Davidson M. J.. 2019. Comparing community garden typologies of Baltimore, Chicago, and New York City (USA) to understand potential implications for socio‐ecological services. Urban Ecosystems 22:671–681.
-
- Anderson‐Teixeira, K. J. , Davies S. J., Bennett A. C., Gonzalez‐Akre E. B., Muller‐Landau H. C., Joseph Wright S., Abu Salim K., Almeyda Zambrano A. M., Alonso A., and Baltzer J. L.. 2015. CTFS‐Forest GEO: a worldwide network monitoring forests in an era of global change. Global Change Biology 21:528–549. - PubMed
