Review
. 2020 Jul 2;16(7):1659-1667.
doi: 10.1080/21645515.2019.1703455. Epub 2020 Feb 4.

Influenza in temperate and tropical Asia: a review of epidemiology and vaccinology

Affiliations
Review

Influenza in temperate and tropical Asia: a review of epidemiology and vaccinology

Barnaby Edward Young et al. Hum Vaccin Immunother. .

Abstract

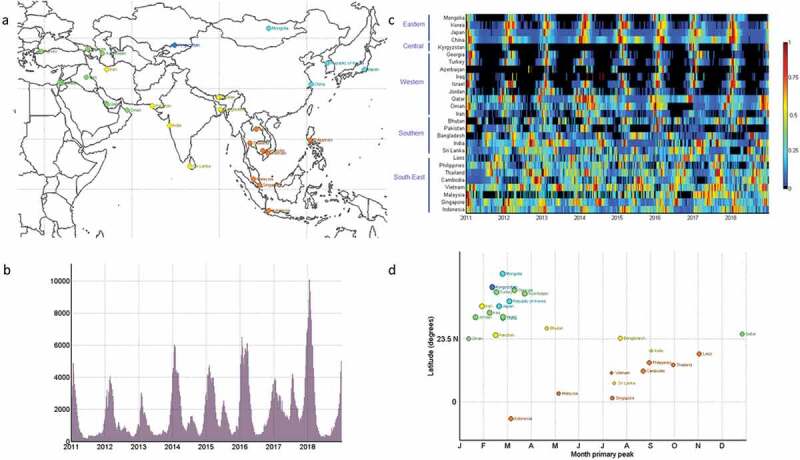
The impact of seasonal influenza has been under-appreciated in Asia and surveillance data lags in most other regions. The variety of influenza circulation patterns in Asia - largely due to the range of climates - has also only recently been recognized and its effect on the burden of disease is not fully understood. Recent reports that clinical protection wanes in the weeks after influenza vaccination emphasize the importance of optimally timing vaccination to local epidemiology. It also raises questions as to whether influenza vaccines should be administered more frequently than annually and what may be the benefits in Asia of access to new vaccines with enhanced immunogenicity and effectiveness. This review will summarize influenza surveillance data from Asian countries over 2011-2018, and consider the implications for vaccination strategies in different parts of Asia.

Keywords: Adjuvant; Asia; high dose; influenza; older adults; recombinant; standard dose; vaccine; waning.


Figures

Figure 1.
Figure 1.
(a) Map of the 27 countries with weekly influenza data available from 2011 to 2018 on FluNet. Color groupings by WHO transmission zone [South-East (orange), Southern (yellow), Eastern (light blue), Central (dark blue), Western (green)]. (b) Number of influenza cases reported per week from 2011 to 2018 [Note for 1B and 1C labels indicate the beginning of the respective year]. (c) Heat map of weekly influenza cases (A/H1, A/H3 and B combined) reported to FluNet from 2011 to 2018 normalized to proportion per year (where 1 = week with highest proportion). Countries organized by WHO transmission zone and by the latitude of most populous city in that country from North to South. (d) Time-series analysis to infer the month of primary seasonal influenza peak from FluNet surveillance data, stratified by the latitude of countries most populous city and grouped by WHO influenza transmission zone [4-weekly smoothed and detrended by proportion of cases per year].

References

    1. Cunha BA. Influenza: historical aspects of epidemics and pandemics. Infect Dis Clin North Am. 2004;18:141–55. doi:10.1016/S0891-5520(03)00095-3. - DOI - PubMed
    1. Potter CW. A history of influenza. J Appl Microbiol. 2001;91:572–79. doi:10.1046/j.1365-2672.2001.01492.x. - DOI - PubMed
    1. Nickol ME, Kindrachuk J. A year of terror and a century of reflection: perspectives on the great influenza pandemic of 1918–1919. BMC Infect Dis. 2019;19. doi:10.1186/s12879-019-3750-8. - DOI - PMC - PubMed
    1. Lycett SJ, Duchatel F, Digard P. A brief history of bird flu. Philos Trans R Soc Lond B Biol Sci. 2019;374:20180257. doi:10.1098/rstb.2018.0257. - DOI - PMC - PubMed
    1. United Nations Population Division | Department of Economic and Social Affairs . [accessed 2019 November 20]. https://www.un.org/en/development/desa/population/index.asp.

Publication types

Substances