. 2020 May 1;130(5):2570-2586.
doi: 10.1172/JCI133055.

A tumor-intrinsic PD-L1/NLRP3 inflammasome signaling pathway drives resistance to anti-PD-1 immunotherapy

Affiliations

A tumor-intrinsic PD-L1/NLRP3 inflammasome signaling pathway drives resistance to anti-PD-1 immunotherapy

Balamayoora Theivanthiran et al. J Clin Invest. .

Abstract

An in-depth understanding of immune escape mechanisms in cancer is likely to lead to innovative advances in immunotherapeutic strategies. However, much remains unknown regarding these mechanisms and how they impact immunotherapy resistance. Using several preclinical tumor models as well as clinical specimens, we identified a mechanism whereby CD8+ T cell activation in response to programmed cell death 1 (PD-1) blockade induced a programmed death ligand 1/NOD-, LRR-, and pyrin domain-containing protein 3 (PD-L1/NLRP3) inflammasome signaling cascade that ultimately led to the recruitment of granulocytic myeloid-derived suppressor cells (PMN-MDSCs) into tumor tissues, thereby dampening the resulting antitumor immune response. The genetic and pharmacologic inhibition of NLRP3 suppressed PMN-MDSC tumor infiltration and significantly augmented the efficacy of anti-PD-1 antibody immunotherapy. This pathway therefore represents a tumor-intrinsic mechanism of adaptive resistance to anti-PD-1 checkpoint inhibitor immunotherapy and is a promising target for future translational research.

Keywords: Cancer immunotherapy; Chemokines; Immunology; Innate immunity; Oncology.


Conflict of interest statement

Conflict of interest: BAH receives research funding from Merck & Co., Tempest Therapeutics, Leap Therapeutics, the Agency for Science, Technology, and Research Singapore, and AstraZeneca. AKSS receives research funding from Bristol-Myers Squibb, Celldex Therapeutics, Dynavax Technologies, Genentech, ImmunoCore, and Merck & Co. JMB receives research support from Genentech, Bristol-Myers Squibb, and Incyte. DBJ receives research funding from Bristol-Myers Squibb and Incyte and serves on the scientific advisory boards for Array BioPharma, Bristol-Myers Squibb, Incyte, Merck & Co., and Novartis.

Figures

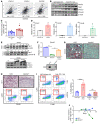
Figure 1
Figure 1. PMN-MDSC accumulation contributes to tumor progression following anti–PD-1 Ab immunotherapy.
(A) Schematic overview of the adaptive resistance pathway. (B) RNA-Seq differential gene expression analysis of tumor tissues following treatment of the autochthonous BRAFV600E PTEN–/– melanoma model with anti–PD-1 Ab therapy versus IgG isotype control (Ctrl) (n = 3). (C) qRT-PCR analysis of target genes of interest in serial tumor fine-needle aspiration (FNA) biopsy specimens harvested from the transgenic BRAFV600E PTEN–/– melanoma model treated with anti–PD-1 Ab versus IgG isotype control (n = 5). (D) Gr-1 immunohistochemical analysis of transgenic BRAFV600E PTEN–/– melanoma tissues following treatment with anti–PD-1 Ab versus IgG isotype control. Original magnification, ×40. Gr-1 staining is shown in red. Images are representative of 3 tumors per group. (E) PMN-MDSC flow cytometric analysis of transgenic BRAFV600E PTEN–/– melanoma tissues following treatment with anti–PD-1 Ab versus IgG isotype control. PMN-MDSCs were defined as live+CD45+CD11b+Ly6G+Ly6CintF4/80 cells. Shown are a representative flow dot plot and quantification graph of PMN-MDSC flow cytometric data (n = 5). (F) qRT-PCR analysis of CXCR2 ligands in BRAFV600E PTEN–/– melanoma tissues treated with anti–PD-1 Ab following CD8+ T cell ablation in vivo (n = 3). (G) In vivo tumor study of BRAFV600E PTEN–/– melanoma genetically silenced for CXCL5. Quantitation of tumor-infiltrating PMN-MDSCs by flow cytometry is shown along with an in vivo tumor growth curve of CXCL5-silenced BRAFV600E PTEN–/– melanoma versus BRAFV600E PTEN–/– NTC melanoma control tumors treated with anti–PD-1 Ab. Data were normalized to tumors treated with IgG isotype control (n = 5). (H) Combination treatment with anti–PD-1 Ab and CXCR2 inhibitor (CXCR2i) in an in vivo BRAFV600E PTEN–/– melanoma study (n = 5). Graphs show flow cytometric analysis of tumor-infiltrating PMN-MDSCs and live+CD45+CD3+CD8+ T cells. *P < 0.05, **P < 0.005, and ***P < 0.0005, by Student’s t test with Holm-Sidak post hoc correction for multiple comparisons (B, C, and F), Student’s t test (E and G), or 1-way ANOVA with Sidak’s post hoc multiple comparisons test (H). See also Supplemental Figures 1, 2, and 5C.
Figure 2
Figure 2. Wnt5a induces CXCR2-dependent chemokine expression in response to anti–PD-1 Ab immunotherapy.
(A) TCGA human melanoma database gene expression analysis of CXCL5, CXCL2, and CXCR2 association with WNT5A. (B) Whole tumor tissue Western blot analysis of Wnt5a, YAP1, CXCL5, and vinculin and β-actin (used as loading controls). Blot is representative of 3 independent experiments. (C) Plasma CXCL5 ELISA following anti–PD-1 Ab therapy versus IgG isotype control therapy in the transgenic BRAFV600E PTEN–/– melanoma model (n = 6). Data are representative of 3 independent experiments. (D) qRT-PCR analysis of Cxcl1, Cxcl2, and Cxcl5 in the BRAFV600E PTEN–/– melanoma cell line following treatment with rWnt5a versus vehicle control (n = 3). (E) Western blot analysis of YAP1 expression in total cellular lysates (top) and nuclear lysates (middle) following treatment of BRAFV600E PTEN–/– melanoma cells with rWnt5a at various time points. Bottom blot shows Wnt5a induction of CXCL5 with or without verteporfin (YAP inhibitor) or XAV939 (β-catenin inhibitor). Blots shown are representative of 3 independent experiments. UT, untreated or vehicle control. (F) qRT-PCR analysis of Cxcl5 in BRAFV600E PTEN–/– NTC and Wnt5a-silenced BRAFV600E PTEN–/– melanoma cells (BRAFV600E PTEN–/– Wnt5aKD). Blot shows secreted CXCL5 in BRAFV600E PTEN–/– NTC and BRAFV600E PTEN–/– Wnt5aKD cells (n = 3). (G) IHC for CXCL5 (red) in BRAFV600E PTEN–/– NTC and BRAFV600E PTEN–/– Wnt5aKD tumor cells. Images are representative of 3 tumors. White arrows indicate CXCL5+ tumor cells. Original magnification, ×20. (H) IHC for Gr-1 in BRAFV600E PTEN–/– NTC and BRAFV600E PTEN–/– Wnt5aKD tumor cells. Original magnification, ×20. Plots show PMN-MDSC flow cytometric analysis of BRAFV600E PTEN–/– NTC and BRAFV600E PTEN–/– Wnt5aKD tumors (n = 3). (I) PMN-MDSC flow cytometric analysis of BRAFV600E PTEN–/– NTC and BRAFV600E PTEN–/– Wnt5aKD tumors following treatment with anti–PD-1 Ab versus IgG isotype control (n = 5). (J) Tumor volume change based on anti–PD-1 Ab/IgG control ratios for BRAFV600E PTEN–/– NTC and BRAFV600E PTEN–/– Wnt5aKD tumors (n = 5). α, anti. UT, untreated control. Kendall’s tau correlation coefficient was calculated for A. *P < 0.05 and ***P < 0.0005, by Student’s t test (C, D, and I) and 1-way ANOVA with Sidak’s post hoc multiple comparisons test (F). See also Supplemental Figure 3.
Figure 3
Figure 3. HSP70-TLR4 induces Wnt5a expression in response to anti–PD-1 Ab immunotherapy.
(A) RNA-Seq GSEA showing top 12 pathways enriched in autochthonous BRAFV600E PTEN–/– melanomas following escape from anti–PD-1 Ab therapy. Arrows indicate pathways associated with cellular stress (n = 3/group). (B) SILAC-AHA LC-MS/MS secretome analysis of resected autochthonous BRAFV600E PTEN–/– melanoma tissues following anti–PD-1 Ab therapy versus IgG isotype control. Secreted protein levels were normalized to the number of cells (n = 3/group). (C) Plasma HSP70 ELISA analysis following anti–PD-1 versus IgG isotype control treatment of autochthonous BRAFV600E PTEN–/– melanoma-bearing mice (n = 6). (D) qRT-PCR analysis of TLR expression in BRAFV600E PTEN–/– melanoma cells. Data were normalized to Tlr9 expression levels (n = 3). (E) Treatment of BRAFV600E PTEN–/– melanoma cells with titrated concentrations of recombinant HSP70 (rHSP70) followed by Wnt5a Western blot analysis of total cell lysates and supernatant (SNT). Blots are representative of 2 independent experiments. (F) Treatment of BRAFV600E PTEN–/– melanoma cells with titrated concentrations of the HSP70 inhibitor VER155008 (HSP70i). Blots are representative of 2 independent experiments. (G) Treatment of BRAFV600E PTEN–/– NTC cells with rHSP70 with or without the TLR4 inhibitor CLI-095 (TLR4i) and treatment of Tlr4-silenced BRAFV600E PTEN–/– melanoma cells (TLR4KD) with HSP70 followed by Western blotting for Wnt5a. Blots are representative of 3 independent experiments. (H) BRAFV600E PTEN–/– melanoma growth curve following treatment with TLR4 siRNA versus control siRNA (n = 5). (I) Whole-tissue Western blot analysis of Wnt5a, CXCL5, and β-actin in TLR4 siRNA–treated and control siRNA–treated BRAFV600E PTEN–/– melanomas. Data are representative of 2 independent experiments. (J) Top: PMN-MDSC flow cytometric analysis of TLR4 siRNA– and control siRNA–treated BRAFV600E PTEN–/– melanomas (n = 4). Bottom: CD8+ T cell flow cytometric analysis of TLR4 siRNA– and control siRNA–treated BRAFV600E PTEN–/– melanomas (n = 4). *P < 0.05, by Student’s t test for comparison of treatment groups. See also Supplemental Figure 4.
Figure 4
Figure 4. CD8+ T cells induce tumor HSP70 release in a NLRP3-dependent manner in response to anti–PD-1 Ab immunotherapy.
(A) Schema illustrating coculture of OT-I CD8+ T cells with OVA-expressing BRAFV600E PTEN–/– melanoma cells followed by HSP70 Western blot analysis of isolated supernatant. Harvested supernatant was coincubated at increasing concentrations with WT BRAFV600E PTEN–/– melanoma cells followed by Wnt5a Western blot analysis. Blots are representative of 2 independent experiments. (B) Flow cytometric analysis of PMN-MDSCs and CD8+ T cells from resected autochthonous BRAFV600E PTEN–/– melanoma tissues following anti–PD-1 Ab or IgG isotype control therapy. Results are expressed per gram of tumor tissue (n = 6). (C) Flow cytometric analysis of tumor-infiltrating PMN-MDSCs from autochthonous BRAFV600E PTEN–/– melanomas following anti–PD-1 Ab versus IgG isotype control therapy with or without anti-CD8 Ab. Data were normalized to IgG control–treated tumors (n = 3). (D) HSP70 and β-actin Western blot analysis following treatment of BRAFV600E PTEN–/– melanoma cells with increasing concentrations of dacarbazine. Blots are representative of 3 independent experiments. (E) Tumor growth curve of syngeneic BRAFV600E PTEN–/– melanomas following vehicle control or low-dose (lo) (50 mg/kg i.p. q.o.d.) or high-dose (hi) (75 mg/kg i.p. q.o.d.) dacarbazine therapy (n = 5). (F) Flow cytometric analysis of PMN-MDSCs from BRAFV600E PTEN–/– melanomas following vehicle control or dacarbazine therapy (n = 5). Flow cytometric analysis of CD8+ T cells from BRAFV600E PTEN–/– melanomas following vehicle control or dacarbazine therapy (n = 5). (G) HSP70 Western blot analysis of supernatant and tumor cell lysates following ATP stimulation of BRAFV600E PTEN–/– melanoma cells at different time points, with or without treatment with the NLRP3 inhibitor (NLRP3i) MCC950. Blots are representative of 3 independent experiments. (H) HSP70 Western blot following coincubation of OT-1 CD8+ T cells and OVA-expressing BRAFV600E PTEN–/– melanoma cells with or without increasing concentrations of NLRP3 inhibitor. Blots are representative of 3 independent experiments. Spearman’s correlation calculation was performed in B. *P < 0.05 and ***P < 0.0005, by Student’s t test ( C), 1-way ANOVA with Sidak’s post hoc multiple comparisons test (E and F). See also Supplemental Figure 5.
Figure 5
Figure 5. CD8+ T cells trigger a PD-L1/NLRP3 signaling pathway to drive PMN-MDSC recruitment to the tumor.
(A) Western blots for HSP70 supernatant, caspase-1 p20, and Wnt5a in BRAFV600E PTEN–/– melanoma cells treated with anti–PD-L1 Ab with or without IFN-γ. (B) Immunoprecipitation (IP) of NLRP3 after treatment of BRAFV600E PTEN–/– melanoma cells with IFN-γ, anti–PD-L1, or both followed by Western blotting for ASC and NLRP3. IgG-IP, IP control; ATP, positive control. (C) Left: ASC polymerization assay following treatment of BRAFV600E PTEN–/– melanoma cells with IFN-γ, anti–PD-L1, or both. Right: ASC polymerization assay following treatment of Pdl1-silenced and NTC BRAFV600E PTEN–/– melanoma cells with IFN-γ. (D) Coculture of OT-I CD8+ T cells with OVA-expressing BRAFV600E PTEN–/– melanoma cells, with or without anti–PD-1 Ab alone or anti–PD-1 Ab plus anti–IFN-γ–blocking Ab, was followed by Western blotting for HSP70 and caspase-1 p20. (E) Coculture of OT-I CD8+ T cells with BRAFV600E PTEN–/– OVA melanoma cells, with or without anti–PD-1 Ab alone or anti–PD-1 Ab plus NLRP3 inhibitor, was followed by Western blots for caspase-1 p20, HSP70, and Wnt5a. (F) Western blots for caspase-1 p20, HSP70, and Wnt5a Western blots in BRAFV600E PTEN–/– OVA melanoma cells following coculture with OT-I CD8+ T cells after genetic silencing of either Nlrp3 (NRLP3KD) or Pdl1 (PD-L1KD). (G) IP of NLRP3 after treatment of BRAFV600E PTEN–/– melanoma cells with IFN-γ, anti–PD-L1, or both, followed by Western blotting for PKR and NLRP3. (H) Western blots for p-PKR and total PKR in control and Pdl1-silenced BRAFV600E PTEN–/– melanoma cells. GAPDH was used as a cytoplasmic loading control and laminin B as a nuclear loading control. (I) Western blotting for STAT3, p-PKR, and total PKR in control and Pdl1-silenced BRAFV600E PTEN–/– melanoma cells. (J) Western blots for caspase-1 p20 and Wnt5a in WT and STAT3CA-expressing BRAFV600E PTEN–/– melanoma cells following treatment with IFN-γ, anti–PD-L1, or both. (K) Schematic diagram depicting the PD-L1/STAT3/PKR/NLRP3 signaling axis in tumor cells. cyt, cytoplasm. All Western blots are representative of 2–3 independent experiments. See also Supplemental Figure 6.
Figure 6
Figure 6. Genetic and pharmacologic inhibition of NLRP3 suppresses PMN-MDSC recruitment and enhances the efficacy of anti–PD-1 Ab immunotherapy.
(A) Plasma HSP70 ELISA analysis following the growth of BRAFV600E PTEN–/– NTC or Nlrp3-silenced BRAFV600E PTEN–/– melanomas (n = 5). (B) qRT-PCR analysis of CXCR2-dependent chemokine expression in BRAFV600E PTEN–/– NTC and BRAFV600E PTEN–/– NLRP3KD melanomas (n = 3). (C) Flow cytometric analysis of CD8+ T cells in resected BRAFV600E PTEN–/– NTC and BRAFV600E PTEN–/– NLRP3KD melanomas (n = 5). Flow cytometric analysis of PMN-MDSCs in resected BRAFV600E PTEN–/– NTC and BRAFV600E PTEN–/– NLRP3KD melanomas (n = 5). (D) Tumor growth curve of BRAFV600E PTEN–/– NTC and BRAFV600E PTEN–/– NLRP3KD melanomas (n = 5). (E) Treatment of syngeneic BRAFV600E PTEN–/– melanomas with IgG isotype control Ab (200 μg i.p. every 3 days), NLRP3 inhibitor (10 μg MCC950 i.p. every 3 days), anti–PD-1 Ab (200 μg i.p. every 3 days), or NLRP3 inhibitor and anti–PD-1 Ab combination therapy (n = 8). (F) Representative flow cytometric dot plots of PMN-MDSCs and CD8+ T cells in resected BRAFV600E PTEN–/– melanomas following treatment with IgG isotype control Ab, NLRP3 inhibitor, anti–PD-1 Ab, or NLRP3 inhibitor and anti–PD-1 Ab combination therapy. Graphs show flow cytometric analysis of tumor-infiltrating PMN-MDSCs and CD44+CD8+ T cells. (G) Whole tumor tissue Western blot analysis for pro–caspase-1, caspase-1 p20, and Wnt5a following in vivo treatment with IgG isotype control, anti–PD-1 Ab, or combined anti–PD-1 Ab and NLRP3 inhibitor. Blots are representative of 2 independent experiments. (H) qRT-PCR analysis of Cxcl5 and granzyme B (Gzmb) expression in resected BRAFV600E PTEN–/– melanoma tissues (n = 5). *P < 0.05, **P < 0.005, and ***P < 0.0005, by Student’s t test (AD) and 1-way ANOVA with Sidak’s post hoc multiple comparisons test (E, F, and H). See also Supplemental Figure 7.
Figure 7
Figure 7. The PD-L1/NLRP3/HSP70 PMN-MDSC adaptive recruitment pathway in human melanoma.
(A) Supernatant HSP70 and caspase-1 p20 Western blot analysis following treatment of human WM266 melanoma cells with IFN-γ with or without anti–PD-L1 Ab. Blots are representative of 3 independent experiments. (B) Wnt5A Western blot analysis of HSP70-treated human WM266 melanoma cells with or without TLR4 inhibitor. Blots are representative of 3 independent experiments. (C) HSP70 and caspase-1 p20 Western blot analysis following treatment of human WM266 melanoma cells with ATP in the absence and presence of MCC950. Blots are representative of 2 independent experiments. (D) Cytolytic T cell markers correlated with ITGAM (CD11B), CD33, and NLRP3 gene expression in the melanoma TCGA-SKCM database. (E) RNA-Seq analysis of human melanoma tissue specimens collected before anti–PD-1 Ab therapy and at the time of disease progression on anti–PD-1 Ab therapy. TPM, transcripts per million. (F) Plasma HSP70 ELISA at week 0 and week 12 in patients with advanced melanoma undergoing anti–PD-1 Ab immunotherapy. (G) Change in HSP70 plasma levels following anti–PD-1 Ab immunotherapy in patients with advanced melanoma who were responders (R) or nonresponders (NR). The response was based on week-12 CT imaging. HSP70 changes were normalized to target tumor burden based on week-12 CT imaging. In the box-and-whisker plots, the central line represents the median, the box represents the first and third quartiles, and the error bars represent the data range. *P < 0.05 and **P < 0.005, by Student’s t test (E and G).

Similar articles

Cited by

References

    1. Zhao X, Subramanian S. Intrinsic resistance of solid tumors to immune checkpoint blockade therapy. Cancer Res. 2017;77(4):817–822. doi: 10.1158/0008-5472.CAN-16-2379. - DOI - PubMed
    1. Pitt JM, et al. Resistance mechanisms to immune-checkpoint blockade in cancer: tumor-intrinsic and -extrinsic factors. Immunity. 2016;44(6):1255–1269. doi: 10.1016/j.immuni.2016.06.001. - DOI - PubMed
    1. O’Donnell JS, Long GV, Scolyer RA, Teng MW, Smyth MJ. Resistance to PD1/PDL1 checkpoint inhibition. Cancer Treat Rev. 2017;52:71–81. doi: 10.1016/j.ctrv.2016.11.007. - DOI - PubMed
    1. Marigo I, Dolcetti L, Serafini P, Zanovello P, Bronte V. Tumor-induced tolerance and immune suppression by myeloid derived suppressor cells. Immunol Rev. 2008;222:162–179. doi: 10.1111/j.1600-065X.2008.00602.x. - DOI - PubMed
    1. Marvel D, Gabrilovich DI. Myeloid-derived suppressor cells in the tumor microenvironment: expect the unexpected. J Clin Invest. 2015;125(9):3356–3364. doi: 10.1172/JCI80005. - DOI - PMC - PubMed

Publication types

MeSH terms

Substances