Clinical Trial
. 2020 Jun 1;130(6):2845-2858.
doi: 10.1172/JCI130597.

Plasmacytoid dendritic cells sense HIV replication before detectable viremia following treatment interruption

Affiliations
Clinical Trial

Plasmacytoid dendritic cells sense HIV replication before detectable viremia following treatment interruption

Julie L Mitchell et al. J Clin Invest. .

Abstract

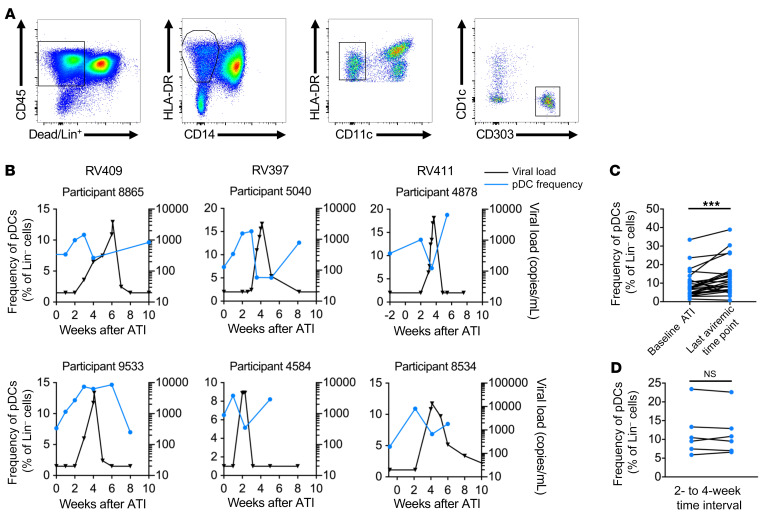
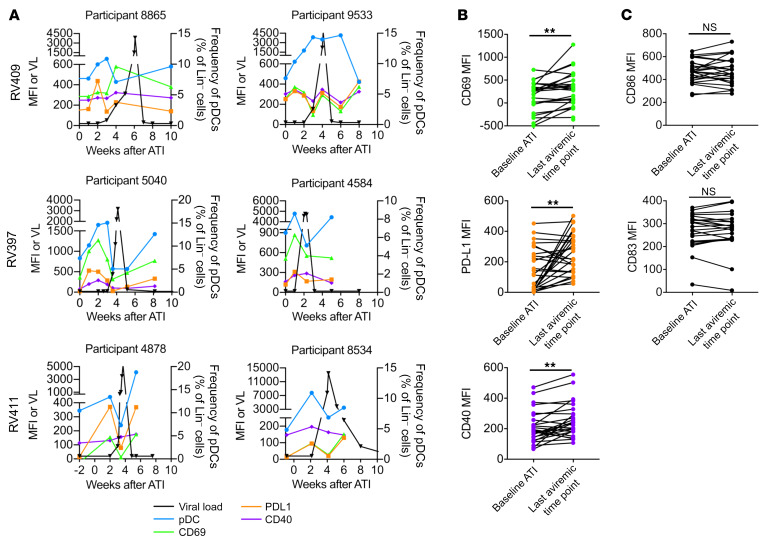
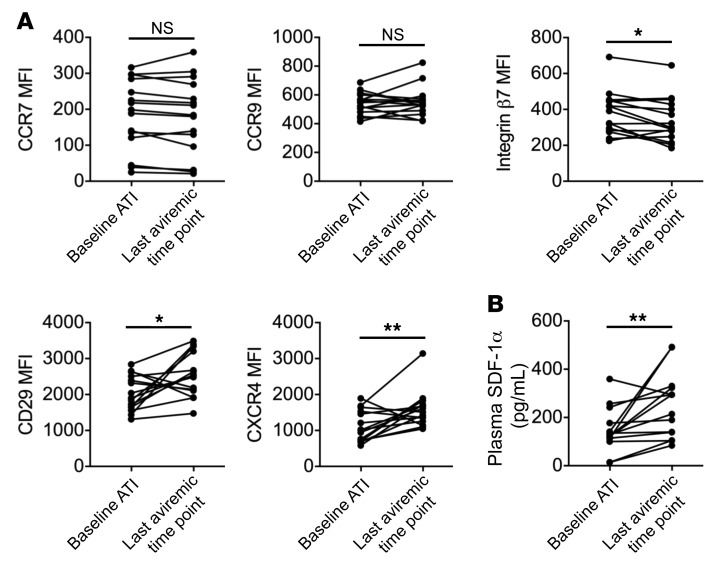
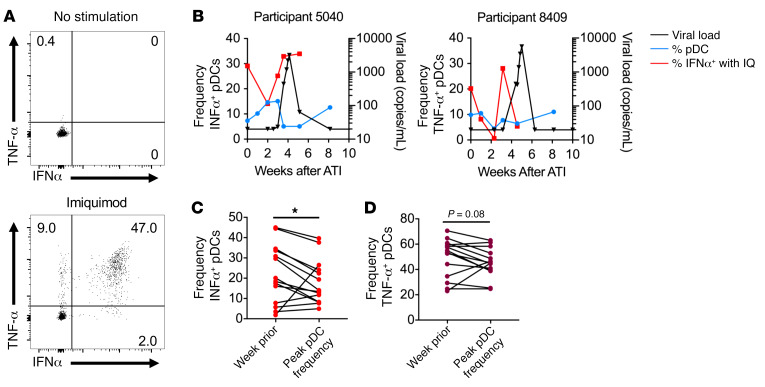
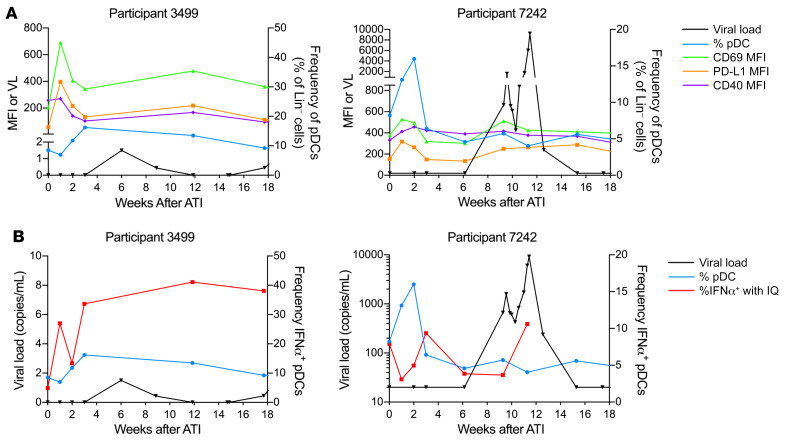
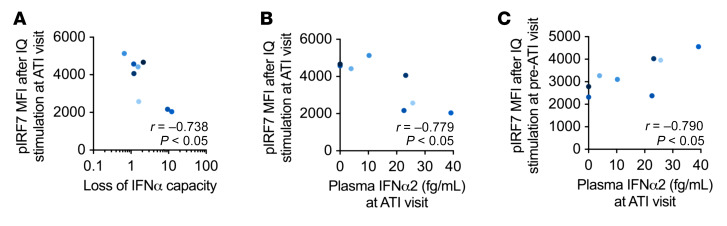
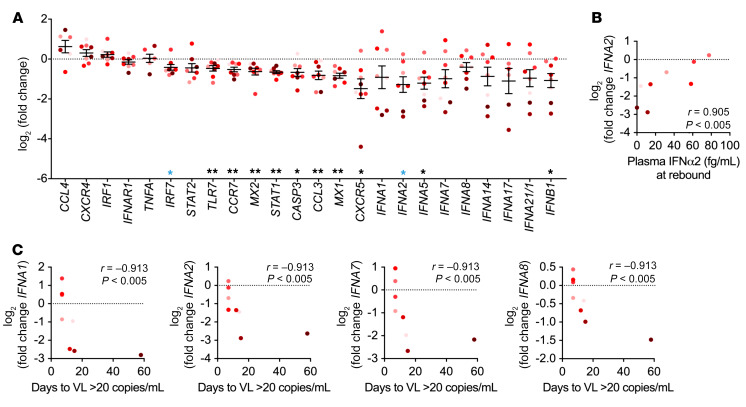
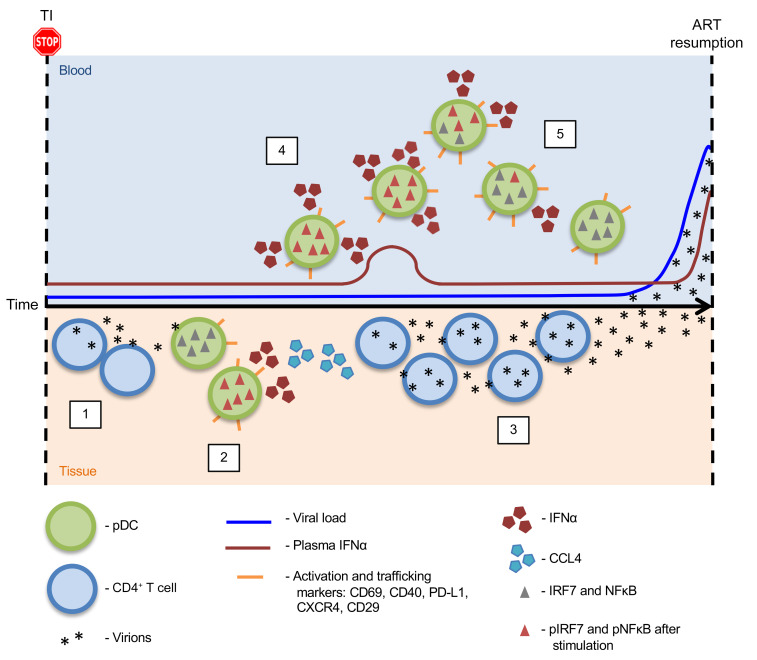
Plasmacytoid dendritic cells (pDCs) are robust producers of IFNα and one of the first immune cells to respond to SIV infection. To elucidate responses to early HIV-1 replication, we studied blood pDCs in 29 HIV-infected participants who initiated antiretroviral therapy during acute infection and underwent analytic treatment interruption (ATI). We observed an increased frequency of partially activated pDCs in the blood before detection of HIV RNA. Concurrent with peak pDC frequency, we detected a transient decline in the ability of pDCs to produce IFNα in vitro, which correlated with decreased phosphorylation of IFN regulatory factory 7 (IRF7) and NF-κB. The levels of phosphorylated IRF7 and NF-κB inversely correlated with plasma IFNα2 levels, implying that pDCs were refractory to in vitro stimulation after IFNα production in vivo. After ATI, decreased expression of IFN genes in pDCs inversely correlated with the time to viral detection, suggesting that pDC IFN loss is part of an effective early immune response. These data from a limited cohort provide a critical first step in understanding the earliest immune response to HIV-1 and suggest that changes in blood pDC frequency and function can be used as an indicator of viral replication before detectable plasma viremia.

Keywords: AIDS/HIV; Dendritic cells; Immunology; Innate immunity.


Conflict of interest statement

Conflict of interest: JA has received honoraria from Merck, ViiV Healthcare, Roche, AbbVie, and Gilead for her participation in advisory meetings.

Figures

Figure 1
Figure 1. Frequency of pDCs in the blood increases before detectable viremia.
(A) pDCs were identified as CD45+HLA-DR+CD303+ cells that were negative for CD14, CD11c, and CD1c and the lineage markers CD3, CD14, CD19, and CD56 (Lin). (B) The frequency of pDCs in the blood was measured by flow cytometry as a percentage of lineage-negative cells. Representative graphs show the pDC frequency (blue) relative to the VL after ATI (black). (C) The pDC frequency at the time of ATI was compared with the frequency at the last aviremic time point to show increased pDC frequency before viral RNA was detected in the blood. ***P < 0.001, by Wilcoxon test. n = 25 (10 of whom received VRC01). (D) The frequency of pDCs in the blood before ATI is shown for the 5 participants in the placebo arm of RV409. Changes in pDC frequency were compared when measurements were taken at a 2- or 4-week time interval.
Figure 2
Figure 2. Expression of activation markers increases on pDCs before detectable viremia.
(A) The MFI of CD69, PD-L1, and CD40 on pDCs was measured by flow cytometry. Representative graphs show CD69 (green), PD-L1 (orange), and CD40 (purple) MFI relative to the changes in pDC frequency (blue) and VL (black). (B) The MFI of CD69, PD-L1, and CD40 at ATI was compared with the MFI at the last time point at which viral RNA was undetectable in the plasma. **P < 0.01, by Wilcoxon test. (C) Changes in CD86 and CD83 MFI between baseline ATI and the last aviremic time point. n = 25 (10 of whom received VRC01).
Figure 3
Figure 3. Expression of migration markers increases on pDCs before detectable viremia.
(A) Changes in CCR7, CCR9, integrin β7, CXCR4, and CD29 MFI between baseline ATI and the last aviremic time point are shown. (B) SDF-1α levels were measured in the plasma of RV397 participants, and changes between baseline ATI and the last aviremic time point are shown. *P < 0.05 and **P < 0.01, by Wilcoxon test. n = 15 participants from RV397 (10 of whom received VRC01).
Figure 4
Figure 4. pDCs have a transient decrease in the capacity to produce IFNα in vitro.
(A) Total PBMCs were stimulated with imiquimod for 6 hours, and IFNα production by pDCs was measured by flow cytometry. (B) The percentage of pDCs that produced IFNα in response to imiquimod (IQ) stimulation is shown (red). pDC frequency (blue) and HIV-1 VL (black) are included for reference. The percentage of pDCs producing IFNα (C) or TNF-α (D) in response to imiquimod were compared between the time point before viremia at which the highest pDC frequency occurred and the time point immediately prior. *P < 0.05, by Wilcoxon test. n = 14 participants from RV397 (11 of whom received VRC01).
Figure 5
Figure 5. Increased frequency and activation of pDCs in participants with the longest period of aviremia.
(A) The frequency of pDCs as a percentage of lineage-negative cells is shown in blue for 2 participants in RV397 who had the longest period of aviremia (VL <20 copies/mL). The MFI of CD69 (green), PD-L1 (orange), and CD40 (purple) on pDCs is shown. The single-copy VL (black) is shown for participant 3499. (B) The frequency of pDCs that produced IFNα after in vitro imiquimod stimulation is shown (red), with pDC frequency and VL indicated for reference. Both participants received VRC01.
Figure 6
Figure 6. pDC signaling capacity negatively correlates with plasma IFNα2 levels.
(A) p-IRF7 levels were measured in pDCs by flow cytometry after in vitro imiquimod stimulation of PBMCs obtained at the visit with the lowest IFNα response or from the only remaining sample available after ATI (ATI visit). Spearman’s correlations were determined between the MFI of p-IRF7 and the loss of IFNα-producing capacity, as measured by the fold decrease in pDCs producing IFNα in vitro at the ATI visit compared with levels detected at the preceding visit. (B and C) Plasma IFNα2 levels in RV397 participants were measured by SIMOA assay at the ATI visit. Spearman’s correlations were performed between the plasma IFNα2 levels at the ATI visit and the MFI of p-IRF7 in pDCs after in vitro imiquimod stimulation of PBMCs obtained at the ATI visit (B) or a pre-ATI visit (C). n = 8 participants from RV397 (all of whom received VRC01).
Figure 7
Figure 7. Type I IFN gene expression negatively correlates with time to rebound.
(A) mRNA levels of cytokines, chemokines, surface receptors, and IFN signaling molecules were measured by BioMark in sorted pDCs obtained from the pre-ATI and ATI visits. Shown is the difference in CT values between the ATI and pre-ATI time points after normalization to GAPDH. Data indicate the mean ± SEM. *P < 0.05 and **P < 0.01, by 1-sample Wilcoxon test. Blue single asterisks indicate values that were no longer significant when corrected for a FDR of 10% by the Benjamini-Hochberg procedure. (B) Spearman’s correlation between plasma IFNα2 levels after viral rebound and the change in IFNA2 levels at the ATI time point. (C) Spearman’s correlation between the change in expression of IFN genes at the ATI time point and the days from the ATI time point to viral detection. n = 8 participants from RV397 (4 of whom received VRC01).
Figure 8
Figure 8. Schematic representation of pDC sensing of viral replication after ATI.
Step 1: After interruption of antiretroviral therapy, viral recrudescence from HIV-infected CD4+ T cells occurs in the tissues. Step 2: Successful viral replication leads to the recruitment of innate immune cells, including pDCs, which are one of the first to respond to initial HIV infection. pDC sensing of virus at the site of recrudescence results in their activation and rapid cytokine production. Step 3: Production of CCL4 by activated pDCs can recruit more CD4+ T cells to the site of viral replication, resulting in further viral propagation and, eventually, measurable virus in the blood. Step 4: Our data demonstrate an increased frequency of pDCs in the blood prior to detection of plasma viremia after ATI. These pDCs expressed the activation markers CD69, PD-L1, and CD40 as well as increased levels of CXCR4 and CD29, suggesting that they were trafficking to sites of inflammation. Step 5: pDCs in the blood showed a transient decline in the ability to produce IFNα after stimulation in vitro, indicating that they enter a state of refraction after in vivo activation.

Comment in

Similar articles

Cited by

References

    1. Siegal FP, et al. The nature of the principal type 1 interferon-producing cells in human blood. Science. 1999;284(5421):1835–1837. doi: 10.1126/science.284.5421.1835. - DOI - PubMed
    1. Fitzgerald-Bocarsly P. Human natural interferon-alpha producing cells. Pharmacol Ther. 1993;60(1):39–62. doi: 10.1016/0163-7258(93)90021-5. - DOI - PMC - PubMed
    1. Rasmussen SB, et al. Type I interferon production during herpes simplex virus infection is controlled by cell-type-specific viral recognition through toll-like receptor 9, the mitochondrial antiviral signaling protein pathway, and novel recognition systems. J Virol. 2007;81(24):13315–13324. doi: 10.1128/JVI.01167-07. - DOI - PMC - PubMed
    1. Tabeta K, et al. Toll-like receptors 9 and 3 as essential components of innate immune defense against mouse cytomegalovirus infection. Proc Natl Acad Sci USA. 2004;101(10):3516–3521. doi: 10.1073/pnas.0400525101. - DOI - PMC - PubMed
    1. Lund J, Sato A, Akira S, Medzhitov R, Iwasaki A. Toll-like receptor 9-mediated recognition of Herpes simplex virus-2 by plasmacytoid dendritic cells. J Exp Med. 2003;198(3):513–520. doi: 10.1084/jem.20030162. - DOI - PMC - PubMed

Publication types