. 2020 May 1;130(5):2602-2619.
doi: 10.1172/JCI135099.

The lymph node stromal laminin α5 shapes alloimmunity

Affiliations

The lymph node stromal laminin α5 shapes alloimmunity

Lushen Li et al. J Clin Invest. .

Abstract

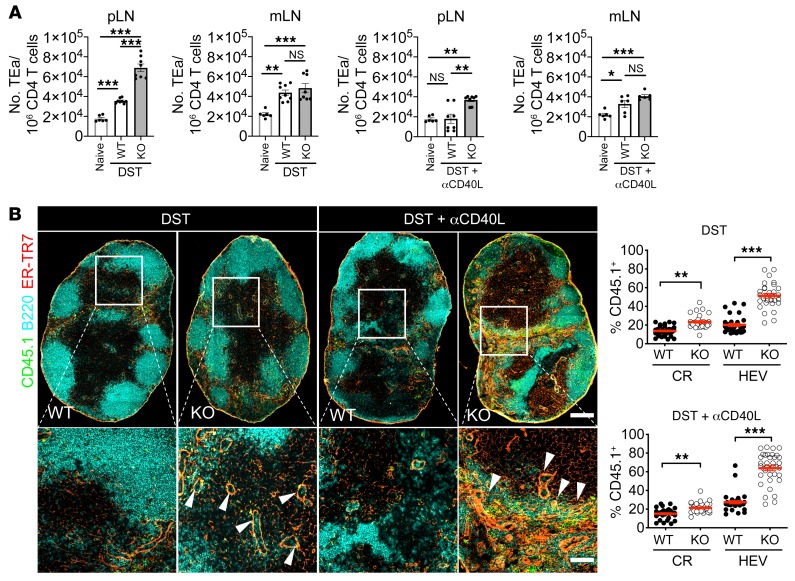
Lymph node stromal cells (LNSCs) regulate immunity through constructing lymphocyte niches. LNSC-produced laminin α5 (Lama5) regulates CD4+ T cells but the underlying mechanisms of its functions are poorly understood. Here we show that depleting Lama5 in LNSCs resulted in decreased Lama5 protein in the LN cortical ridge (CR) and around high endothelial venules (HEVs). Lama5 depletion affected LN structure with increased HEVs, upregulated chemokines, and cell adhesion molecules, and led to greater numbers of Tregs in the T cell zone. Mouse and human T cell transendothelial migration and T cell entry into LNs were suppressed by Lama5 through the receptors α6 integrin and α-dystroglycan. During immune responses and allograft transplantation, depleting Lama5 promoted antigen-specific CD4+ T cell entry into the CR through HEVs, suppressed T cell activation, and altered T cell differentiation to suppressive regulatory phenotypes. Enhanced allograft acceptance resulted from depleting Lama5 or blockade of T cell Lama5 receptors. Lama5 and Lama4/Lama5 ratios in allografts were associated with the rejection severity. Overall, our results demonstrated that stromal Lama5 regulated immune responses through altering LN structures and T cell behaviors. This study delineated a stromal Lama5-T cell receptor axis that can be targeted for immune tolerance modulation.

Keywords: Adaptive immunity; Immunology; T cells; Tolerance; Transplantation.


Conflict of interest statement

Conflict of interest: The authors have declared that no conflict of interest exists.

Figures

Figure 1
Figure 1. Characterization of Lama5 conditional KO mice.
(A) Lama4 and Lama5 gene expression in FRCs, BECs, and LECs in Lama5-KO and WT mice. Stromal cell subsets sorted from LNs of Lama5-KO and WT mice; Lama4 and Lama5 transcripts relative to cyclophilin A measured by qRT-PCR (n = 7). (B and C) Lama4 and Lama5 expression in peripheral LNs from Lama5-KO and WT mice. (B) LN sections stained for Lama4 and Lama5; representative images at ×20 original magnification. Scale bar: 100 μm. (C) Percentages of Lama4- and Lama5-positive areas, and Lama4/Lama5 ratios in the CR and around HEVs (n = 30). (D) pLNs stained for Foxp3, CD3, peanut agglutinin, and B220. Left: Representative images. Scale bar: 200 μm. Right: Quantification of Tregs in whole section and T cell zones (n = 30). In all panels, at least 3 independent experiments, 3 mice/group, 3 LNs/mouse, 3 sections/LN and 3–5 fields/section. Data are presented as mean ± SEM. **P < 0.01, ***P < 0.001 by unpaired, 2-tailed Student’s t test.
Figure 2
Figure 2. Depleting stromal Lama5 increases LN Tregs and HEVs.
(A) LN stained for ER-TR7 and CD31. (B) LN stained for PNAd and Foxp3 and colocalization of Foxp3 and PNAd analyzed by Pearson’s correlation coefficient (PCC). Scale bars: 200 μm (left) and 50 μm (right). In whole-section images, original magnification is ×20. Left panels, representative images; right panels, staining percentages (n = 30). (C) VEGF-A, VEGF-C, and VEGF-D gene expression in FRCs, BECs, and LECs in Lama5-KO and WT mice (n = 3). Data (mean ± SEM) are representative of 3 independent experiments with 3 mice/group, 3 LNs/mouse, 3 sections/LN, and 3–5 fields/section. *P < 0.05; ***P < 0.001 by unpaired, 2-tailed Student’s t test.
Figure 3
Figure 3. Depleting stromal Lama5 increases CCL21, CXCL12, and VCAM-1.
(A) Left and upper right: CCL21 and CXCL12 protein expression in the CR and around HEVs (n = 30). Scale bar: 200 μm; in whole-section images, original magnification is ×20. Lower right: CCL21 and CXCL12 gene expression in FRCs, BECs, and LECs in Lama5-KO and WT mice (n = 3). (B) VCAM-1 and ICAM-1 protein expression in the CR and around HEVs (n = 30). Scale bar: 50 μm. (C) VCAM-1, ICAM-1, and MAdCAM-1 gene expression in FRCs, BECs, and LECs in Lama5-KO and WT mice (n = 3). Data (mean ± SEM) are representative of 3 independent experiments with 3 mice/group, 3 LNs/mouse, 3 sections/LN, and 3–5 fields/section. *P < 0.05; **P < 0.01; ***P < 0.001 by unpaired, 2-tailed Student’s t test.
Figure 4
Figure 4. Lama5 regulates T cell migration via α6 integrin and αDG.
(A) CD4+ T cell track length and velocity migrating on surfaces coated with laminin α4β1γ1 (laminin 411) and/or α5β1γ1 (laminin 511) (2 μg/mL each) measured with real-time live imaging (n = 6). (B) αDG gene transcripts in various T cell subsets relative to hypoxanthine phosphoribosyltransferase (HPRT) measured by qRT-PCR (n = 4). (C) Track length and velocity of CD4+ T cells treated with blocking mAbs against α6 integrin (10 μg/mL, isotype IgG) or αDG (5 μg/mL, isotype IgM) (n = 6). (D) CD4+ T cell binding to 96-well flat-bottom plates coated with laminin 411 and/or 511 (2 μg/mL each), plus anti-CD3 (50 μg/mL) or CCL21 (500 ng/mL) (n = 8). Data (mean ± SEM) are representative of 3 experiments. *P < 0.05; **P < 0.01; ***P < 0.001 by 1-way ANOVA with Tukey’s multiple-comparisons test.
Figure 5
Figure 5. Lama5 inhibits CD4+ T cell and iTreg transendothelial migration via α6-integrin and αDG.
(A) Schematic representation of transwell assay. Boyden chambers were coated with 30 μg laminin; BECs line MS-1 monolayers coated on inserts. T cells (2 × 10⁵) were loaded into the upper chamber, and 500 ng/mL CCL21 was added to the bottom chamber. Percentage of cells that migrated to the bottom chamber was determined after 3 hours. (B) Percentage of migrated CD4+ T cells; anti–α6 integrin or anti-αDG pretreatment of T cells. (C) Migration of CD4+ T effector and memory cells, natural and induced Tregs, and CD8+ T cells. (D) CD4+ T cell migration across laminin 421 or/and laminin 521. (E and F) Migration efficiency of human CD4+ iTregs and T effector cells; anti–α6 integrin or anti-αDG pretreatment. n = 6 (BF). (G) Schematic representation of T cell migration in laminar flow channels with shear force using BioFlux. Laminar flow channels were coated with 30 μg/mL laminin 411 and/or 511. BEC MS-1 cells were grown to confluence and 500 ng/mL CCL21 was passed through the laminar flow channels and incubated at 37°C for 6 hours. CD4+ T cells or iTregs were passed through the flow channels at 0.5 dynes/cm2. (H) Adherence of CD4+ T cells or iTregs imaged at 1-minute intervals for 30 minutes. (I) CD4+ T cells pretreated with anti–α6 integrin or anti-αDG. n = 3 (H and I). (J) Adherence of CD4+ T cells or CD8+ T cells after 3 minutes of cell perfusion over BEC layers in a flow device (n = 6). Data are presented as mean ± SEM from 3 independent experiments. *P < 0.05; **P < 0.01; ***P < 0.001; ****P < 0.0001 by 1-way ANOVA with Tukey’s multiple-comparisons test.
Figure 6
Figure 6. Lama5 regulates CD4+ T cell and Treg entry into LNs via αDG and α6 integrin.
(A) CFSE-labeled iTregs (2 × 10⁶) and 2 × 10⁶ eFluor 670–labeled CD4+ cells transferred i.v. to Lama5-KO or WT mice. After 16 hours, LNs were stained for ER-TR7 and with DAPI and analyzed for the transferred cells. Left panels: Representative whole-section images (original magnification, ×20); arrowheads indicate HEVs. Scale bars: 200 μm (left) and 50 μm (right). Right panels: Quantification of naive CD4+ T cells and iTregs in the CR and HEVs (n = 30). (B and C) T cells pretreated with anti-αDG (2.5 μg mAb/106 cells, isotype IgM) or anti–α6 integrin (itg) (5 μg mAb/106 cells, isotype IgG) before transfer. After 16 hours, LNs were harvested for immunohistochemistry and flow cytometry. (B) Upper panels: Gating strategy. Lower panels: Number of transferred naive CD4+ T cells (eFluor 670+) and iTregs (CFSE+) per 1 × 10⁶ total CD4+ T cells or total Foxp3+ cells (n = 6). (C) Upper panels: Representative scanning images (original magnification, ×20). LNs were stained for ER-TR7 and with DAPI and analyzed for transferred cells. Scale bar: 50 μm. Lower panels: Quantification of transferred naive CD4+ T cells (eFluor 670+) and iTregs (CFSE+) in the CR and HEVs (n = 30). Data (mean ± SEM) are from 3 independent experiments with 3 mice/group. For immunohistochemistry, 5 LNs/mouse, 3 sections/LN, and 3–5 fields/section. *P < 0.05; ***P < 0.001 by unpaired, 2-tailed Student’s t test.
Figure 7
Figure 7. Systemically blocking αDG and α6 integrin increases CD4+ T cell and nTreg accumulation in LNs.
C57BL/6 mice were injected i.v. with 10 μg anti-αDG (isotype IgM) or 10 μg anti–α6 integrin (itg) (isotype IgG); LNs were harvested after 16 hours. (A) Representative whole-section images (original magnification, ×20). Scale bars: 200 μm (upper) and 50 μm (lower). Sections were stained for Foxp3 and ER-TR7; arrowheads indicate HEVs. (B) Quantification of nTregs in the CR and HEVs (n = 30). (C) Gating strategy for CD4+ T cells and nTregs; values show population percentage. (D) Number of CD4+ T cells and nTregs in each LN (n = 10). Data (mean ± SEM) are based on at least 3 independent experiments with 3 mice/group. For immunohistochemistry, 3 LNs/mouse, 3 sections/LN, and 3–5 fields/section. For flow cytometry, 5 LNs/mouse. *P < 0.05, **P < 0.01, ***P < 0.001 by unpaired, 2-tailed Student’s t test.
Figure 8
Figure 8. LN stromal Lama5 regulates antigen-specific CD4+ T cell distribution in LNs in immunity and tolerance.
CD45.1+CD4+ TEa cells (1 × 10⁶) were injected i.v. into immune (plus 1 × 10⁷ DST) or tolerant (plus 1 × 10⁷ DST and 250 μg anti-CD40L) Lama5-KO and WT mice. WT mice only injected with TEa cells served as negative control (naive). (A) Number of TEa cells out of 1 × 10⁶ CD4+ T cells in LNs 3 days after injection (n = 6–8). (B) Left panels: Representative whole-section images (original magnification, ×20). Scale bars: 200 μm (upper) and 50 μm (lower). LNs were harvested 3 days after injection and sections stained for ER-TR7, B220, and CD45.1; arrowheads indicates HEVs. Right panels: Quantification of TEa cells (CD45.1+) in the CR and HEVs (n = 30). Data (mean ± SEM) are representative of 2 independent experiments. For immunohistochemistry, 5 LNs/mouse, 3 sections/LN, and 3–5 fields/section. For flow cytometry, 5 LNs/mouse. *P < 0.05; **P < 0.01; ***P < 0.001 by 1-way ANOVA with Tukey’s multiple-comparisons test for multiple-variable differences (A) or unpaired, 2-tailed Student’s t test for single-variable differences (B).
Figure 9
Figure 9. LN stromal Lama5 regulates antigen-specific CD4+ T cell responses in immunity and tolerance.
CD45.1+CD4+ TEa cells (1 × 10⁶) were injected i.v. into immune (plus 1 × 10⁷ DST) or tolerant (plus 1 × 10⁷ DST and 250 μg anti-CD40L) Lama5-KO and WT mice. WT mice only injected with TEa cells served as negative control (naive). (A) CD44 and CD69 expression on TEa cells 3 and 5 days after injection. Left graph: Gating strategy with WT pLNs; values show population percentage. Right panels: CD44hiCD69+ populations in pLNs and mLNs (n = 3–5). (B) TEa cell differentiation into Tregs or Th17 cells 3 and 5 days after injection. Left panels: Gating strategy with WT pLNs with DST plus anti-CD40L; values show population percentage. Right panels: Treg/Th17 ratios in SLOs under immunity and tolerance induction (n = 3). Data (mean ± SEM) are representative of 2 independent experiments. Gray bars, WT; white bars, KO. **P < 0.01, ***P < 0.001 by unpaired, 2-tailed Student’s t test.
Figure 10
Figure 10. LN stromal Lama5 regulates alloimmunity.
(A) Lama5-KO and WT mice received BALB/c cardiac allografts alone, (B) with tacrolimus (2 mg/kg/day s.c.), or (C) with anti-CD40L mAb (250 μg i.v. day 0). (DF) Anti–α6 integrin mAb, anti-αDG mAb, or isotype controls (10 μg each i.v.) were administered every 3 days. (G and H) Anti–α6 integrin, anti-αDG mAb, or isotype control (10 μg i.v., every 7 days) with tacrolimus (2 mg/kg/day s.c.). Graft survival with log-rank comparisons; n = 6–8 mice/group. Median survival time (MST) was calculated. In G, the “x” indicates that the mouse died before rejection was observed. In AH, n values indicate numbers of transplanted mice. P < 0.05 was considered statistically significant.
Figure 11
Figure 11. Lama4 and Lama5 in grafts are associated with rejection severity.
Normal hearts, transplanted hearts on day 6 (not yet rejected) and day 9 (no treatment, rejected; anti-CD40L treated, not yet rejected) were stained for Lama4, Lama5, CD31, and with DAPI. (A) Representative whole-section images (original magnification, ×20). Scale bar: 800 μm. (B) Quantification of Lama4- and Lama5-positive areas and Lama5/Lama4 ratios (n = 45); DAPI-negative ventricular lumen omitted. Data (mean ± SEM) are representative of 3 independent experiments with 3 mice/group, 3 sections/graft. *P < 0.05; **P < 0.01; ***P < 0.001 by 1-way ANOVA with Tukey’s multiple-comparisons test for multiple-variable differences.
Figure 12
Figure 12. LN stromal Lama5 regulates graft-reactive cell responses.
CD45.1+CD4+ TEa cells (1 × 10⁶) and 250 μg anti-CD40L were injected i.v. into Lama5-KO and WT recipients on the day of BALB/c heart transplantation. WT mice only injected with TEa cells without transplantation served as negative controls (naive). LNs were harvested after 3 and 5 days. (A) Number of TEa cells out of 1 × 10⁶ CD4+ T cells 3 days after transplantation. Left panels: Gating strategy for CD4+ T cells and TEa cells in WT pLNs (n = 6). (B) CD44 and CD69 expression by TEa cells at 3 and 5 days after transplantation. Left panels: Representative graphs with WT and Lama5-KO pLNs; values show population percentage (n = 3). (C) TEa cell differentiation into Tregs and Th17 cells 3 and 5 days after transplantation. Left panels: Gating strategy for Foxp3+ and IL-17+ TEa cells in WT pLNs; values indicate population percentage. Right panels: Treg/Th17 ratios (n = 3). Data (mean ± SEM) are representative of 2 independent experiments. White bars, WT; gray bars, KO. *P < 0.05; **P < 0.01; ***P < 0.001 by 1-way ANOVA with Tukey’s multiple-comparisons test for multiple-variable differences (A) or unpaired, 2-tailed Student’s t test for single-variable differences (B and C).
Figure 13
Figure 13. Schematic presentation of the role of Lama5 in T cell migration and CD4+ T cell differentiation in LNs.
(1) Lama5 inhibits CD4+ T cell and Treg migration across HEVs to enter the LN cortical ridge through α6 integrin and αDG receptors on T cells. (2) Depleting Lama5 increases the number of HEVs and upregulates CCL21, CXCL12, and VCAM-1, which regulate T cell trafficking in the LN. (3) Lama5 promotes CD4+ T cell differentiation into Th17 cells and inhibits the differentiation into Tregs.

References

    1. Bajénoff M, et al. Stromal cell networks regulate lymphocyte entry, migration, and territoriality in lymph nodes. Immunity. 2006;25(6):989–1001. doi: 10.1016/j.immuni.2006.10.011. - DOI - PMC - PubMed
    1. Perez-Shibayama C, Gil-Cruz C, Ludewig B. Fibroblastic reticular cells at the nexus of innate and adaptive immune responses. Immunol Rev. 2019;289(1):31–41. doi: 10.1111/imr.12748. - DOI - PMC - PubMed
    1. Gretz JE, Anderson AO, Shaw S. Cords, channels, corridors and conduits: critical architectural elements facilitating cell interactions in the lymph node cortex. Immunol Rev. 1997;156:11–24. doi: 10.1111/j.1600-065X.1997.tb00955.x. - DOI - PubMed
    1. Malhotra D, et al. Transcriptional profiling of stroma from inflamed and resting lymph nodes defines immunological hallmarks. Nat Immunol. 2012;13(5):499. doi: 10.1038/ni.2262. - DOI - PMC - PubMed
    1. Nakayama Y, Bromberg JS. Lymphotoxin-beta receptor blockade induces inflammation and fibrosis in tolerized cardiac allografts. Am J Transplant. 2012;12(9):2322–2334. doi: 10.1111/j.1600-6143.2012.04090.x. - DOI - PMC - PubMed

Publication types

MeSH terms

LinkOut - more resources