. 2020 Feb 4;15(2):e0228484.
doi: 10.1371/journal.pone.0228484. eCollection 2020.

Molecular analysis of lymphoid tissue from rhesus macaque rhadinovirus-infected monkeys identifies alterations in host genes associated with oncogenesis

Affiliations

Molecular analysis of lymphoid tissue from rhesus macaque rhadinovirus-infected monkeys identifies alterations in host genes associated with oncogenesis

Ryan Douglas Estep et al. PLoS One. .

Abstract

Rhesus macaque (RM) rhadinovirus (RRV) is a simian gamma-2 herpesvirus closely related to human Kaposi's sarcoma-associated herpesvirus (KSHV). RRV is associated with the development of diseases in simian immunodeficiency virus (SIV) co-infected RM that resemble KSHV-associated pathologies observed in HIV-infected humans, including B cell lymphoproliferative disorders (LPD) and lymphoma. Importantly, how de novo KSHV infection affects the expression of host genes in humans, and how these alterations in gene expression affect viral replication, latency, and disease is unknown. The utility of the RRV/RM infection model provides a novel approach to address these questions in vivo, and utilizing the RRV bacterial artificial chromosome (BAC) system, the effects of specific viral genes on host gene expression patterns can also be explored. To gain insight into the effects of RRV infection on global host gene expression patterns in vivo, and to simultaneously assess the contributions of the immune inhibitory viral CD200 (vCD200) molecule to host gene regulation, RNA-seq was performed on pre- and post-infection lymph node (LN) biopsy samples from RM infected with either BAC-derived WT (n = 4) or vCD200 mutant RRV (n = 4). A variety of genes were identified as being altered in LN tissue samples due to RRV infection, including cancer-associated genes activation-induced cytidine deaminase (AICDA), glypican-1 (GPC1), CX3C chemokine receptor 1 (CX3CR1), and Ras dexamethasone-induced 1 (RasD1). Further analyses also indicate that GPC1 may be associated with lymphomagenesis. Finally, comparison of infection groups identified the differential expression of host gene thioredoxin interacting protein (TXNIP), suggesting a possible mechanism by which vCD200 negatively affects RRV viral loads in vivo.


Conflict of interest statement

The authors have declared that no competing interests exist.

Figures

Fig 1
Fig 1. Viral gene expression in LN biopsy samples of RRV-infected RM.
RNA-seq data obtained from d28 pi LN biopsy samples of WT BAC and vCD200 N.S. infection groups was analyzed for RRV transcript expression. Values presented are the averages of normalized viral gene counts for all animals within each infection group (n = 4), with error bars indicating standard deviation. RRV gene names are listed on the X axis as organized from 5′ to 3′ in the RRV17577 genome. ORFRU14-L was the only viral gene found to display a significant difference in expression levels between infection groups (*, p = 0.0023, unpaired t-test).
Fig 2
Fig 2. Effects of RRV infection on cellular gene expression profiles in LN tissue.
(A) Volcano plot displaying the log2 fold-change in expression from d0 to d28 pi, and the associated -log10 FDR p value, for all cellular genes detected by RNA-seq analysis in LN biopsy samples of all 8 RRV-infected RM combined. Only those genes that displayed a ≥ 2-fold change in expression from d0 to d28 pi, with an associated FDR p value of <0.05, were considered for further analysis. Using these criteria, 60 genes were found to be significantly upregulated, and only 1 gene was found to be significantly downregulated after RRV infection. Upregulated (B) and downregulated (C) genes of interest were sorted into categories based on putative functionality. Asterisks indicate the 3 genes displaying the highest changes in expression overall, and genes in bold font indicate those assessed by follow-up qRT-PCR analysis.
Fig 3
Fig 3. qRT-PCR analysis of LN biopsy samples from individual RM.
RNA samples from d0 and d28 post-infection LN biopsies of individual RM were analyzed by qRT-PCR for the expression of GPC1 (A), AICDA (B), CX3CR1 (C), and RasD1 (D). Data represents fold change in normalized gene expression values (gene copy number/GAPDH copy number) at d28 post-infection compared to d0 values. Error bars denote standard deviation, and a dashed line indicates 2-fold change value. Individual animal numbers and their associated infection groups are noted.
Fig 4
Fig 4. AICDA expression in sorted cell populations and tissue sections of LN biopsy samples.
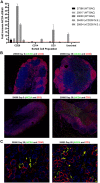
(A) Cells from LN biopsy samples of three WT BAC and two vCD200 N.S.-infected RM were subjected to sorting using magnetic beads to obtain purified CD20+, CD14+, and CD3+ cell populations, and RNA was isolated from each population as well as remaining unsorted cells for use in qRT-PCR using AICDA-specific primers. Due to lack of sufficient RNA, unsorted samples of animals 29000 and 28834, and CD14 and CD3 samples of animal 26430, were not capable of being analyzed. Data represents fold change in normalized gene expression values (gene copy number/GAPDH copy number) at d28 pi compared to d0 values, and error bars indicate standard deviation. (B) Tissue staining of LN biopsy samples from animal 29000. Tissue sections were stained with anti-AICDA antibody (green), anti-CD20 or anti-CD3 antibody (red), and DAPI (blue) to stain nuclei. Original magnification X20. (C) Enlarged images of d28 pi tissue sections from animal 29000 demonstrating co-localization of AICDA with CD20+ B cells (left panel) and CD3+ T cells (right panel).
Fig 5
Fig 5. Flow cytometry analysis of Glypican-1 expression in LN biopsy and lymphoma tissues.
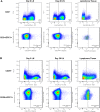
Total cells derived from d0 and d28 pi LN biopsy and lymphoma tissue samples from animal 29119 were stained with antibodies directed against Glypican-1 (GPC1), CD20, CD3, and CD14, and analyzed by flow cytometry. Data was gated to determine the percentage of (A) CD3+ and CD3+/GPC1+ or (B) CD20+ and CD20+/GPC1+ cells in each sample. CD14+ cells represented < 1% of all cells in lymphoma and LN tissue samples.
Fig 6
Fig 6. Cross comparison of cellular gene expression between WT BAC and vCD200 N.S. infection groups.
(A) Volcano plot displaying the log2 fold-change in expression from d0 to d28 pi, and the associated -log10 FDR p value, of all cellular genes identified by RNA-seq in WT BAC and vCD200 N.S. infection groups. (B) Venn diagrams comparing genes upregulated or downregulated in WT BAC or vCD200 N.S. infection groups. Only genes displaying a ≥1.45-fold change in expression with an accompanying FDR p value of < 0.05 were used for cross comparison analysis. The number of genes unique to each group displaying a ≥ 2-fold change in expression are indicated. Identified genes of interest from cross comparison analysis that display specific ≥ 2-fold upregulation in vCD200 N.S. infection group (C), ≥ 2-fold downregulation in WT BAC infection group (D), or ≥ 2-fold downregulation in vCD200 N.S. infection group (E). Functional categories of genes are indicated, and genes highlighted in bold were assessed by follow-up qRT-PCR analysis.
Fig 7
Fig 7. TXNIP gene expression in LN of individual RM and sorted cell populations from WT BAC and vCD200 N.S. infection groups.
(A) RNA samples from d0 and d28 pi LN biopsy cells of individual RM were analyzed for expression levels of TXNIP by qRT-PCR. Data represents the fold change decrease in normalized gene expression values (gene copy number/GAPDH copy number) from d0 to d28 pi, and individual animals and infection groups are noted. Error bars denote standard deviation, and a dashed line indicates 2-fold change value. (B) Cells from LN biopsy samples of individual animals from WT BAC (animals 29119, 27386, 29000, and 25617) and vCD200 N.S. (animals 26430, 25662, 28902, and 28834) infection groups were subjected to sorting using magnetic beads to obtain purified CD20+, CD14+, and CD3+ cell populations, and RNA was isolated from each population as well as remaining unsorted cells for use in qRT-PCR using TXNIP-specific primers. The average fold-change decrease in normalized gene expression values (gene copy number/GAPDH copy number) from d0 to d28 pi for each infection group is shown. Error bars denote standard deviation, and a dashed line indicates 2-fold change value. The difference in decreased TXNIP expression in CD20+ cells was found to be significantly different between WT BAC and vCD200 N.S. infection groups by unpaired t-test (*, p = 0.0369).

Similar articles

Cited by

References

    1. Wong SW, Bergquam EP, Swanson RM, Lee FW, Shiigi SM, Avery NA, et al. Induction of B cell hyperplasia in simian immunodeficiency virus-infected rhesus macaques with the simian homologue of Kaposi’s sarcoma-associated herpesvirus. J Exp Med. 1999;190(6):827–40. 10.1084/jem.190.6.827 . - DOI - PMC - PubMed
    1. Orzechowska BU, Powers MF, Sprague J, Li H, Yen B, Searles RP, et al. Rhesus macaque rhadinovirus-associated non-Hodgkin lymphoma: animal model for KSHV-associated malignancies. Blood. 2008;112(10):4227–34. 10.1182/blood-2008-04-151498 . - DOI - PMC - PubMed
    1. Bergquam EP, Avery N, Shiigi SM, Axthelm MK, Wong SW. Rhesus rhadinovirus establishes a latent infection in B lymphocytes in vivo. J Virol. 1999;73(9):7874–6. . - PMC - PubMed
    1. Estep RD, Axthelm MK, Wong SW. A G protein-coupled receptor encoded by rhesus rhadinovirus is similar to ORF74 of Kaposi’s sarcoma-associated herpesvirus. J Virol. 2003;77(3):1738–46. 10.1128/JVI.77.3.1738-1746.2003 . - DOI - PMC - PubMed
    1. Kaleeba JA, Bergquam EP, Wong SW. A rhesus macaque rhadinovirus related to Kaposi’s sarcoma-associated herpesvirus/human herpesvirus 8 encodes a functional homologue of interleukin-6. J Virol. 1999;73(7):6177–81. . - PMC - PubMed

Publication types

MeSH terms