. 2020 Mar 19;27(3):350-362.e8.
doi: 10.1016/j.chembiol.2020.01.007. Epub 2020 Feb 3.

A Genetic Toggle for Chemical Control of Individual Plk1 Substrates

Affiliations

A Genetic Toggle for Chemical Control of Individual Plk1 Substrates

James M Johnson et al. Cell Chem Biol. .

Abstract

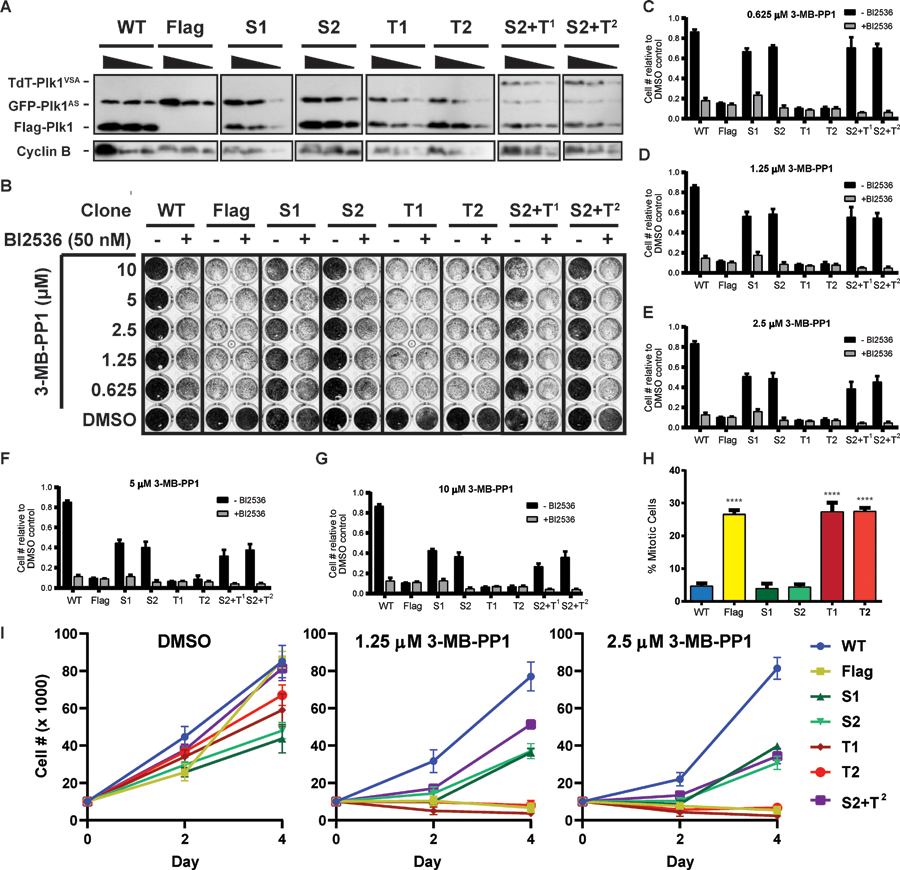
Polo-like kinase 1 has hundreds of substrates and multiple functions that operate within the ∼60 min of mitosis. Herein, we describe a chemical-genetic system that allows particular substrates to be "toggled" into or out of chemical control using engineered phosphoacceptor selectivity. Biochemical assays and phosphoproteomic analysis of mitotic cell extracts showed that Plk1S (L197F) and Plk1T (L197S/L211A) selectively phosphorylate Ser and Thr, respectively. Plk1S but not Plk1T sustains mitotic progression to anaphase, affording the opportunity to toggle substrate residues between Ser and Thr to place them under chemical control. Using this system, we evaluated Kif2b, a known substrate of Plk1 that regulates chromosome alignment. Toggling Ser to Thr on Kif2b places these phosphorylation sites under reversible chemical control, as indicated by a sharp increase in the frequency of misaligned chromosomes and prometaphase arrest. Thus, we demonstrate the ability to chemically control a single substrate by a genetic Ser/Thr toggle.

Keywords: Kif2b; chemical biology; chemical-genetics; genetic toggle; kinase; mitosis; phosphoacceptor selectivity; phosphorylation.


Conflict of interest statement

Declaration of Interests The authors declare no competing interests.

Figures

Figure 1:
Figure 1:. Engineered phosphoacceptor selectivity of Plk1.
(A) Amino acid sequence alignment of Plk1(WT or with substitutions to confer Ser or Thr selectivity ) with kinases of known phosphoacceptor preference. (B) Schematic of substrates used for in vitro kinase assays. (C) SDS-PAGE of GST-tagged Plk1 kinase domains (aa 1–352) purified from E. coli. (D) In vitro kinase assays with GST-Plk1 kinase domains and substrates as indicated. Phosphorylation was detected by incorporation of [γ−32P] ATP. (E) Quantification of phosphorylation intensity from (C). n = 3, mean + SEM (relative to Plk1WT phosphorylation of casein). **p < 0.01, and ****p < 0.0001 by two-way ANOVA with post hoc Tukey multiple comparison test. (F) Models of Plk1 with indicated amino acid substitutions interacting with either Ser or Thr phosphoacceptors. See also figure S1.
Figure 2:
Figure 2:. Phosphoacceptor specific alleles yield distinct cellular phenotypes
(A) Immunoblot with serial dilutions of extract from clones expressing Plk1 alleles as indicated, Blotting for Cyclin B was used as a control for mitotic index. (B) Proliferation assay with clones from (A) stained with crystal violet. Filled black circles indicate 100% confluent cells. (C-G) Quantification of proliferation assays shown in (B). n = 3, mean + SEM relative to the DMSO control for each clone. For all conditions within each 3-MB-PP1 concentration, a significant difference in relative cell number compared to WT minus BI2536 was seen: p < 0.0001 by two-way ANOVA with post hoc Tukey’s multiple comparisons test (H) Mitotic index of clones from (A) following 16 hr treatment with 10µM 3-MB-PP1. n = 3, 300 cells/condition/replicate, mean +SEM. ****p < 0.0001 vs WT by one-way ANOVA with post hoc Dunnet’s multiple comparison test. (I) Time course of proliferation of clones from (A) with treatment of indicated concentrations of 3-MB-PP1. Clones were plated at 10,000 cells per well and harvested 2- and 4-days following treatment. Cell numbers were counted manually by hemocytometer. N = 3, data presented as mean cell number ± SEM. See also figure S2.
Figure 3:
Figure 3:. Phosphoproteomics analysis demonstrates a Ser preference for Plk1S in cell culture.
(A) Drug treatments for LC-MS/MS analysis. (B) Summary of mass-spectrometry data. Each horizontal line represents a unique phosphopeptide. Sites conforming to either Plk1-CM or Other-CM indicated by black lines on left. Average log2 fold change from five biological replicates for each drug treatment relative to nocodazole alone plotted in color. p<0.05 is indicated on the right side of each treatment column in black. Expected regulation of Ser and Thr for each drug treatment shown below graph. (C) Mann-Whitney statistics comparing distribution of regulation of phosphopeptides containing Plk1-CM vs Other-CM or Other-CM vs No-CM with 10 µM 3-MB-PP1 + 200 nM BI2536 treatment. (D) Correlation plot of relative abundance of Plk1-dependent phosphopeptides containing the Plk1-CM. Analysis of Plk1 dependent phosphopeptides from (B) as determined by log2 fold-change < −0.7 with p < 0.05. Phosphopeptides conforming to the Plk1-CM were separated and further divided between Ser and Thr phosphoacceptors. Likewise, phosphopeptides containing Other-CM were divided between Ser and Thr phosphoacceptors. (E) Percentage of Plk1 dependent phosphorylations maintained by Plk1S relative to Plk1AS, conforming to either the Plk1-CM or Other-CM. (F) Average relative phosphorylation levels maintained by Plk1S compared to Plk1AS of substrates conforming to either the Plk1-CM or Other-CM. (G) Summary of Mann-Whitney statistics comparing the distribution of regulation of Plk1-dependent phosphopeptides containing Plk1-CM with Ser vs Thr phosphoacceptors or phosphopeptides containing Other-CM with Ser vs Thr phosphoacceptors when only Plk1S active with 10 µM 3-MB-PP1.
Figure 4:
Figure 4:. Ser phosphorylations are sufficient to rescue pre-anaphase functions of Plk1.
(A) Representative images of pre-anaphase mitotic spindles from cells treated with 10 µM 3-MB-PP1 for 16 h. Scale bar = 10µm. See also figure S3A. (B) Quantification of bipolar spindle formation from indicated monoclonal cell lines from (A). n = 3, (>50 cells/condition/replicate), mean + SEM of % of pre-anaphase cells with bipolar spindles cells. (C) Representative images of metaphase cells after treatment with 1 µM 3-MB-PP1 for 8 h. Scale bar = 10µm. See also figure S3B. (D) Quantification of chromosome alignment in monoclonal cell lines from (C). n = 3 (>50 cells/condition/replicate), mean + SEM of % of metaphase cells with one or more misaligned chromosomes. (E) Representative images of anaphase cells after treatment with 0.5 µM 3-MB-PP1 for 8 h. Scale bar = 10µm. See also figure S4. (F) Quantification of chromosome missegregation in monoclonal cell lines from (E). n = 3 (>25 cells/condition/replicate), mean +SEM of % of anaphase cells with one or more misaligned chromosomes. (B,D,F) *p < 0.05, **p < 0.01, ***p < 0.001, ****p < 0.0001 vs WT by one-way ANOVA with post hoc Dunnet’s multiple comparison test.
Figure 5:
Figure 5:. Ser and Thr phosphorylations are required for post-anaphase Plk1 functions.
(A) Schematic of drug treatment for (B-E). (B) Representative images of anaphase cells after treatment as in (A). Scale bar = 10µm. See also figure S5A. (c) Quantification of central spindle localized Plk1 in anaphase cells from monoclonal cell lines from (A). n = 3 (>25 cells/condition/replicate), mean + SEM. See also figure S5B. (D) Quantification of furrow formation in anaphase cells from monoclonal cell lines from (A). n = 3 (>25 cells/condition/replicate), mean + SEM. See also figure S5(C). (E) Quantification of pS170-Cyk4 staining in anaphase cells from monoclonal cell lines from (A). n = 3 (>25 cells/condition/replicate), mean + SEM. (F) Representative images of interphase cells after treatment with 10µM 3-MB-PP1 for 24 h. Scale bar = 50µm. See also figure S6. (G) Quantification of abnormal nuclei from monoclonal cell lines from (F). n = 3 (>100 cells/condition/replicate), mean + SEM. (C,D,E,G) *p < 0.05, **p < 0.01, ****p < 0.0001 vs WT by one-way ANOVA with post hoc Dunnet’s multiple comparison test, or S2 vs S2 +T2 by unpaired two-tailed t test.
Figure 6:
Figure 6:. Selective and reversible inhibition of Plk1 phosphorylations on Kif2b.
(A) Western blot following RFP-Trap immunoprecipitation of polyclonal cell lines expressing GFP-Plk1AS and Flag-Plk1WT or Flag-Plk1S, in combination with mCh-Kif2b constructs indicted * indicates non-specific band detected by the dsRed antibody. (B) Representative images of metaphase cells from of clones described in (A) treated with 10 µM 3-MB-PP1. Scale bar = 10µm. (C) Quantification of misaligned chromosomes in metaphase cells of polyclonal cell lines in (B). n = 3 (>50 cells/condition/replicate), mean +SEM. *p < 0.05, **p < 0.01, and ****p < 0.0001 by two-way ANOVA with post hoc Tukey multiple comparison test. (D) Montage from time-lapse of a single Plk1S/Kif2b5T clone treated with or without 10 µM 3-MB-PP1 for 18 hr. Scale bar = 20 µm. (E) Quantification of duration of mitosis from cells treated in (D) measured from nuclear envelope breakdown (NEBD) to anaphase onset. (F) Montage from time-lapse of Plk1S/Kif2b5T clone treated with 10 µM 3-MB-PP1 for 8h, followed by washout then treatment with or without 10 µM 3-MB-PP1 for 10 h. Scale bar = 20 µm. (G) Quantification of mitotic duration of cells treated in (f) measured from NEBD to anaphase onset.

References

    1. Alexander J et al. (2011) ‘Spatial exclusivity combined with positive and negative selection of phosphorylation motifs is the basis for context-dependent mitotic signaling.’, Science signaling. Europe PMC Funders, 4(179), p. ra42. doi: 10.1126/scisignal.2001796. - DOI - PMC - PubMed
    1. Bakhoum SF et al. (2009) ‘Genome stability is ensured by temporal control of kinetochore–microtubule dynamics’, Nature Cell Biology. Nature Publishing Group, 11(1), pp. 27–35. doi: 10.1038/ncb1809. - DOI - PMC - PubMed
    1. Barr FA, Silljé HHW and Nigg EA (2004) ‘Polo-like kinases and the orchestration of cell division’, Nature Reviews Molecular Cell Biology. Nature Publishing Group, 5(6), pp. 429–441. doi: 10.1038/nrm1401. - DOI - PubMed
    1. Benada et al., (2015) ‘Polo-like kinase 1 inhibits DNA damage response during mitosis’, Cell Cycle. Taylor and Francis Group, 14(2), pp. 219–231. doi: 10.461/15384101.2014.977067. - DOI - PMC - PubMed
    1. Biasini M et al. (2014) ‘SWISS-MODEL: modelling protein tertiary and quaternary structure using evolutionary information’, Nucleic Acids Research. Oxford University Press, 42(W1), pp. W252–W258. doi: 10.1093/nar/gku340. - DOI - PMC - PubMed

Publication types

LinkOut - more resources