Understanding the asthmatic response to an experimental rhinovirus infection: Exploring the effects of blocking IgE
- PMID: 32018030
- PMCID: PMC7733370
- DOI: 10.1016/j.jaci.2020.01.035
Understanding the asthmatic response to an experimental rhinovirus infection: Exploring the effects of blocking IgE
Abstract
Background: Rhinovirus frequently causes asthma exacerbations among children and young adults who are allergic. The interaction between allergen and rhinovirus-induced symptoms and inflammation over time is unclear.
Objective: Our aim was to compare the response to an experimental inoculation with rhinovirus-16 in allergic asthmatics with the response in healthy controls and to evaluate the effects of administrating omalizumab before and during the infection.
Methods: Two clinical trials were run in parallel. In one of these trials, the response to an experimental inoculation with rhinovirus-16 among asthmatics with high levels of total IgE was compared to the response in healthy controls. The other trial compared the effects of administering omalizumab versus placebo to asthmatics in a randomized, double-blind placebo-controlled investigation. The primary outcome for both trials compared lower respiratory tract symptoms (LRTSs) between study groups over the first 4 days of infection.
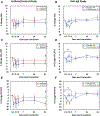
Results: Frequent comparisons of symptoms, lung function, and blood eosinophil counts revealed differences that were more pronounced among allergic asthmatics than among controls by days 2 and 3 after virus inoculation. Additionally, an augmentation of upper respiratory tract symptom scores and LRTS scores occurred among the atopic asthmatics versus the controls during the resolution of symptoms (P < .01 for upper respiratory symptom tract scores and P < .001 for LRTS scores). The beneficial effects of administering omalizumab on reducing LRTSs and improving lung function were strongest over the first 4 days.
Conclusions: LRTSs and blood eosinophil counts were augmented and lung function was reduced among allergic asthmatics early after rhinovirus inoculation but increased late in the infection during symptom resolution. The effect of administering omalizumab on the response to rhinovirus was most pronounced during the early/innate phase of the infection.
Keywords: Asthma; IgE; allergy; anti-IgE; omalizumab; rhinovirus; viral infection.
Copyright © 2020. Published by Elsevier Inc.
Figures


Comment in
-
Immune responses to rhinoviruses and asthma: Are we 3 steps closer to the door?J Allergy Clin Immunol. 2020 Sep;146(3):513-514. doi: 10.1016/j.jaci.2020.06.031. Epub 2020 Jul 14. J Allergy Clin Immunol. 2020. PMID: 32673613 No abstract available.
References
-
- Rakes GP, Arruda E, Ingram JM, Hoover GE, Zambrano JC, Hayden FG, et al. Rhinovirus and respiratory syncytial virus in wheezing children requiring emergency care. IgE and eosinophil analyses. Am J Respir Crit Care Med 1999;159:785–90. - PubMed
Publication types
MeSH terms
Substances
Grants and funding
- U01 AI125056/AI/NIAID NIH HHS/United States
- UL1 TR000039/TR/NCATS NIH HHS/United States
- KL2 TR000063/TR/NCATS NIH HHS/United States
- U01 AI100799/AI/NIAID NIH HHS/United States
- UL1 TR003107/TR/NCATS NIH HHS/United States
- R01 AI020565/AI/NIAID NIH HHS/United States
- UG1 HL139126/HL/NHLBI NIH HHS/United States
- M01 RR000847/RR/NCRR NIH HHS/United States
- P20 GM103625/GM/NIGMS NIH HHS/United States
- R37 AI020565/AI/NIAID NIH HHS/United States
- P01 AI050989/AI/NIAID NIH HHS/United States
- U01 AI123337/AI/NIAID NIH HHS/United States
- L40 AI107898/AI/NIAID NIH HHS/United States
- T32 AI007496/AI/NIAID NIH HHS/United States
- P20 GM121293/GM/NIGMS NIH HHS/United States
- K08 AI121345/AI/NIAID NIH HHS/United States
- R01 AI052196/AI/NIAID NIH HHS/United States
- KL2 TR001448/TR/NCATS NIH HHS/United States

