. 2020 Jan 30;21(3):890.
doi: 10.3390/ijms21030890.

Estradiol-17β-Induced Changes in the Porcine Endometrial Transcriptome In Vivo

Affiliations

Estradiol-17β-Induced Changes in the Porcine Endometrial Transcriptome In Vivo

Piotr Kaczynski et al. Int J Mol Sci. .

Abstract

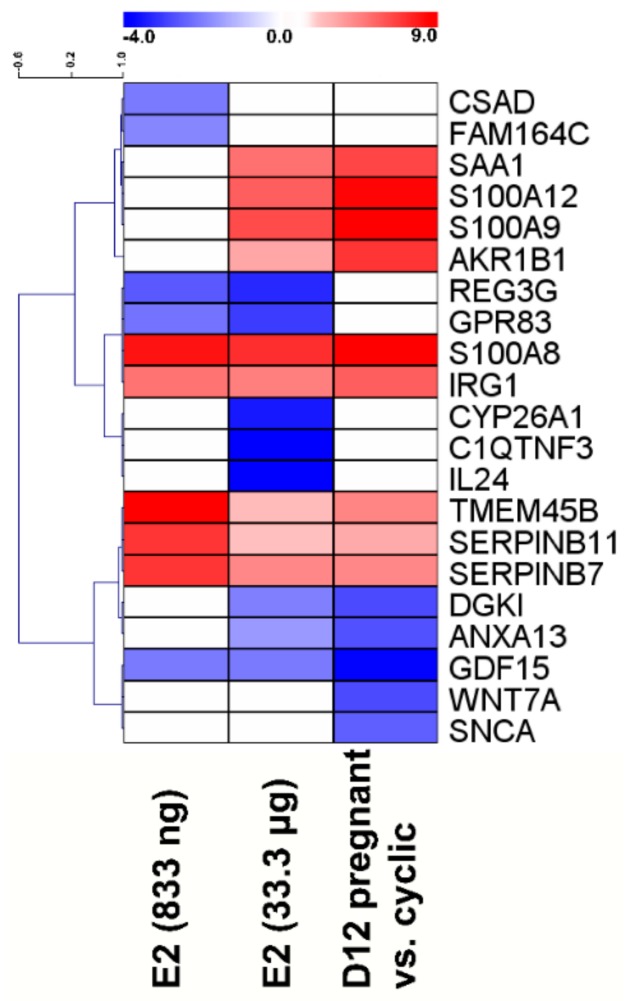
Estradiol-17β (E2) is a key hormone regulating reproductive functions in females. In pigs, E2, as the main conceptus signal, initiates processes resulting in prolonged corpus luteum function, embryo development, and implantation. During early pregnancy the endometrium undergoes morphological and physiological transitions that are tightly related to transcriptome changes. Recently, however, the importance of E2 as a primary conceptus signal in the pig has been questionable. Thus, the aim of the present study was to determine the effects of E2 on the porcine endometrial transcriptome in vivo and to compare these effects with transcriptome profiles on day 12 of pregnancy. Microarray analysis revealed differentially expressed genes (DEGs) in response to E2 with overrepresented functional terms related to secretive functions, extracellular vesicles, cell adhesion, proliferation and differentiation, tissue rearrangements, immune response, lipid metabolism, and many others. Numerous common DEGs and processes for the endometrium on day 12 of pregnancy and E2-treated endometrium were identified. In summary, the present study is the first evidence for the effect of E2 on transcriptome profiles in porcine endometrium in vivo in the period corresponding to the maternal recognition of pregnancy. The presented results provide a valuable resource for further targeted studies considering genes and pathways regulated by conceptus-derived estrogens and their role in pregnancy establishment.

Keywords: Sus scrofa; early pregnancy; endometrium; estradiol-17β; pig; transcriptome profiling.


Conflict of interest statement

The authors declare no conflict of interest. The funders had no role in the design of the study; in the collection, analyses, or interpretation of data; in the writing of the manuscript; or in the decision to publish the results.

Figures

Figure 1
Figure 1
Heatmap of the log2 fold changes (estradiol-17β (E2)-treated endometrium vs. placebo-treated endometrium; day 12 pregnant-cyclic) of the top 10 differentially expressed genes of each gene expression comparison. The scale is from log2 fold change -4 (blue, down-regulated in E2-treated/pregnant samples) to 9 (red, up-regulated in E2-treated/pregnant samples). Each row represents one gene, and each column represents a comparison (E2-treated vs placebo or pregnant vs. cyclic).
Figure 2
Figure 2
Comparison of transcriptome changes detected in endometrial samples collected from gilts on day 12 of the estrous cycle and pregnancy with the effect of intrauterine estradiol-17β administration (A: 833 ng of E2/infusion; B: 33.3 μg of E2/infusion). Data are shown as a heatmap of hierarchical clustering (Pearson correlation) of the normalized values of the intensity of the expression signals of probes detected as significantly changed (log fold change > 0.585; p nominal < 0.05 false discovery rate (FDR) = 5%) in analyzed groups. Cyclic-endometrial samples collected on day 12 of the estrous cycle, pregnant-endometrial samples collected on day 12 of pregnancy, control-endometrial samples collected from gilts assigned to control groups (infusions of placebo to both uterine horns), EX_H-endometrial samples collected from gilts assigned to the experimental group (uterine horns receiving E2 infusions), EX_C-endometrial samples collected from gilts assigned to experimental group (uterine horns receiving placebo infusion).
Figure 3
Figure 3
Venn diagrams of common, and group-specific up- (A) and down-regulated (B) genes. D12 pregnancy–endometrial samples collected on day 12 of pregnancy, E2 (833 ng/infusion) endometrial samples collected from uterine horns receiving 833 ng of E2/infusion, E2 (33.3 μg/infusion)—endometrial samples collected from uterine horns receiving 33.3 μg of E2/infusion. Complete lists of common and group-specific DEGs are presented in Supplementary Table S7.
Figure 4
Figure 4
A functional map showing shared and group-specific functional annotation terms generated in multi-cluster gene functional enrichment analysis for differentially expressed genes (DEGs) identified in porcine endometrial samples collected on day 12 of pregnancy and treated with E2 (833 ng or 33.3 μg/infusion). Analysis was performed in ToppCluster software, the functional map was edited and adjusted using Cytoscape. The redundant and noninformative terms were removed. The complete results are presented in a tabular format in Supplementary Table S8.
Figure 5
Figure 5
Comparison analysis of canonical pathways (A), diseases and bio functions (B) and upstream regulators enriched by DEGs identified in estradiol-17β-treated (833 ng and 33.3 μg/infusion) and day 12 of pregnancy endometrial samples. A Z-score value higher than 2 means that the enriched pathway (A) or enriched function (B) is significantly activated or stimulated, or the upstream regulator stimulates the set of identified DEGs (C). A Z-score value lower than 2 means that the enriched pathway (A) or enriched function (B) is significantly inhibited or suppressed, or the upstream regulator suppresses the set of identified DEGs (C). Grey color indicates there is no data allowing for activation/suppression or stimulation/inhibition prediction of the enriched term.
Figure 6
Figure 6
Expression of selected target genes determined by real-time RT-PCR in porcine endometrial samples treated with a placebo (control) or E2 (833 ng and 33.333.3 μg/infusion) and on day 12 of the estrous cycle (D12 Cyclic) and pregnancy (D12 Pregnant). Data are presented as the mean ± SEM. The expression of genes was normalized against the geometrical mean of RPL13A and GAPDH expression values. Different letters indicate statistically significant differences (two-way ANOVA, followed by the Bonferroni post-test; p < 0.05) in the local-indirect effect of E2 on gene expression. Asterisks (* p < 0.05; ** p < 0.01; *** p < 0.001; **** p < 0.0001) indicate the significant differences within the direct local effect of the E2 on gene expression. (A) ATP binding cassette subfamily C member 4 (ABCC4); (B) acyl-CoA synthase long-chain family member 4 (ACSL4); (C) ADAM metallopeptidase domain 9 (ADAM9); (D) ADAM metallopeptidase with thrombospondin type 1 motif 20 (ADAMTS20); (E) Bradykinin Receptor B2 (B2R); (F) caspase 3 (CASP3); (G) CCAAT/enhancer binding protein beta (CEBPB); (H) claudin 1 (CLDN1); (I) deleted in malignant brain tumors 1 (DMBT1); (J) growth differentiation factor 15 (GDF15); (K) heparin binding EGF like growth factor (HBEGF); (L) interleukin 1 beta (IL1B); (M) kelch like family member 14 (KLHL14); (N) lysophosphatidic acid receptor 3 (LPAR3); (O) mucin 4, cell surface associated (MUC4); (P) serpin family B member 7 (SERPINB7); (Q) SMAD family member 3 (SMAD3); (R) STEAP family member 1 (STEAP1); (S) transient receptor potential cation channel subfamily V member 6 (TRPV6); (T) Wnt family member 5A (WNT5A); and (U) Wnt family member 7A (WNT7A).
Figure 6
Figure 6
Expression of selected target genes determined by real-time RT-PCR in porcine endometrial samples treated with a placebo (control) or E2 (833 ng and 33.333.3 μg/infusion) and on day 12 of the estrous cycle (D12 Cyclic) and pregnancy (D12 Pregnant). Data are presented as the mean ± SEM. The expression of genes was normalized against the geometrical mean of RPL13A and GAPDH expression values. Different letters indicate statistically significant differences (two-way ANOVA, followed by the Bonferroni post-test; p < 0.05) in the local-indirect effect of E2 on gene expression. Asterisks (* p < 0.05; ** p < 0.01; *** p < 0.001; **** p < 0.0001) indicate the significant differences within the direct local effect of the E2 on gene expression. (A) ATP binding cassette subfamily C member 4 (ABCC4); (B) acyl-CoA synthase long-chain family member 4 (ACSL4); (C) ADAM metallopeptidase domain 9 (ADAM9); (D) ADAM metallopeptidase with thrombospondin type 1 motif 20 (ADAMTS20); (E) Bradykinin Receptor B2 (B2R); (F) caspase 3 (CASP3); (G) CCAAT/enhancer binding protein beta (CEBPB); (H) claudin 1 (CLDN1); (I) deleted in malignant brain tumors 1 (DMBT1); (J) growth differentiation factor 15 (GDF15); (K) heparin binding EGF like growth factor (HBEGF); (L) interleukin 1 beta (IL1B); (M) kelch like family member 14 (KLHL14); (N) lysophosphatidic acid receptor 3 (LPAR3); (O) mucin 4, cell surface associated (MUC4); (P) serpin family B member 7 (SERPINB7); (Q) SMAD family member 3 (SMAD3); (R) STEAP family member 1 (STEAP1); (S) transient receptor potential cation channel subfamily V member 6 (TRPV6); (T) Wnt family member 5A (WNT5A); and (U) Wnt family member 7A (WNT7A).
Figure 7
Figure 7
Concentration of prostaglandin E2 (PGE2) (A) and PGF2α metabolite (PGFM) (B) in the conditioned media form endometrial explants collected from gilts treated with a placebo (control) or E2 (833 ng and 33.3 μg/infusion) in vivo. Data are presented as the mean ± SEM. Different letters indicate statistically significant differences (two-way ANOVA, followed by Bonferroni post-test; p < 0.05) in concentration of PGE2 or PGFM in culture media. Asterisks * p < 0.05; ** p < 0.01; *** p < 0.001; **** p < 0.0001) indicate the significant differences within the direct local effect of the E2 on PGE2 or PGFM secretion by endometrial explants.

Similar articles

Cited by

References

    1. Pope W.F., First N.L. Factors affecting the survival of pig embryos. Theriogenology. 1985;23:91–105. doi: 10.1016/0093-691X(85)90075-5. - DOI
    1. Waclawik A., Kaczmarek M.M., Blitek A., Kaczynski P., Ziecik A.J. Embryo-maternal dialogue during pregnancy establishment and implantation in the pig. Mol. Reprod. Dev. 2017;84:842–855. doi: 10.1002/mrd.22835. - DOI - PubMed
    1. Groothuis P.G., Dassen H.H., Romano A., Punyadeera C. Estrogen and the endometrium: Lessons learned from gene expression profiling in rodents and human. Hum. Reprod. Update. 2007;13:405–417. doi: 10.1093/humupd/dmm009. - DOI - PubMed
    1. Waclawik A. Novel insights into the mechanisms of pregnancy establishment: Regulation of prostaglandin synthesis and signaling in the pig. Reproduction. 2011;142:389–399. doi: 10.1530/REP-11-0033. - DOI - PubMed
    1. Bazer F.W., Thatcher W.W. Theory of maternal recognition of pregnancy in swine based on estrogen controlled endocrine versus exocrine secretion of prostaglandin F2α by the uterine endometrium. Prostaglandins. 1977;14:397–400. doi: 10.1016/0090-6980(77)90185-X. - DOI - PubMed

LinkOut - more resources