

Identification of Cancer Stem Cell Subpopulations in Head and Neck Metastatic Malignant Melanoma
- PMID: 32019273
- PMCID: PMC7072148
- DOI: 10.3390/cells9020324
Identification of Cancer Stem Cell Subpopulations in Head and Neck Metastatic Malignant Melanoma
Abstract
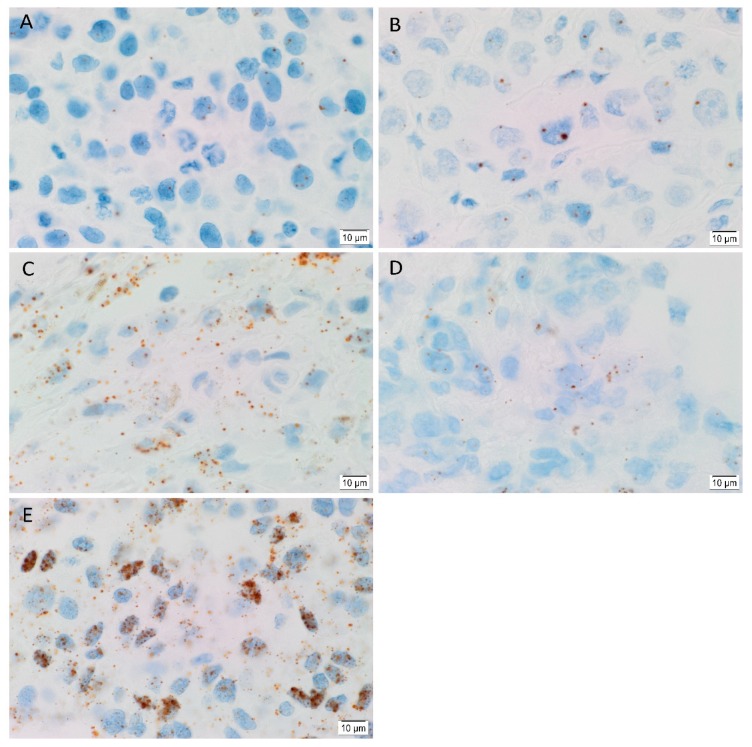
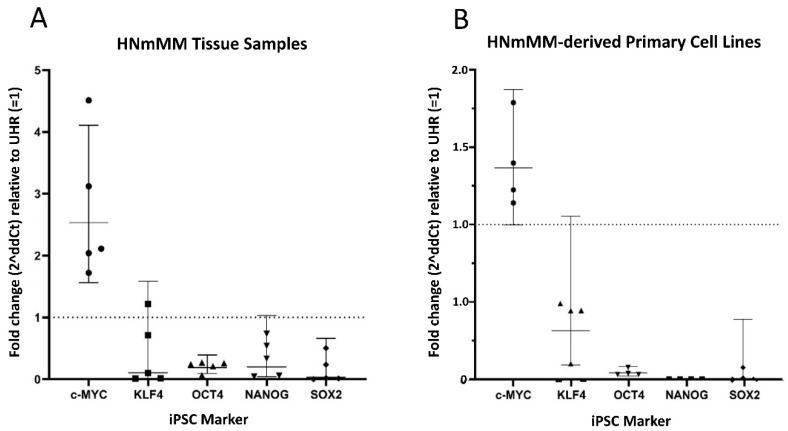
Cancer stem cells (CSCs) have been identified in many cancer types. This study identified and characterized CSCs in head and neck metastatic malignant melanoma (HNmMM) to regional lymph nodes using induced pluripotent stem cell (iPSC) markers. Immunohistochemical (IHC) staining performed on 20 HNmMM tissue samples demonstrated expression of iPSC markers OCT4, SOX2, KLF4, and c-MYC in all samples, while NANOG was expressed at low levels in two samples. Immunofluorescence (IF) staining demonstrated an OCT4+/SOX2+/KLF4+/c-MYC+ CSC subpopulation within the tumor nests (TNs) and another within the peritumoral stroma (PTS) of HNmMM tissues. IF also showed expression of NANOG by some OCT4+/SOX2+/KLF4+/c-MYC+ cells within the TNs in an HNmMM tissue sample that expressed NANOG on IHC staining. In situ hybridization (n = 6) and reverse-transcription quantitative polymerase chain reaction (n = 5) on the HNmMM samples confirmed expression of all five iPSC markers. Western blotting of primary cell lines derived from four of the 20 HNmMM tissue samples showed expression of SOX2, KLF4, and c-MYC but not OCT4 and NANOG, and three of these cell lines formed tumorspheres in vitro. We demonstrate the presence of two putative CSC subpopulations within HNmMM, which may be a novel therapeutic target in the treatment of this aggressive cancer.
Keywords: cancer stem cell; head and neck cancer; induced pluripotent stem cell; malignant melanoma; melanoma metastasis.
Conflict of interest statement
The authors declare that the research was conducted in the absence of any commercial or financial relationships that could be construed as a potential conflict of interest. T.I., P.F.D., and S.T.T. are inventors of the patent Cancer Diagnosis and Therapy (United States Patent No. 10281472), provisional patents Cancer Diagnosis and Therapy (PCT/NZ2015/050108), and Cancer Therapeutic (PCT/NZ2018/050006), provisional patent application Novel Pharmaceutical Compositions for Cancer Therapy (US/62/711709).
Figures


Similar articles
-
Cancer Stem Cell Subpopulations Are Present Within Metastatic Head and Neck Cutaneous Squamous Cell Carcinoma.Front Oncol. 2020 Jul 30;10:1091. doi: 10.3389/fonc.2020.01091. eCollection 2020. Front Oncol. 2020. PMID: 32850316 Free PMC article.
-
Cancer stem cell subpopulations in moderately differentiated head and neck cutaneous squamous cell carcinoma.Heliyon. 2019 Aug 16;5(8):e02257. doi: 10.1016/j.heliyon.2019.e02257. eCollection 2019 Aug. Heliyon. 2019. PMID: 31463389 Free PMC article.
-
Cancer Stem Cells in Head and Neck Metastatic Malignant Melanoma Express Components of the Renin-Angiotensin System.Life (Basel). 2020 Nov 2;10(11):268. doi: 10.3390/life10110268. Life (Basel). 2020. PMID: 33147716 Free PMC article.
-
Crosstalks between Raf-kinase inhibitor protein and cancer stem cell transcription factors (Oct4, KLF4, Sox2, Nanog).Tumour Biol. 2017 Apr;39(4):1010428317692253. doi: 10.1177/1010428317692253. Tumour Biol. 2017. PMID: 28378634 Review.
-
Activation of Matrix Hyaluronan-Mediated CD44 Signaling, Epigenetic Regulation and Chemoresistance in Head and Neck Cancer Stem Cells.Int J Mol Sci. 2017 Aug 24;18(9):1849. doi: 10.3390/ijms18091849. Int J Mol Sci. 2017. PMID: 28837080 Free PMC article. Review.
Cited by
-
Cancer Stem Cells in Metastatic Head and Neck Cutaneous Squamous Cell Carcinoma Express Components of the Renin-Angiotensin System.Cells. 2021 Jan 27;10(2):243. doi: 10.3390/cells10020243. Cells. 2021. PMID: 33513805 Free PMC article.
-
Cathepsins B, D, and G Are Expressed in Metastatic Head and Neck Cutaneous Squamous Cell Carcinoma.Front Oncol. 2021 Sep 21;11:690460. doi: 10.3389/fonc.2021.690460. eCollection 2021. Front Oncol. 2021. PMID: 34621666 Free PMC article.
-
Cancer Stem Cells in Melanoma: Drivers of Tumor Plasticity and Emerging Therapeutic Strategies.Int J Mol Sci. 2025 Aug 1;26(15):7419. doi: 10.3390/ijms26157419. Int J Mol Sci. 2025. PMID: 40806546 Free PMC article. Review.
-
Cancer Metastasis and Treatment Resistance: Mechanistic Insights and Therapeutic Targeting of Cancer Stem Cells and the Tumor Microenvironment.Biomedicines. 2022 Nov 21;10(11):2988. doi: 10.3390/biomedicines10112988. Biomedicines. 2022. PMID: 36428556 Free PMC article. Review.
-
The Role of Genetic Pathways in the Development of Chemoradiation Resistance in Nasopharyngeal Carcinoma (NPC) Patients.Genes (Basel). 2021 Nov 21;12(11):1835. doi: 10.3390/genes12111835. Genes (Basel). 2021. PMID: 34828441 Free PMC article. Review.
References
-
- American Cancer Society: Atlanta, 2018 Cancer Facts & Figures. [(accessed on 9 January 2019)];2018 Available online: https://www.cancer.org/content/dam/cancer-org/research/cancer-facts-and-....
-
- The Cancer Council Australia and Australian Cancer Network, Sydney and New Zealand Guidelines Group: Wellington Clinical Practice Guidelines for the Management of Melanoma in Australia and New Zealand. [(accessed on 9 January 2019)];2008 Available online: https://www.health.govt.nz/system/files/documents/publications/melanoma-....
-
- Douglas R.G., Shaw J.H. Melanoma of the head and neck in Auckland. N. Z. Med. J. 1987;100:584–587. - PubMed
MeSH terms
Substances
LinkOut - more resources
Full Text Sources
Medical
Research Materials
Miscellaneous
