. 2021 Feb;17(2):529-552.
doi: 10.1080/15548627.2020.1725381. Epub 2020 Feb 16.

Autophagy-based unconventional secretion of HMGB1 by keratinocytes plays a pivotal role in psoriatic skin inflammation

Affiliations

Autophagy-based unconventional secretion of HMGB1 by keratinocytes plays a pivotal role in psoriatic skin inflammation

Zhen Wang et al. Autophagy. 2021 Feb.

Abstract

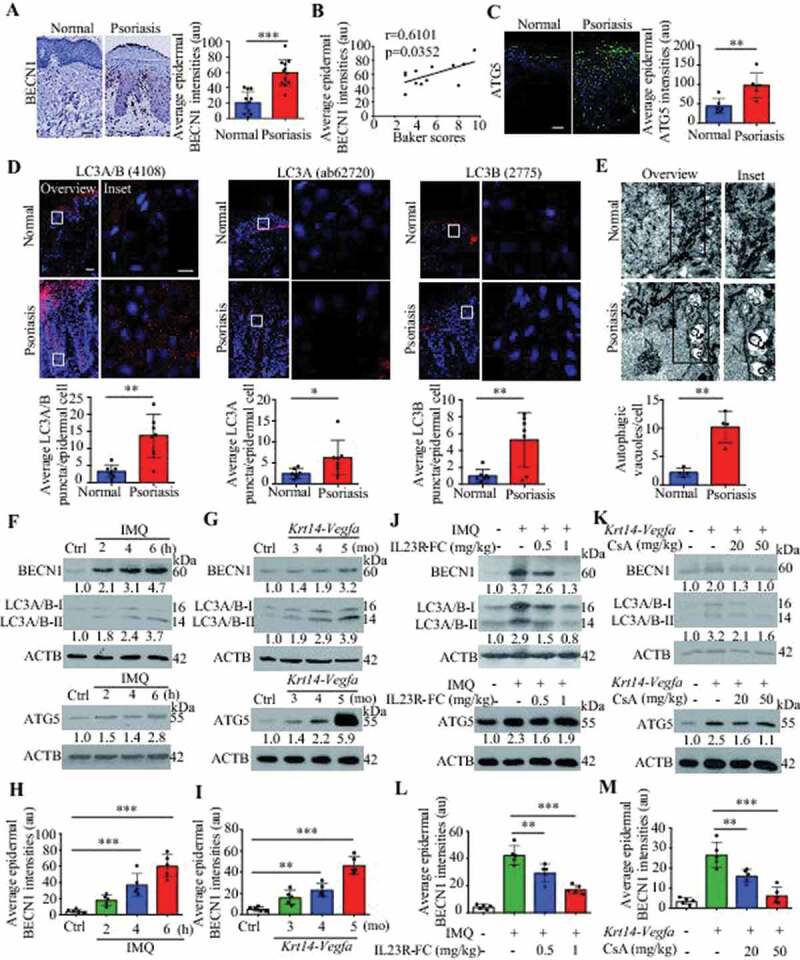
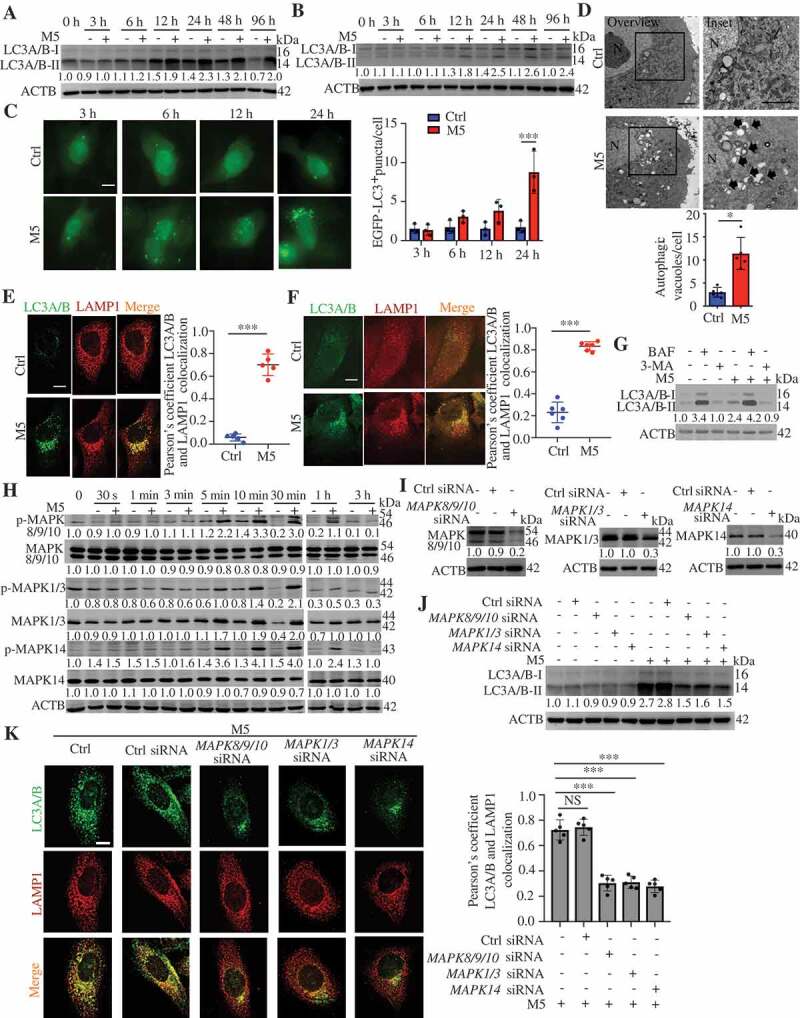
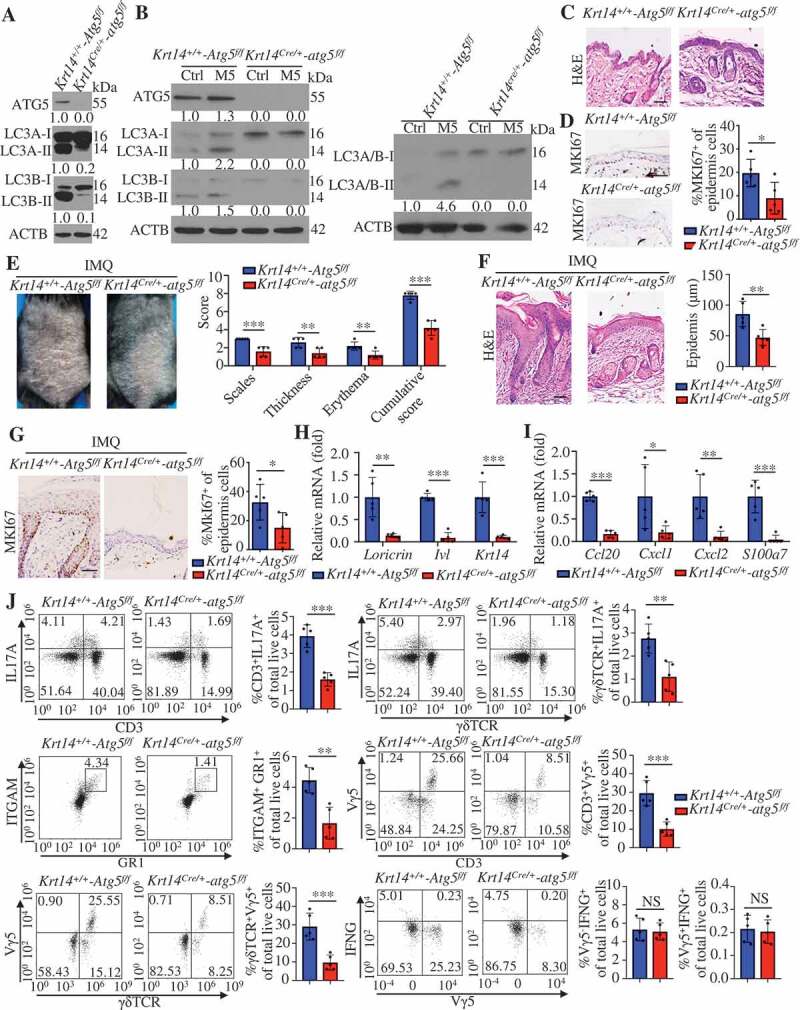
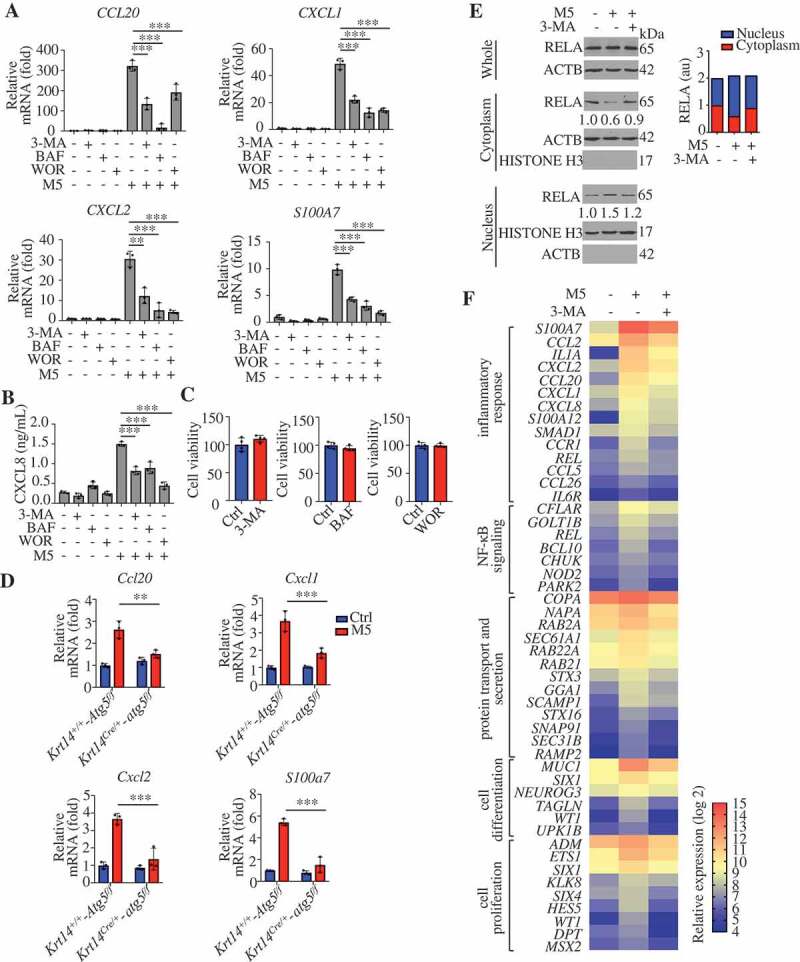
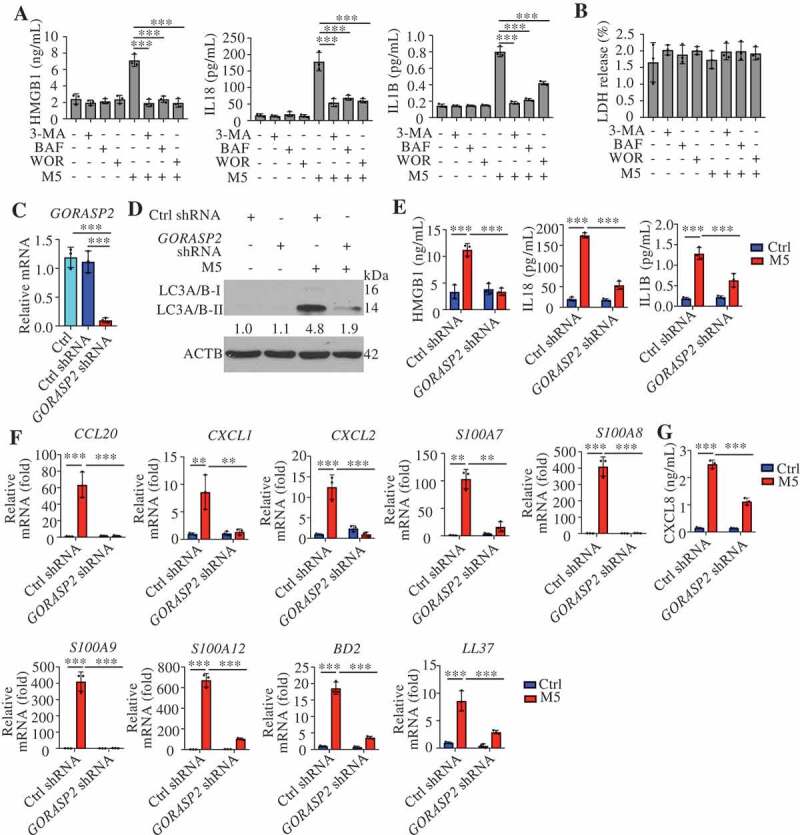
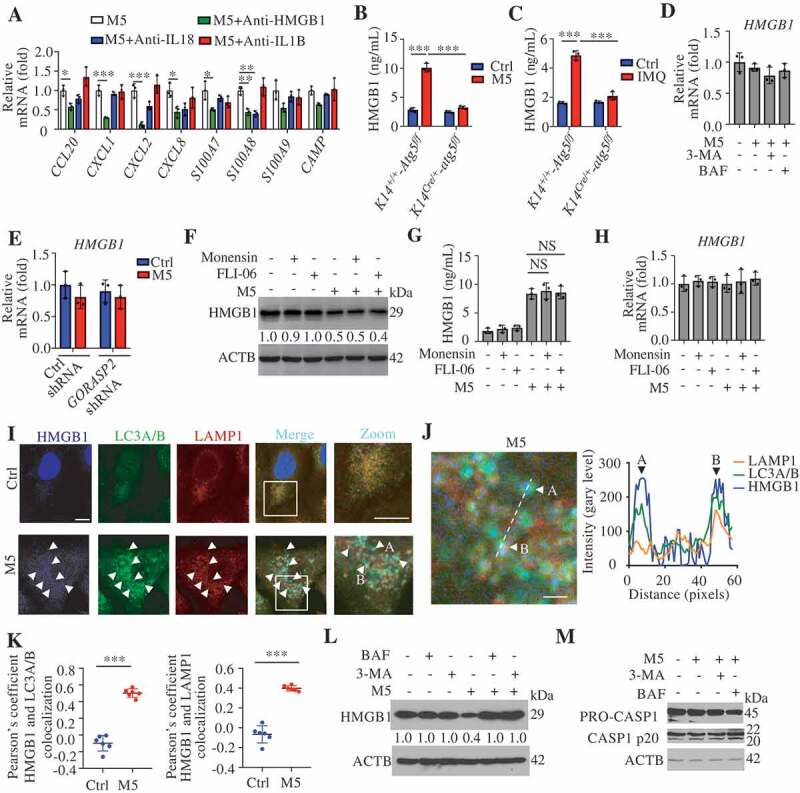
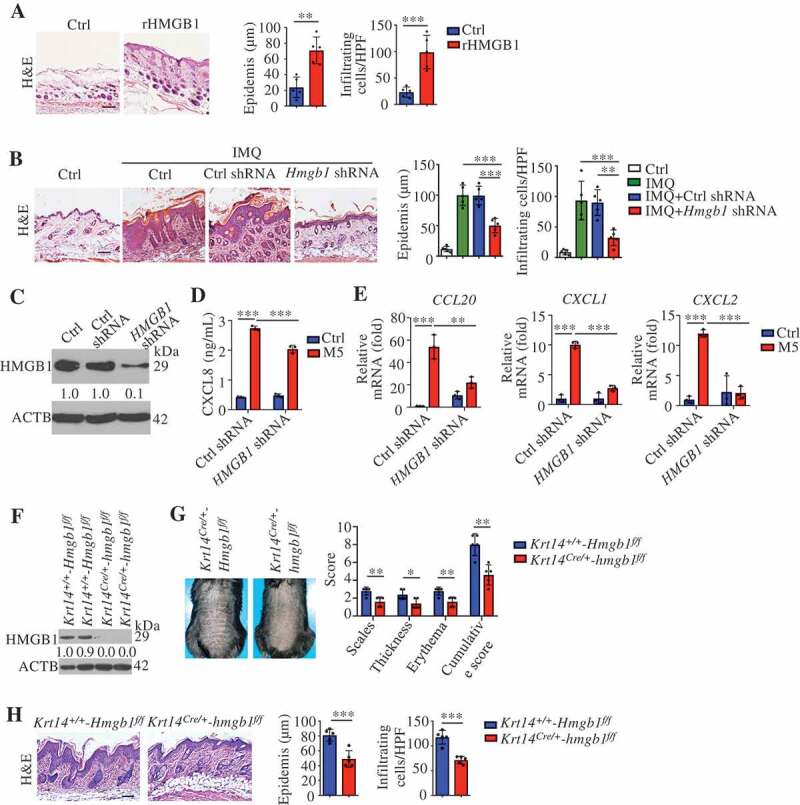
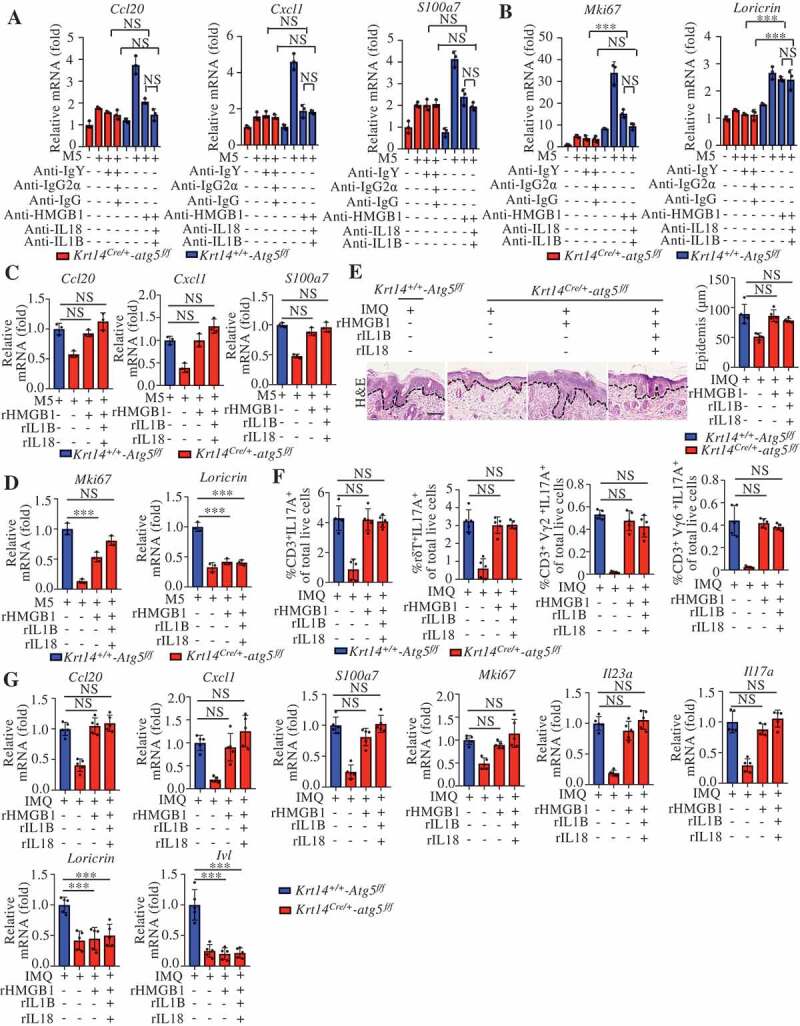
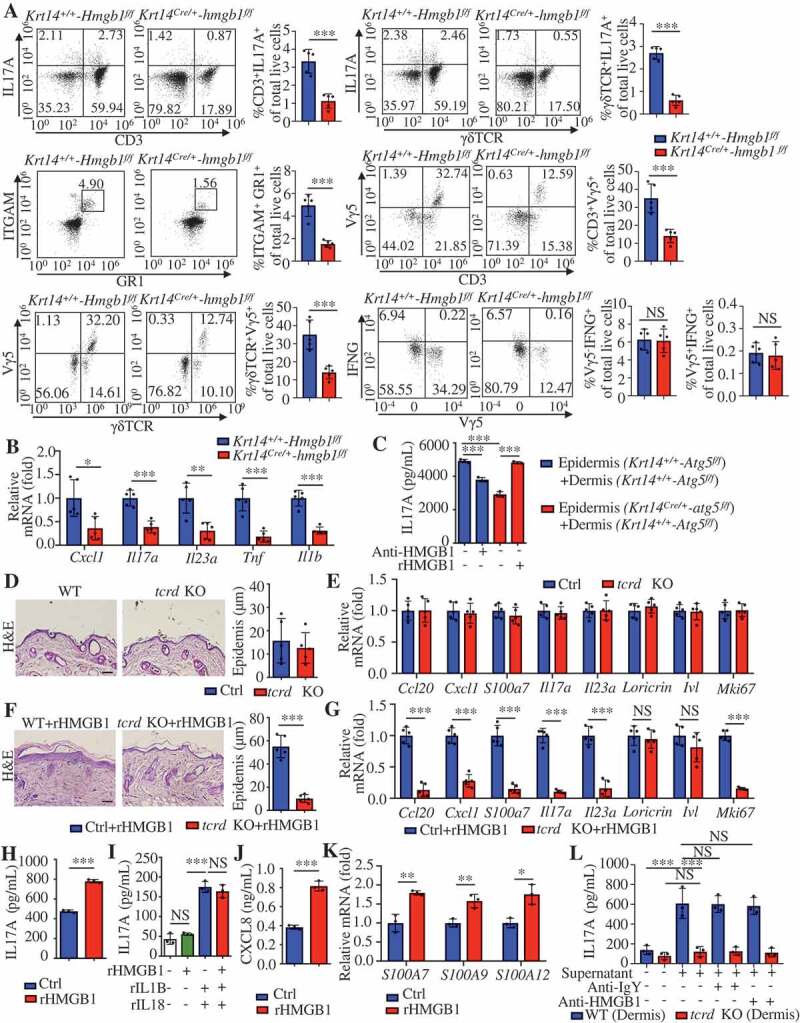
The precise mechanism through which macroautophagy/autophagy affects psoriasis is poorly understood. Here, we found that keratinocyte (KC) autophagy, which was positively correlated with psoriatic severity in patients and mouse models and could be inhibited by mitogen-activated protein kinase (MAPK) family inactivation. The impairment of autophagic flux alleviated psoriasisform inflammation. We also found that an autophagy-based unconventional secretory pathway (autosecretion) dependent on ATG5 (autophagy related 5) and GORASP2 (golgi reassembly stacking protein 2) promoted psoriasiform KC inflammation. Moreover, the alarmin HMGB1 (high mobility group box 1) was more effective than other autosecretory proteins in regulating psoriasiform cutaneous inflammation. HMGB1 neutralization in autophagy-efficient KCs eliminated the differences in psoriasiform inflammation between Krt14+/+-Atg5f/f KCs and Krt14Cre/+-atg5f/f KCs, and conversely, recombinant HMGB1 almost completely restored psoriasiform inflammation in Krt14Cre/+-atg5f/f KCs in vivo. These results suggest that HMGB1-associated autosecretion plays a pivotal role in cutaneous inflammation. Finally, we demonstrated that Krt14Cre/+-hmgb1f/f mice displayed attenuated psoriatic inflammation due to the essential crosstalk between KC-specific HMGB1-associated autosecretion and γδT cells. Thus, this study uncovered a novel autophagy mechanism in psoriasis pathogenesis, and the findings imply the clinical significance of investigating and treating psoriasis.Abbreviations: 3-MA: 3-methyladenine; ACTB: actin beta; AGER: advanced glycosylation end-product specific receptor; Anti-HMGB1: anti-HMGB1 neutralizing antibody; Anti-IL18: anti-IL18 neutralizing antibody; Anti-IL1B: anti-IL1B neutralizing antibody; ATG5: autophagy related 5; BAF: bafilomycin A1; BECN1: beclin 1; CASP1: caspase 1; CCL: C-C motif chemokine ligand; CsA: cyclosporine A; ctrl shRNA: lentivirus harboring shRNA against control; CXCL: C-X-C motif chemokine ligand; DCs: dendritic cells; DMEM: dulbecco's modified Eagle's medium; ELISA: enzyme-linked immunosorbent assay; EM: electron microscopy; FBS: fetal bovine serum; GORASP2 shRNA: lentivirus harboring shRNA against GORASP2; GORASP2/GRASP55: golgi reassembly stacking protein 2; GR1: a composite epitope between LY6 (lymphocyte antigen 6 complex) locus C1 and LY6 locus G6D antigens; H&E: hematoxylin and eosin; HMGB1: high mobility group box 1; HMGB1 shRNA: lentivirus harboring shRNA against HMGB1; IFNG/IFN-γ: interferon gamma; IL17A: interleukin 17A; IL18: interleukin 18; IL1A/IL-1α: interleukin 1 alpha; IL1B/IL-1β: interleukin 1 beta; IL22/IL-22: interleukin 22; IL23A: interleukin 23 subunit alpha; IL23R: interleukin 23 receptor; IMQ: imiquimod; ITGAM/CD11B: integrin subunit alpha M; ITGAX/CD11C: integrin subunit alpha X; IVL: involucrin; KC: keratinocyte; KD: knockdown; KO: knockout; Krt14+/+-Atg5f/f mice: mice bearing an Atg5 flox allele, in which exon 3 of the Atg5 gene is flanked by two loxP sites; Krt14+/+-Hmgb1f/f: mice bearing an Hmgb1 flox allele, in which exon 2 to 4 of the Hmgb1 gene is flanked by two loxP sites; Krt14Cre/+-atg5f/f mice: keratinocyte-specific atg5 knockout mice generated by mating Atg5-floxed mice with mice expressing Cre recombinase under the control of the promoter of Krt4; Krt14Cre/+-hmgb1f/f mice: keratinocyte-specific hmgb1 knockout mice generated by mating Hmgb1-floxed mice with mice expressing Cre recombinase under the control of the promoter of Krt14; Krt14-Vegfa mice: mice expressing 164-amino acid Vegfa splice variant recombinase under the control of promoter of Krt14; LAMP1: lysosomal associated membrane protein 1; LDH: lactate dehydrogenase; LORICRIN: loricrin cornified envelope precursor protein; M5: TNF, IL1A, IL17A, IL22 and OSM in combination; MAP1LC3/LC3: microtubule associated protein 1 light chain 3; MAPK: mitogen-activated protein kinase; MKI67: marker of proliferation Ki-67; MTT: thiazolyl blue tetrazolium bromide; NFKB/NF-κB: nuclear factor kappa B; NHEKs: primary normal human epidermal keratinocytes; NS: not significant; OSM: oncostatin M; PASI: psoriasis area and severity index; PtdIns3K: class III phosphatidylinositol 3-kinase; qRT-PCR: quantitative RT-PCR; RELA/p65: RELA proto-oncogene, NF-kB subunit; rHMGB1: recombinant HMGB1; rIL18: recombinant interleukin 18; rIL1B: recombinant interleukin 1 beta; S100A: S100 calcium binding protein A; SQSTM1/p62: sequestosome 1; T17: IL17A-producing T; TCR: T-cell receptor; tcrd KO mice: tcrd (T cell receptor delta chain) knockout mice, which show deficient receptor expression in all adult lymphoid and epithelial organs; TLR: toll-like receptor; TNF/TNF-α: tumor necrosis factor; WOR: wortmannin; WT: wild-type; γδT17 cells: IL17A-producing γδ T cells.

Keywords: Alarmin; autophagy; keratinocytes; psoriasis; secretion.


Conflict of interest statement

No potential conflict of interest was reported by the authors.

Figures

Figure 1.
Figure 1.
Autophagy-related proteins are functionally active in psoriatic keratinocytes. (A) Expression of the autophagy marker BECN1 in the epidermis of psoriatic patients and normal subjects. Representative immunostaining images of skin (left) and quantification of staining intensity in the epidermis (right). Scale bar: 50 μm. n = 12/group. (B) A significant correlation was found between the average epidermal BECN1 intensities in (A) and the Baker scores of psoriatic lesions (r and p values obtained with Spearman’s rank correlation test). (C and D) Expression of the indicated autophagy markers in the epidermis of psoriatic patients and normal subjects. (C) Representative ATG5 immunostaining images (left) and quantification of staining intensity in the epidermis (right), scale bar: 50 μm, n = 6/group. (D) Representative immunofluorescence of LC3 immunostaining images (top) and quantification of LC3 puncta in the epidermis (bottom, more than 200 epidermal cells were counted each specimen), scale bar: overviews (50 μm) and insets (10 μm), n = 7/group. (E) Representative electron microscopic images of keratinocytes of lesional psoriatic skin and healthy skin (top) and quantification of autophagic vacuoles (bottom), more than 10 cells were counted from each specimen. Black arrow, autophagic vacuoles; N, nucleus. Scale bar: 1 µm. (F-I) Expression of autophagy markers in the back skin of the IMQ mouse model (F and H) and the ear skin of the Krt14-Vegfa transgenic mouse model (G and I) at the indicated time points (d: day; mo: month), n = 5/group. (F and G) Representative immunoblots of indicated proteins from skin lysates. (H and I) Quantification of immunohistochemical staining intensity of BECN1 in the epidermis. (J-M) Skin autophagy was detected in an IMQ-induced psoriasis mouse model (J and L) and a Krt14-Vegfa transgenic mouse model of psoriasis (K and M) after treatment with therapeutic, recombinant IL23R-FC (0.5 or 1 mg/kg) or cyclosporin A (CsA; 20 or 50 mg/kg), n = 5/group. (J and K) Representative immunoblots of BECN1, LC3A/B-II and ATG5 from skin lysates. (L and M) Quantification of immunohistochemical staining intensity of BECN1 in the epidermis. ACTB was detected as a loading control in (F, G, J and K). Mean ± SD. *P < 0.05; **P < 0.01; ***P < 0.001. Two-tailed Student’s T-test (A and C-E). One-way ANOVA (H, I, L and M). All the data are representative of three independent experiments
Figure 2.
Figure 2.
The activation of MAPK signaling pathways is involved in autophagy in psoriasiform keratinocytes. (A and B) Representative LC3A/B-II immunoblots from HaCaT cells (A) and NHEK cells (B) stimulated with or without M5 for the indicated times. (C) EGFP-LC3-transfected HaCaT cells were stimulated with or without M5 for the indicated times, n = 3/group. Representative fluorescence images (left) and quantification of EGFP-LC3 puncta in keratinocytes (right, more than 50 cells were counted each condition). Scale bar: 10 μm. (D) Representative electron microscopic images of NHEKs treated with or without M5 for 48 h (top). Black arrow, autophagic vacuoles; N, nucleus; scale bar: 2 μm. Quantification of autophagic vacuoles (bottom, more than 20 cells were counted for each condition), n = 5/group. (E and F) Representative images of LC3A/B and lysosomal marker LAMP1 immunostaining in HaCaT cells (E) and NHEK cells (F) stimulated with or without M5 (left). Scale bar: 10 μm. Pearson’s colocalization coefficient for LC3A/B and LAMP1 (right), n = 5-6/group. (G) NHEKs were pre-treated with or without 3-methyladenine (3-MA; 4 h, 10 mM), bafilomycin A1 (BAF; 4 h, 200 nM) or wortmannin (WOR; 4 h, 100 nM), and then stimulated with or without M5 for 48 h. Immunoblot analysis of the LC3A/B-II levels. (H) Representative immunoblots of MAPK proteins in HaCaT cells stimulated with or without M5 in a time-dependent manner. (I) Representative immunoblots of MAPKs (MAPK8/9/10, MAPK1/3 and MAPK14) for HaCaT cells that were transiently transfected with MAPKs (MAPK8/9/10, MAPK1/3 and MAPK14) siRNA or control siRNA for 48 h. (J and K) HaCaT cells were transiently transfected with MAPKs (MAPK8/9/10, MAPK1/3 and MAPK14) siRNA or control siRNA for 48 h, and were then treated with M5 for 48 h. Representative LC3A/B-II immunoblots (J) and representative images of LC3A/B and lysosomal marker LAMP1 immunostaining (K, left), scale bar: 10 μm. Pearson’s colocalization coefficient for LC3A/B and LAMP1 (K, right), n = 5/group. ACTB was detected as a loading control (A, B and G-J). Mean ± SD. **P < 0.01; ***P < 0.001. Two-tailed Student’s T-test (C-F). One-way ANOVA (K). All the data are representative of three independent experiments
Figure 3.
Figure 3.
Keratinocyte-specific ablation of autophagy caused resistance to IMQ-induced psoriasis. (A) Representative immunoblots of the indicated autophagy markers from epidermal lysates of Krt14+/+-Atg5f/f and Krt14Cre/+-atg5f/f mice. (B) Representative western blots for the indicated autophagy markers in Krt14+/+-Atg5f/f and Krt14Cre/+-atg5f/f primary murine keratinocytes stimulated with or without M5 for 48 h. (C) Representative images of the dorsal back from Krt14+/+-Atg5f/f and Krt14Cre/+-atg5f/f mice stained with H&E. Scale bars: 50 μm. n = 5/group. (D) Representative MKI67 immunohistochemistry of the back skin (left), scale bars: 50 μm. MKI67-positive cells were quantified by counting the stained dots (right). n = 5/group. (E-J) The Krt14+/+-Atg5f/f and Krt14Cre/+-atg5f/f mice were treated with IMQ for 5 d, n = 5/group. (E) Representative images of the dorsal back from mice (left) and mice PASI scores were depicted (right). (F) Representative histological sections of the dorsal back from mice stained with H&E (left), and quantification of the epidermal thickness based on epidermal thickness measurements (right), scale bars: 50 μm. Representative immunohistochemistry images of MKI67 in the dorsal back of mice, scale bars: 50 μm (left). (G) Quantification of MKI67-positive cells in the epidermis of the dorsal back (right). (H and I) qRT-PCR analysis of indicated genes from the dorsal skin RNA of mice. (J) Representative and quantification of intracellular FACS analysis of IL17-producing cells, neutrophils cells, Vγ5+ cells and IFNG+ cells in dorsal skin. ACTB was detected as a loading control (A and B). Mean ± SD. *P < 0.05; **P < 0.01; ***P < 0.001. Two-tailed Student’s T-test (D-J). All the data are representative of three independent experiments
Figure 4.
Figure 4.
Autophagic flux regulates the features of psoriasiform keratinocytes. (A and B) NHEKs were pre-treated with or without 3-methyladenine (3-MA; 4 h, 10 mM), bafilomycin A1 (BAF; 4 h, 200 nM) or wortmannin (WOR; 4 h, 100 nM), and stimulated with or without M5 for 24 h or 48 h, n = 3/group. (A) The RNA levels of the indicated genes were assessed by qRT-PCR at 24 h. (B) ELISA assessed the levels of CXCL8 in the culture medium at 48 h. (C) Treatment with 3-MA (4 h, 10 mM), BAF (4 h, 200 nM) or WOR (4 h, 100 nM) for 72 h did not induce cell death in NHEKs by MTT assay. n = 4/group. (D) Validation of the mRNA expression of the indicated genes by qRT-PCR in both Krt14+/+-Atg5f/f and Krt14Cre/+-atg5f/f primary murine keratinocytes stimulated with or without M5 for 24 h. n = 3/group. (E) HaCaT cells were pretreated with 3-MA (4 h, 10 mM) and stimulated with M5. Representative western blots of RELA in cytoplasmic and nuclear fractions at 48 h (left), and the nuclear/cytosolic RELA intensity ratios (right) are shown. n = 3/group. ACTB served as a loading control for total proteins or cytoplasmic proteins, and HISTONE H3 served as a loading control for nuclear proteins. (F) HaCaT cells were pretreated with or without 3-MA (4 h, 10 mM), stimulated with M5 for 24 h and subjected to whole transcriptome gene expression analysis (criteria: fold-change>1.5, P < 0.01, and false discovery rate adjusted for multiple testing). Functional annotation analysis of the overlapping genes among the upregulated genes (M5 vs. control) and the downregulated genes (M5 + 3-MA vs. M5) using the DAVID tool indicated that the main differences between the groups were associated with 4 main pathogenesis-related functions. A heat map analysis of the differential expression of important representative genes associated with these main pathogenesis-related functions is shown. The color gradient indicates the log2 (fold-change). The results were combined results from two independent experiments. Mean ± SD. *P < 0.05; **P < 0.01; ***P < 0.001. One-way ANOVA (A, B and D). Two-tailed Student’s t-test (C). The data are representative of three independent experiments (A-E)
Figure 5.
Figure 5.
HMGB1, IL1B, and IL18 secretion are regulated by autophagy in psoriasiform keratinocytes dependent on GORASP2. (A and B) NHEK cells were pre-treated with or without 3-methyladenine (3-MA; 4 h, 10 mM), bafilomycin A1 (BAF; 4 h, 200 nM) or wortmannin (WOR; 4 h, 100 nM), and stimulated with or without M5 for 48 h, n = 3/group. (A) ELISA assessed the levels of HMGB1, IL18 and IL1B in the culture medium. (B) The LDH release assay determined cytotoxicity. (C) qRT-PCR analysis of the GORASP2 knockdown levels in HaCaT cells after transfection with GORASP2 shRNA or vector control, n = 3/group. (D-G) Ctrl shRNA KCs and GORASP2 shRNA KCs were stimulated with or without M5 for 24 h or 48 h, n = 3/group. (D) Representative LC3A/B-II immunoblots for KCs after treatment with M5 for 48 h, ACTB was used as a loading control. (E) Analysis of HMGB1, IL18 and IL1B levels in the culture medium by ELISA at 48 h. (F) The RNA levels of chemokines and antimicrobial peptides were assessed by qRT-PCR at 24 h. (G) Analysis of CXCL8 levels in the culture medium by ELISA at 48 h. Mean ± SD. *P < 0.05; **P < 0.01; ***P < 0.001. One-way ANOVA (A-C, E-G). All the data are representative of three independent experiments
Figure 6.
Figure 6.
Autophagy-based unconventional secretion of HMGB1 in psoriasiform KCs. (A) NHEK cells were stimulated with M5 for 24 h in the absence or presence of HMGB1-neutralizing antibody (anti-HMGB1,10 µg/mL), IL18- or IL1B-neutralizing antibody (anti-IL18,10 µg/mL; anti-IL1B, 10 µg/mL). The indicated genes levels were assayed by qRT-PCR, n = 3/group. (B) ELISA analysis of HMGB1 levels in cell culture supernatants of Krt14+/+-Atg5f/f and Krt14Cre/+-atg5f/f primary murine keratinocytes treated with M5 for 48 h, n = 3/group. (C) ELISA analysis of HMGB1 levels in serum from Krt14+/+-Atg5f/f and Krt14Cre/+-atg5f/f mice treated with IMQ for 5 d, n = 3/group. (D) NHEKs were pre-treated with or without 3-methyladenine (3-MA; 4 h, 10 mM), bafilomycin A1 (BAF; 4 h, 200 nM) or wortmannin (WOR; 4 h, 100 nM), and stimulated with or without M5 for 24 h. The HMGB1 gene expression levels were assayed by qRT-PCR, n = 3/group. (E) Ctrl shRNA HaCaT cells and GORASP2 shRNA HaCaT cells were stimulated with or without M5 for 24 h. HMGB1 gene expression levels were assayed by qRT-PCR, n = 3/group. (F-H) HaCaT cells were stimulated with M5 for 24 h or 48 h in the absence or presence of monensin (10 μM, 3 h) or FLI-06 (10 μM, 3 h), the blockers of Golgi transport in conventional secretion pathway. n = 3/group. (F) Representative immunoblots of HMGB1 in cell lysates at 48 h. (G) Analysis of HMGB1 levels in the culture medium by ELISA at 48 h. (H) qRT-PCR analysis of HMGB1 expression at 24 h. (I) HMGB1-EBFP2-transfected HaCaT cells were treated with M5, and representative confocal images of immunofluorescence of LC3A/B and LAMP1 are shown. Scale bars: 10 μm. (J) Line tracings, analysis of fluorescence signal intensity from images in (I), scale bars: 2 μm. (K) Pearson’s colocalization coefficient for HMGB1 and LC3A/B, HMGB1 and LAMP1. (L and M) Representative immunoblots of the indicated proteins in the cell lysates of NHEKs that were pretreated with or without 3-MA (4 h, 10 mM), BAF (4 h, 200 nM), and stimulated with or without M5 for 48 h. ACTB was used as a loading control (F, L and M). Mean ± SD. *P < 0.05; **P < 0.01; ***P < 0.001. One-way ANOVA (A-E, G and H), Two-tailed Student’s T-test (K). All the data are representative of three independent experiments
Figure 7.
Figure 7.
Keratinocyte-derived HMGB1 regulates psoriasis. (A) C57BL/6 wild-type mice received daily intradermal injections of 2 μg rHMGB1 or vehicle control for 7 d. Representative H&E-stained sections are shown and the infiltrating cells were measured at day 7, scale bar: 200 μm (left). Quantification of the thickness and the infiltrating cells in the back skin (right). n = 5/group. (B) Blocking HMGB1 by subcutaneous injection of Hmgb1 shRNA and Ctrl shRNA into mice, and the mice then treated with IMQ for 7 d displayed disease symptoms. Representative H&E-stained sections are shown, scale bar: 100 μm (left). Quantification of thickness and the infiltrating cells in the skin (right). (C) Representative immunoblot for the HMGB1 knockdown levels in human HaCaT cells after transfection with shRNA or vector control. n = 5/group. (D and E) Ctrl shRNA and HMGB1 shRNA KCs were stimulated with M5, n = 3/group. (D) ELISA determined the CXCL8 levels in the culture medium at 48 h. (E) The RNA levels of the indicated genes were assessed by qRT-PCR at 24 h. (F) Representative immunoblots of HMGB1 in epidermal lysates of Krt14+/+-Hmgb1f/f and Krt14Cre/+-hmgb1f/f mice. (G and H) The Krt14+/+-Hmgb1f/f and Krt14Cre/+-hmgb1f/f mice were treated with IMQ for 5 d, n = 5/group. (G) Representative images of the dorsal back from mice treated with IMQ (left), and the mice PASI scores were depicted (right). (H) Representative histological sections of IMQ-treated dorsal back stained with H&E (left), and quantification of thickness and the infiltrating cells in the back skin (right), scale bar: 100 μm. ACTB was used as a loading control (C and F). Mean ± SD. *P < 0.05; **P < 0.01; ***P < 0.001. Two-tailed Student’s T-test (A, G and H), One-way ANOVA (B, D and E). All the data are representative of three independent experiments
Figure 8.
Figure 8.
Autosecretory proteins are responsible for autophagy-modulated psoriasis-like skin inflammation in keratinocytes. (A and B) Krt14+/+-Atg5f/f and Krt14Cre/+-atg5f/f primary murine keratinocytes were stimulated with or without M5 for 24 h in the absence or presence of anti-HMGB1 IgY antibodies (10 μg/mL), anti-IL1B IgG antibodies (10 μg/mL), and anti-IL18 IgG2a antibodies (10 μg/mL); nonimmune IgY, nonimmune IgG or IgG2a were used controls. The indicated genes expression levels were assayed by qRT-PCR. n = 3/group. (C and D) Krt14+/+-Atg5f/f and Krt14Cre/+-atg5f/f primary murine keratinocytes were stimulated with M5 in the absence or presence of rHMGB1 (10 μg/mL), rIL1B (10 ng/mL), rIL18 (100 ng/mL). The indicated genes expression levels were assayed by qRT-PCR. n = 3/group. (E-G) IMQ was applied daily to Krt14+/+-Atg5f/f and Krt14Cre/+-atg5f/f mice that were received a daily intradermal injection of rHMGB1 (1 µg), rIL1B (20 ng), and rIL18 (20 ng) for 5 d, n = 5/group. (E) H&E staining skin sections, left: Representative H&E staining data; right: statistical data, scale bar: 100 μm. (F) FACS for IL17A-producing T cells in the back skin. qRT-PCR analysis of the indicated genes from back skin RNA (G). Mean ± SD. *P < 0.05; **P < 0.01; ***P < 0.001; NS, not significant. One-way ANOVA (A-G). All the data are representative of three independent experiments
Figure 9.
Figure 9.
Keratinocyte-γδ T cell crosstalk is involved in rHMGB1-induced skin inflammation. (A and B) The Krt14+/+-Hmgb1f/f and Krt14Cre/+-hmgb1f/f mice were treated with IMQ for 5 d, n = 5/group. (A) Representative and quantitative results from intracellular FACS analysis of IL17A-producing cells, neutrophils, Vγ5+ cells and IFNG+ cells in the dorsal skin. (B) qRT-PCR analysis of the mRNA levels of the indicated genes in back skin. (C) Epidermal or dermal cell suspensions were isolated from Krt14+/+-Atg5f/f and Krt14Cre/+-atg5f/f mice that treated with IMQ for 2 d. The coculture system of the epidermal and dermal cells was treated with HMGB1 neutralizing antibody (10 μg/mL) or rHMGB1 (10 μg/mL) for 48 h, and the extracellular IL17 expression was analyzed by ELISA, n = 3/group. (D) Representative H&E-stained sections (left, scale bar: 50 μm) of dorsal skin and quantification of the thickness (right) are shown, n = 5/group. (E) qRT-PCR analysis of each indicated gene in the skin, n = 5/group. (F and G) C57BL/6 WT and tcrd KO mice received daily intradermal injections with 2 μg of rHMGB1 or vehicle control for 7 d, n = 5/group. (F) Representative H&E-stained sections (left) and quantification of the thickness (right) are shown, scale bar: 50 μm. (G) The qRT-PCR analysis was performed for each indicated gene in the skin. (H) The coculture system of the epidermal and dermal cells from wild-type C57BL/6 mice was stimulated with rHMGB1 (10 μg/mL) for 48 h, and the extracellular IL17A expression was analyzed by ELISA, n = 3/group. (I) Dermal cell suspensions from wild-type C57BL/6 mice were stimulated with rHMGB1 (10 μg/mL), rIL1B (10 ng/mL) and rIL23A (50 ng/mL) for 48 h, and the extracellular IL17A expression was analyzed by ELISA, n = 3/group. (J and K) KCs were stimulated with 10 μg/mL rHMGB1 for 24 h or 48 h, n = 3/group. (J) The protein level of CXCL8 in the culture medium was assessed by ELISA at 48 h. (K) qRT-PCR analysis of the indicated genes at 24 h. (L) Dermal cells of tcrd KO mice or WT mice were treated with 10 μg/mL rHMGB1-induced epidermal supernatant for 48 h in the absence or presence of anti-HMGB1 IgY antibody (10 μg/mL) or IgY antibody (10 μg/mL), and the extracellular IL17A secretion was analyzed by ELISA. n = 3/group. Mean ± SD. *P < 0.05; **P < 0.01; ***P < 0.001. NS, not significant. Two-tailed Student’s t-test (A, B, D-H, J and K), One-way ANOVA (C, I and L). All the data are representative of three independent experiments

Similar articles

Cited by

References

    1. Lowes MA, Suarez-Farinas M, Krueger JG.. Immunology of psoriasis. Annu Rev Immunol. 2014;32:227–255. - PMC - PubMed
    1. Nestle FO, Di Meglio P, Qin JZ, et al. Skin immune sentinels in health and disease. Nat Rev Immunol. 2009;9:679–691. - PMC - PubMed
    1. Deretic V, Saitoh T, Akira S.. Autophagy in infection, inflammation and immunity. Nat Rev Immunol. 2013;13:722–737. - PMC - PubMed
    1. Shibutani ST, Saitoh T, Nowag H, et al. Autophagy and autophagy-related proteins in the immune system. Nat Immunol. 2015;16:1014–1024. - PubMed
    1. Deretic V, Levine B. Autophagy balances inflammation in innate immunity. Autophagy. 2018;14:243–251. - PMC - PubMed

Publication types

LinkOut - more resources