. 2020 Feb;17(163):20190735.
doi: 10.1098/rsif.2019.0735. Epub 2020 Feb 5.

Fluid and solute transport across the retinal pigment epithelium: a theoretical model

Affiliations

Fluid and solute transport across the retinal pigment epithelium: a theoretical model

Mariia Dvoriashyna et al. J R Soc Interface. 2020 Feb.

Abstract

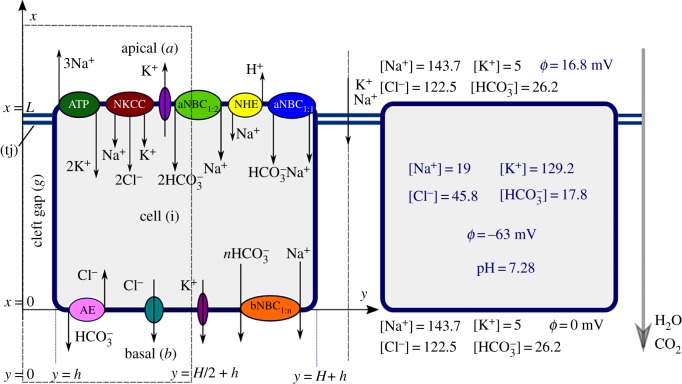
The retina is composed of two main layers-the neuroretina and the retinal pigment epithelium (RPE)-that are separated by a potential gap termed the sub-retinal space (SRS). Accumulation of fluid in the SRS may result in a retinal detachment. A key function of the RPE is to prevent fluid accumulation in the SRS by actively pumping fluid from this space to the choroid. We have developed a mathematical model of this process that incorporates the transport of seven chemical species: Na+, K+, Cl-, HCO3-, H+, CO2 and H2CO3. This allows us to estimate solute and water fluxes and to understand the role of the different membrane ion channels. We have performed a global sensitivity analysis using the extended Fourier amplitude sensitivity test to investigate the relative importance of parameters in generating the model outputs. The model predicts that flow across the RPE is driven by an osmotic gradient in the cleft gap between adjacent cells. Moreover, the model estimates how water flux is modified in response to inhibition of membrane ion channels and carbonic anhydrase (CA). It provides a possible explanation for how CA inhibitors, which are used clinically to prevent fluid accumulation in the SRS, may be acting.

Keywords: fluid transport across epithelia; ion transport; retinal pigment epithelium.


Conflict of interest statement

We declare we have no competing interests.

Figures

Figure 1.
Figure 1.
Sketch of the retinal pigment epithelium cell. Drawing by Prof. Federica Grillo (University of Genoa, Italy). (Online version in colour.)
Figure 2.
Figure 2.
Left cell: Diagram of ion channels in the RPE cell membranes, with a sketch of the domain and coordinate system. Right cell: Typical values for species concentrations (in mM) and electrical potential (mV) under the open-circuit condition. The prescribed values are in black and the values predicted by the model are in blue for the reference parameters in table 2, with an identical concentration of CO2 in the apical and basal regions. (Online version in colour.)
Figure 3.
Figure 3.
Sketch of the imposed boundary conditions. (Online version in colour.)
Figure 4.
Figure 4.
(a) Left axis: deviation of the ion concentrations along the cleft from those in the basal region for the reference parameters in table 2. The x-axis goes along the symmetry mid-line (y = 0) of the cleft, from the basal region to the tight junction. Right axis: electrical potential along the x-axis in the cleft. (b) Osmolarity distribution along the cell (y = H/2 + h) and cleft (y = 0). The osmolarities in the apical and basal regions are shown with a circle and a triangle, respectively. Inset: schematic of the direction and magnitude of water fluxes across cell membranes. (Online version in colour.)
Figure 5.
Figure 5.
First and total sensitivity indices for water flux. For the large bars, arrows indicate how the magnitude of water flux is modified, up or down, by an increase in that particular parameter. The dummy parameter is introduced to verify the results: its deviation from zero can be interpreted as the uncertainty in the method, e.g. due to an insufficient number of points. (Online version in colour.)
Figure 6.
Figure 6.
Scatter plots for water flux Q versus four parameters with largest sensitivity indices: (a) PATP, (b) PbNBC1:2, (c) PNHE and (d) Ptj. Each point corresponds to a numerical experiment. Different colours correspond to different searching curves. (Online version in colour.)
Figure 7.
Figure 7.
Total sensitivity index for ion fluxes. The arrows indicate the direction of ion flux change with the increase in a given parameter. (Online version in colour.)
Figure 8.
Figure 8.
Scatter plots for water flux Q versus (a) Na+, (b) K+, (c) Cl and (d) HCO3 flux. Each point corresponds to a numerical experiment. (Online version in colour.)
Figure 9.
Figure 9.
The case of apical CO2 at 7% and basal CO2 at 5%. (a) Left axis: deviation of ion concentrations from their average value in the cell along the x-axis, n^ki=0Lnkidx/L. Right axis: deviation of the electrical potential along the x-axis in the cell from its average value. (b) Osmolarity distribution in the cell, cleft, apical and basal regions. Inset: schematic of the direction and magnitude of water fluxes across cell membranes. (Online version in colour.)
Figure 10.
Figure 10.
Water flux as a function of the CA activity. The values of α on the x-axes are factors that multiply the reaction rates kd and kh of the reaction (2.1). The value α = 1 corresponds to full catalysis (the reaction rates from table 2); as the value of α decreases the catalyser is progressively inhibited. In (a), the typical solution, with other parameter values from table 2, is considered. Different curves correspond to different values of apical CO2 concentration: 5%, 7% and 9%, while basal CO2 is kept at 5%. In (b), we vary nine model parameters from table 4, keeping membrane permeabilities to ions (P1b, P1a and P2b) fixed, while inhibiting CA with apical CO2 at 7% and basal CO2 at 5%. Different colours correspond to different searching curves. (Online version in colour.)

References

    1. Adijanto J, Banzon T, Jalickee S, Wang NS, Miller SS. 2009. CO2-induced ion and fluid transport in human retinal pigment epithelium. J. Gen. Physiol. 133, 603–622. (10.1085/jgp.200810169) - DOI - PMC - PubMed
    1. Hughes BA, Miller SS, Machen TE. 1984. Effects of cyclic AMP on fluid absorption and ion transport across frog retinal pigment epithelium. Measurements in the open-circuit state. J. Gen. Physiol. 83, 875–899. (10.1085/jgp.83.6.875) - DOI - PMC - PubMed
    1. Shi G, Maminishkis A, Banzon T, Jalickee S, Li R, Hammer J, Miller SS. 2008. Control of chemokine gradients by the retinal pigment epithelium. Invest. Ophthalmol. Vis. Sci. 49, 4620–4630. (10.1167/iovs.08-1816) - DOI - PMC - PubMed
    1. Marmor M. 1990. Control of subretinal fluid: experimental and clinical studies. Eye 4, 340–344. (10.1038/eye.1990.46) - DOI - PubMed
    1. Fischbarg J. 2003. On the mechanism of fluid transport across corneal endothelium and epithelia in general. J. Exp. Zool. A Ecol. Genet. Physiol. 300, 30–40. (10.1002/jez.a.10306) - DOI - PubMed

Publication types

MeSH terms

LinkOut - more resources