. 2020 Feb;10(2):190228.
doi: 10.1098/rsob.190228. Epub 2020 Feb 5.

DNA topoisomerase IIIβ promotes cyst generation by inducing cyst wall protein gene expression in Giardia lamblia

Affiliations

DNA topoisomerase IIIβ promotes cyst generation by inducing cyst wall protein gene expression in Giardia lamblia

Chin-Hung Sun et al. Open Biol. 2020 Feb.

Abstract

Giardia lamblia causes waterborne diarrhoea by transmission of infective cysts. Three cyst wall proteins are highly expressed in a concerted manner during encystation of trophozoites into cysts. However, their gene regulatory mechanism is still largely unknown. DNA topoisomerases control topological homeostasis of genomic DNA during replication, transcription and chromosome segregation. They are involved in a variety of cellular processes including cell cycle, cell proliferation and differentiation, so they may be valuable drug targets. Giardia lamblia possesses a type IA DNA topoisomerase (TOP3β) with similarity to the mammalian topoisomerase IIIβ. We found that TOP3β was upregulated during encystation and it possessed DNA-binding and cleavage activity. TOP3β can bind to the cwp promoters in vivo using norfloxacin-mediated topoisomerase immunoprecipitation assays. We also found TOP3β can interact with MYB2, a transcription factor involved in the coordinate expression of cwp1-3 genes during encystation. Interestingly, overexpression of TOP3β increased expression of cwp1-3 and myb2 genes and cyst formation. Microarray analysis confirmed upregulation of cwp1-3 and myb2 genes by TOP3β. Mutation of the catalytically important Tyr residue, deletion of C-terminal zinc ribbon domain or further deletion of partial catalytic core domain reduced the levels of cleavage activity, cwp1-3 and myb2 gene expression, and cyst formation. Interestingly, some of these mutant proteins were mis-localized to cytoplasm. Using a CRISPR/Cas9 system for targeted disruption of top3β gene, we found a significant decrease in cwp1-3 and myb2 gene expression and cyst number. Our results suggest that TOP3β may be functionally conserved, and involved in inducing Giardia cyst formation.

Keywords: DNA-binding protein; Giardia; cyst; differentiation; topoisomerase IIIβ; transcription.


Conflict of interest statement

We declare we have no competing interests.

Figures

Figure 1.
Figure 1.
Analysis of top3β gene expression. (a) Schematic of the Giardia TOP3β protein. The green box and red box indicate the Toprim domain and Topoisom_bac domain, respectively, as predicted by pfam. The conserved Tyr 328 (Y328) is indicated. (b) RT-PCR and quantitative real-time PCR analysis of top3β gene expression. RNA samples were prepared from G. lamblia wild-type non-transfected WB cells cultured in growth (Veg, vegetative growth) or encystation medium and harvested at 24 h (Enc, encystation). RT-PCR was performed using primers specific for top3β, cwp1, ran and 18S ribosomal RNA (18S rRNA) genes, respectively (left panel). Real-time PCR was performed using primers specific for top3β and 18S ribosomal RNA genes, respectively (right panel). Transcript levels were normalized to 18S ribosomal RNA levels. Fold changes in mRNA expression are shown as the ratio of transcript levels in encysting cells relative to vegetative cells. Results are expressed as the means ± 95% confidence intervals (error bars) of at least three separate experiments. p < 0.05 was considered significant and the value was shown. As controls, we found that the mRNA expression of cwp1 and ran significantly increased and decreased during encystation, respectively. (c) TOP3β level increased during encystation. The wild-type non-transfected WB cells were cultured in growth (Veg, vegetative growth) or encystation medium for 24 h (Enc, encystation) and then subjected to SDS-PAGE and Western blot analysis. The blot was probed with anti-TOP3β and anti-α-tubulin antibodies, respectively. Equal amounts of protein loading were confirmed by SDS-PAGE and Coomassie Blue staining. The α-tubulin level slightly decreased during encystation. The intensity of bands from three Western blot assays was quantified using ImageJ. The ratio of TOP3β protein over the loading control (Coomassie Blue-stained proteins) is calculated. Fold change is calculated as the ratio of the difference between the Enc sample and Veg sample, to which a value of 1 was assigned. Results are expressed as mean ± 95% confidence intervals. p < 0.05 was considered significant and the value was shown. (d) Diagrams of the 5′Δ5N-Pac and pPTOP3β plasmid. The pac gene (open box) is under the control of the 5′- and 3′-flanking regions of the glutamate dehydrogenase (gdh) gene (striated box). In construct pPTOP3β, the top3β gene is under the control of its own 5′-flanking region (open box) and the 3′-flanking region of the ran gene (dotted box). The filled black box indicates the coding sequence of the HA epitope tag. (e) TOP3β-HA level increased during encystation in TOP3β-overexpressing cells. The pPTOP3β stable transfectants were cultured in growth (Veg, vegetative growth) or encystation medium for 24 h (Enc, encystation) and then subjected to SDS-PAGE and Western blot analysis. The blot was probed with anti-HA and anti-RAN antibodies, respectively. Equal amounts of protein loading were confirmed by SDS-PAGE and Coomassie Blue staining. The RAN level slightly decreased during encystation. The ratio of TOP3β-HA protein over the loading control (Coomassie Blue-stained proteins) is calculated as described in figure 1c.
Figure 2.
Figure 2.
Localization of TOP3β mutants. (a) Diagrams of TOP3β and TOP3βm1-3. The residue Tyr 328 (Y328), which is important for TOP3β activity, is mutated to Phe (F328) in TOP3βm1. TOP3βm2 remains the same as wild-type TOP3β, except that it does not contain the C-terminal zinc ribbon domain (deletion of residues 642–973). TOP3βm3 remains the same as wild-type TOP3β, except that it does not contain the C-terminal zinc ribbon domain and part of the Topoisom_bac domain (deletion of residues 422–973). The top3β gene was mutated and subcloned to replace the wild-type top3β gene in the backbone of pPTOP3β (figure 1d), and the resulting plasmids pPTOP3βm1-3 were transfected into Giardia. The expression cassettes of the pac gene and top3β gene are the same as in figure 1d. (b) Perinuclear localization of the TOP3β protein. The pPTOP3β stable transfectants were cultured in growth (Veg, left panel) or encystation medium for 24 h (Enc, right panel), and then subjected to immunofluorescence analysis using anti-HA antibody for detection. The upper panels show that the TOP3β protein is localized to the nuclear periphery and slightly to the cytoplasm of vegetative and encysting trophozoites. The middle panels show the DAPI staining of cell nuclei. The bottom panels show the merged images. Some perinuclear staining of TOP3β-HA overlapped with DAPI. (c) Localization of CWP1 in the TOP3β-overexpressing cell line. The pPTOP3β stable transfectants were cultured in encystation medium for 24 h and then subjected to immunofluorescence assays. The endogenous CWP1 protein and vector-expressed TOP3β-HA protein were detected by anti-CWP1 and anti-HA antibodies, respectively. The left panel shows that the TOP3β-HA protein is localized to the nuclear periphery and slightly to the cytoplasm. The middle panel shows that the CWP1 protein is localized to the ESVs. The right panel shows the merged image. (d–f) Immunofluorescence analysis of TOP3βm1-3 distribution. The pPTOP3βm1-3 stable transfectants were cultured and then subjected to immunofluorescence analysis as described in figure 2b. The products of pPTOP3βm1 localized to the nuclear periphery that overlapped with DAPI with slight cytoplasmic staining in both vegetative and encysting trophozoites (d). The products of pPTOP3βm2 localized to the cytoplasm with minor presence in perinuclear region that overlapped with DAPI in both vegetative and encysting trophozoites (e). The products of pPTOP3βm3 localized to the vesicles in cytoplasm with minor presence in perinuclear region that overlapped with DAPI in both vegetative and encysting trophozoites (f). (g) Negative control for immunofluorescence. The wild-type WB trophozoites were cultured in growth (Veg, vegetative growth) and then subjected to immunofluorescence analysis using anti-HA antibody for detection as described in figure 2b.
Figure 3.
Figure 3.
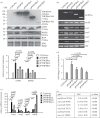
Induction of cwp1-3 and myb2 gene expression in the TOP3β-overexpressing cell line. (a) Overexpression of TOP3β increased the CWP1 and MYB2 levels. The 5′Δ5N-Pac, pPTOP3β, pPTOP3βm1, pPTOP3βm2 and pPTOP3βm3 stable transfectants were cultured in growth medium and then subjected to SDS-PAGE and Western blot. The blot was probed with anti-HA, anti-CWP1, anti-MYB2 and anti-RAN antibodies, respectively. Equal amounts of protein loading were confirmed by SDS-PAGE and Coomassie Blue staining. A similar level of the RAN protein was detected. The intensity of bands from three Western blot assays was quantified using ImageJ. The ratio of CWP1 and MYB2 proteins over the loading control RAN is calculated. Fold change is calculated as the ratio of the difference between the specific cell line and 5′Δ5N-Pac cell line, to which a value of 1 was assigned. Results are expressed as mean ± 95% confidence intervals. p < 0.05 was considered significant and the value was shown. (b) RT-PCR analysis of gene expression in the TOP3β- and TOP3β mutant-expressing cell lines. The 5′Δ5N-Pac, pPTOP3β and pPTOP3βm1-m3 stable transfectants were cultured in growth medium and then subjected to RT-PCR analysis using primers specific for top3β-ha, top3β, cwp1, cwp2, cwp3, myb2 and 18S ribosomal RNA genes, respectively. Similar levels of the 18S ribosomal RNA for these samples were detected. (c) Quantitative real-time PCR analysis of gene expression in the TOP3β- and TOP3β mutant-expressing cell lines. Real-time PCR was performed using primers specific for top3β, cwp1, cwp2, myb2 and 18S ribosomal RNA genes, respectively, as described in figure 1b. (d) TOP3β overexpression increased cyst formation. The pPTOP3β and pPTOP3βm1-m3 stable transfectants were cultured in growth medium and then subjected to cyst count as described under ‘Material and methods'. The sum of total cysts is expressed as a relative expression level over control. Values are shown as means ± 95% confidence intervals. p < 0.05 was considered significant and the value was shown. (e) Microarray analysis. Microarray data were obtained from the 5′Δ5N-Pac and pPTOP3β cell lines during vegetative growth. Fold changes are shown as the ratio of transcript levels in the pPTOP3β cell line relative to the 5′Δ5N-Pac cell line. Results are expressed as the mean ± 95% confidence intervals of at least three experiments. p < 0.05 was considered significant and the value was shown.
Figure 4.
Figure 4.
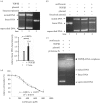
DNA cleavage activity of TOP3β and effect of norfloxacin. (a) TOP3β has DNA cleavage activity. DNA cleavage assays were performed with purified recombinant TOP3β and pBluescript SK(+) plasmid (3.0 kb). Components in the reaction are indicated above the lanes. Typically, 10 ng TOP3β was mixed with 300 ng plasmid DNA. Linearized plasmid was included as a size marker. The intensity of linear DNA bands from three assays was quantified using ImageJ. Fold change is calculated as the ratio of the ‘+ TOP3β’ sample to the ‘− TOP3β’ sample, to which a value of 1 was assigned. Results are expressed as mean ± 95% confidence intervals. p < 0.05 was considered significant and the value was shown. (b) Norfloxacin increased the cleavage complexes. DNA cleavage assays were performed with purified recombinant TOP3β and pBluescript SK(+) plasmid. Norfloxacin was added in the reaction as indicated above the lanes. Typically, 10 ng TOP3β was mixed with 300 ng plasmid DNA. Norfloxacin was dissolved in Me2SO. Adding Me2SO to the reaction mix was used as a control (lane 3). Adding 4.8 mM norfloxacin to the reaction mix increased the TOP3β DNA cleavage complexes (lane 4). Linearized plasmid was included as a size marker. (c) TOP3β formed covalent complexes with DNA. DNA cleavage assays were performed with purified recombinant TOP3β and pBluescript SK(+) plasmid. Norfloxacin was added in the reaction as indicated above the lanes. After reaction, proteinase K at a final concentration of 2 µg µl−1 was added to the stop reaction of the cleavage assay, and then the products were analysed by agarose gel electrophoresis. The same volume of ddH2O was used for a negative reaction. (d) Anti-Giardia activity of norfloxacin. The wild-type non-transfected WB cells were subcultured at an initial density of 5 × 10⁴ cells ml−1 in growth medium containing 0, 100, 200, 300, 400, 500, 600, 700 or 800 µM norfloxacin for 24 h and then subjected to cell count. An equal volume of Me2SO was added to cultures as a negative control. The sum of total cells is expressed as a relative expression level over control. Values are shown as means ± 95% confidence intervals of three independent experiments.
Figure 5.
Figure 5.
Decrease in DNA cleavage and DNA-binding activity of TOP3β mutants. (a) TOP3β and its mutants were purified from E. coli and detected by Western blot using anti-V5 antibody. (b) TOP3β mutants have lower DNA cleavage activity. DNA cleavage assays were performed with purified recombinant TOP3β and its mutants and pBluescript SK(+) plasmid. Typically, 10 ng TOP3β or its mutants and 300 ng plasmid DNA were used. Components in the reaction are indicated above the lanes. Linearized plasmid was included as a size marker. (c) DNA-binding ability of TOP3β. Electrophoretic mobility shift assays were performed using purified TOP3β and the 32P-end-labelled oligonucleotide probe cwp1-45/−1 (−45 bp to −1 bp relative to the translation start site of the cwp1 gene). Components in the binding reaction mixtures are indicated above the lanes. The arrowheads indicate the shifted complexes. The TOP3β-binding specificity was confirmed by competition and supershift assays. Some reaction mixtures contained 200-fold molar excess of cold oligonucleotides or 0.8 µg of anti-TOP3β antibody as indicated above the lanes. The transcription start sites of the cwp1 and cwp3 genes are indicated by asterisks. The AT-rich initiator elements spanning the transcription start sites are underlined. (d) Decrease in DNA-binding activity of TOP3β mutants. Electrophoretic mobility shift assays were performed using purified TOP3β and its mutants and the 32P-end-labelled oligonucleotide probe cwp3-30/+10. The arrowheads indicate the shifted complexes.
Figure 6.
Figure 6.
Detection of TOP3β binding sites in multiple promoters. Electrophoretic mobility shift assays were performed using purified TOP3β and 32P-labelled oligonucleotide probes. Components in the binding reaction mixtures are indicated above the lanes. The transcription start sites of the cwp1, cwp2 and cwp3 genes determined from 24 h encysting cells are indicated by asterisks. The AT-rich initiator elements spanning the transcription start sites are underlined. The translation start sites of the cwp2 and cwp3 genes are bold. ‘18S’ represents 18S ribosomal RNA.
Figure 7.
Figure 7.
Recruitment of TOP3β to the cwp and myb2 promoters and interaction between TOP3β and MYB2. (a) ChIP analysis of recruitment of TOP3β to the cwp and myb2 promoters. The non-transfected WB cells were cultured in encystation medium containing 497 µM norfloxacin for 24 h and then subjected to norfloxacin-mediated topoisomerase immunoprecipitation assays. Anti-TOP3β was used to assess binding of TOP3β to endogenous gene promoters. Preimmune serum was used as a negative control. Immunoprecipitated chromatin was analysed by PCR using primers that amplify the 5′-flanking region of the specific genes. At least three independent experiments were performed. Representative results are shown. Immunoprecipitated products of TOP3β yield more PCR products of the top3β, cwp1, cwp2, cwp3, myb2 gene promoters, indicating that TOP3β bound to these promoters (+). However, the anti-TOP3β antibody did not enrich the U6 promoter fragment (−). The 18S ribosomal RNA gene promoter was used as a negative control (−). (b) ChIP analysis coupled by quantitative PCR. Values represented as a percentage of the antibody-enriched chromatin relative to the total input chromatin (% of Input). Results are expressed as the mean ± 95% confidence intervals of at least three experiments. p < 0.05 was considered significant and the value was shown. (c) Expression of the TOP3β-HA, TOP3β, MYB2 and ISCS proteins detected in whole cell extracts for co-immunoprecipitation assays (Input). The 5′Δ5N-Pac and pPTOP3β stable transfectants were cultured in encystation medium for 24 h and then subjected to SDS-PAGE and Western blot analysis as described in figure 3a. The blot was probed with anti-TOP3β, anti-MYB2, anti-ISCS and anti-RAN antibodies, respectively. The intensity of bands from three Western blot assays was quantified as described in figure 3a. (d) Interaction between TOP3β and MYB2 detected by co-immunoprecipitation assays. The 5′Δ5N-Pac and pPTOP3β stable transfectants were cultured in encystation medium for 24 h. Proteins from cell lysates were immunoprecipitated using anti-HA antibody conjugated to beads. The precipitates were analysed by Western blotting with anti-HA, anti-TOP3β, anti-MYB2 and anti-ISCS antibodies, respectively, as indicated. (e) TOP3β and MYB2 interaction confirmed by Far Western blot analysis. Recombinant MYB2-N (residues 1–410) and ISCS proteins with a V5 tag at its C terminus was purified by affinity chromatography and detected by anti-V5 antibody in Western blot analysis (bottom panels). Far Western blot analysis was performed using the purified recombinant MYB2-N. The ISCS protein was used as a negative control. MYB2-N and ISCS were subjected to separation by SDS-PAGE, transferred onto a membrane, refolded in renaturation buffers, and incubated with lysate from the pPTOP3β stable transfectants as in figure 7d. Bound TOP3β-HA was detected with immunoblot using anti-HA antibody (upper panels). The purified recombinant MYB2-N and ISCS proteins on the membrane were detected using anti-V5 antibody (lower panels). TOP3β-HA bound to MYB2-N but not to ISCS.
Figure 8.
Figure 8.
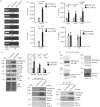
Decrease in expression of cwp1-3 and myb2 by targeted disruption of the top3β gene during vegetative growth. (a) Diagrams of the pgCas9 and pTOP3βtd plasmids. In construct pgCas9, the cas9 gene is under the control of gdh promoter (striated box) and 3′ untranslated region of the ran gene (dotted box) and its product has a C-terminal nuclear localization signal (filled grey box) and an HA tag (filled black box). In construct pTOP3βtd, a single gRNA is driven by the Giardia U6 promoter. The single gRNA includes a guide sequence targeting 20-nucleotide of the top3β gene (nt 135–154), which is located upstream of three nucleotides of protospacer-adjacent motif (NGG sequence). pTOP3βtd also has the HR template cassette which contains the 5′ and 3′ flanking region of the top3β gene as homologous arms and the pac selectable marker. The Cas9/gRNA cutting site in the genomic top3β gene is indicated by a red arrow. After introducing a double-stranded DNA break in the top3β gene, replacement of the genomic top3β gene with the pac gene will occur by HR. The pgCas9 and pTOP3βtd constructs were transfected into G. lamblia WB trophozoites. An NHEJ inhibitor, SCR7, was added to increase HR. The TOP3βtd stable transfectants were established under puromycin selection. The control cell line is trophozoites transfected with double amounts of 5′Δ5N-Pac plasmid (figure 1d) and selected with puromycin. PCR1/2 were used for identification of clones with targeted disruption. (b) Partial replacement of the top3β gene with the pac gene in the TOP3βtd cell line confirmed by PCR. Puromycin was kept in the TOP3βtd and control cell lines. Genomic DNA was isolated from the TOP3βtd and control cell lines cultured in growth medium (vegetative growth, Veg). PCR was performed using primers specific for top3β (PCR1 in panel a), pac (PCR2 in panel a), cwp1, cwp2 and ran genes, respectively. Products from the cwp1, cwp2, and ran genes are internal controls. (c) Partial disruption of the top3β gene in the TOP3βtd cell line confirmed by real-time PCR. Real-time PCR was performed using primers specific for top3β, cwp1, cwp2 and ran genes, respectively. The top3β, cwp1 and cwp2 DNA levels were normalized to the ran DNA level. Fold changes in DNA levels are shown as the ratio of DNA levels in the TOP3βtd cell line relative to the control cell line. Results are expressed as the means ± 95% confidence intervals (error bars) of at least three separate experiments. p < 0.05 was considered significant and the value was shown. (d) Targeted disruption of the top3β gene increased G418 sensitivity. The TOP3βtd and control cell lines were subcultured at an initial density of 1 × 10⁶ cells ml−1 in growth medium containing 518 µM G418 for 24 h and then subjected to cell count. An equal volume of ddH2O was added to cultures as a negative control. The sum of total cells is expressed as a relative expression level over control. Values are shown as means ± 95% confidence intervals of three independent experiments. p < 0.05 was considered significant and the value shown. The viability of the TOP3βtd cell line decreased compared to the control cell line. (e) Cyst formation decreased by targeted disruption of the top3β gene in the TOP3βtd cell line during vegetative growth. The control and TOP3βtd cell lines were cultured in growth medium and then subjected to cyst count as described under ‘Material and methods' and figure 3d. (f) Targeted disruption of the top3β gene decreased the CWP1 level in the TOP3βtd cell line during vegetative growth. The control and TOP3βtd cell lines were cultured in growth medium and then subjected to SDS-PAGE and Western blot analysis as described in figure 3a. The blot was probed with anti-TOP3β, anti-CWP1 and anti-RAN antibodies, respectively. The intensity of bands from three Western blot assays was quantified as described in figure 3a. (g) Decrease in expression of cwp1-3 and myb2 by targeted disruption of the top3β gene in the TOP3βtd cell line during vegetative growth. The control and TOP3βtd cell lines were cultured in growth medium and then subjected to quantitative real-time RT-PCR analysis using primers specific for top3β, cwp1, cwp2, cwp3, myb2, ran and 18S ribosomal RNA genes, respectively, as described in figure 1b.
Figure 9.
Figure 9.
Increase of encystation-induced cwp1–3 genes during differentiation into cysts. The genes encoding key components of the cyst wall, cwp1–3, are upregulated by TOP3β, MYB2 and other transcription factors during differentiation into cysts. These factors can bind to cis-acting elements, such as box1–4 or AT-rich initiator (Inr) of the cwp1–3 promoter to activate cwp1–3 transcription. TOP3β, MYB2 and other transcription factors, can form complexes and recruit RNA polymerase II to activate cwp1–3 transcription. CWP1 was present in vegetative trophozoite stage at a lower level. During encystation, more CWP1 is produced by these factors. During encystation, the increase of MYB2, TOP3β and other transcription factors may further induce CWP1 expression, resulting in more cyst formation.

Similar articles

Cited by

References

    1. Adam RD. 2001. Biology of Giardia lamblia. Clin. Microbiol. Rev. 14, 447–475. (10.1128/CMR.14.3.447-475.2001) - DOI - PMC - PubMed
    1. Einarsson E, Ma'ayeh S, Svärd SG. 2016. An update on Giardia and giardiasis. Curr. Opin. Microbiol. 34, 47–52. (10.1016/j.mib.2016.07.019) - DOI - PubMed
    1. Hanevik K, Wensaas KA, Rortveit G, Eide GE, Mørch K, Langeland N. 2014. Irritable bowel syndrome and chronic fatigue 6 years after giardia infection: a controlled prospective cohort study. Clin. Infect. Dis. 59, 1394–1400. (10.1093/cid/ciu629) - DOI - PMC - PubMed
    1. Halliez MC, Buret AG. 2013. Extra-intestinal and long term consequences of Giardia duodenalis infections. World J. Gastroenterol, 19, 8974–8985. (10.3748/wjg.v19.i47.8974) - DOI - PMC - PubMed
    1. Morrison HG, et al. 2007. Genomic minimalism in the early diverging intestinal parasite Giardia lamblia. Science 317, 1921–1926. (10.1126/science.1143837) - DOI - PubMed

Publication types

MeSH terms