Randomized Controlled Trial
. 2020 Feb 4;20(1):37.
doi: 10.1186/s12871-020-0956-7.

Effects of low versus standard pressure pneumoperitoneum on renal syndecan-1 shedding and VEGF receptor-2 expression in living-donor nephrectomy: a randomized controlled study

Affiliations
Randomized Controlled Trial

Effects of low versus standard pressure pneumoperitoneum on renal syndecan-1 shedding and VEGF receptor-2 expression in living-donor nephrectomy: a randomized controlled study

Dita Aditianingsih et al. BMC Anesthesiol. .

Abstract

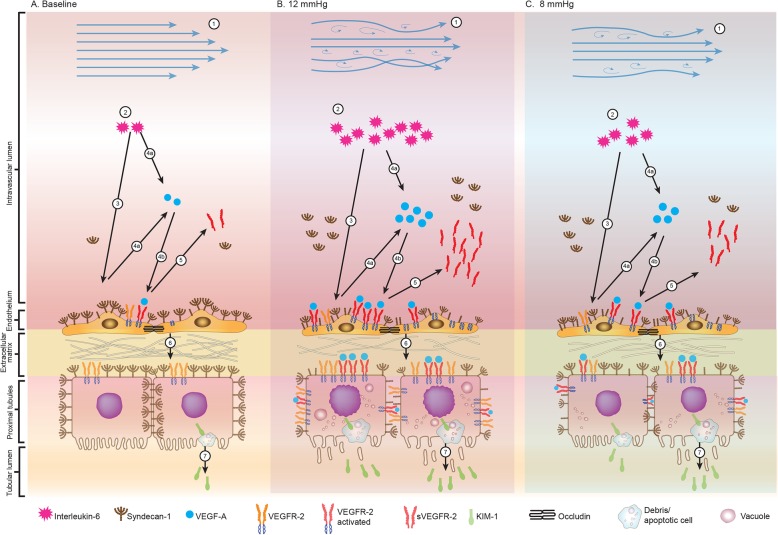
Background: Laparoscopic nephrectomy is a preferred technique for living kidney donation. However, positive-pressure pneumoperitoneum may have an unfavorable effect on the remaining kidney and other distant organs due to inflamed vascular endothelium and renal tubular cell injury in response to increased systemic inflammation. Early detection of vascular endothelial and renal tubular response is needed to prevent further kidney injury due to increased intraabdominal pressure induced by pneumoperitoneum. Transperitoneal laparoscopic living donor nephrectomy represented a human model of mild increasing intraabdominal pressure. This study aimed to assess the effect of increased intraabdominal pressure on vascular endothelium and renal tubular cells by comparing the effects of low and standard pressure pneumoperitoneum on vascular endothelial growth factor receptor-2 (VEGFR-2) expression and the shedding of syndecan-1 as the early markers to a systemic inflammation.

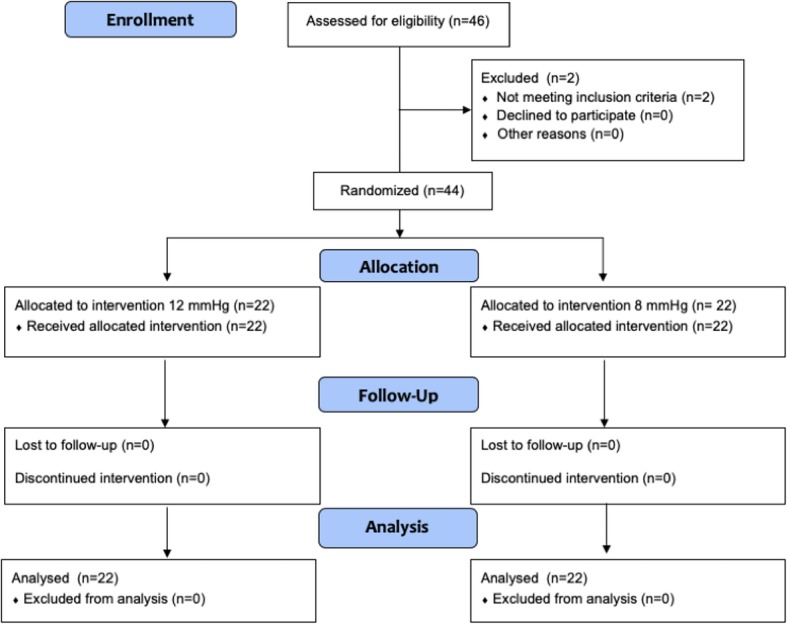
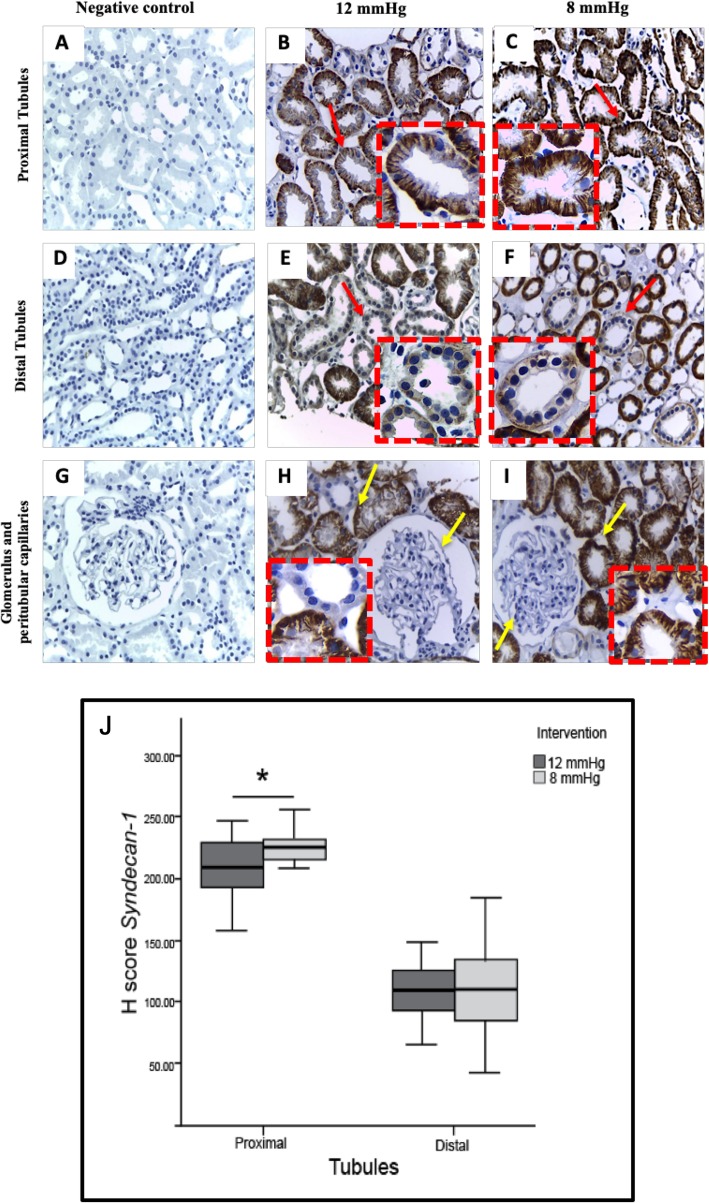
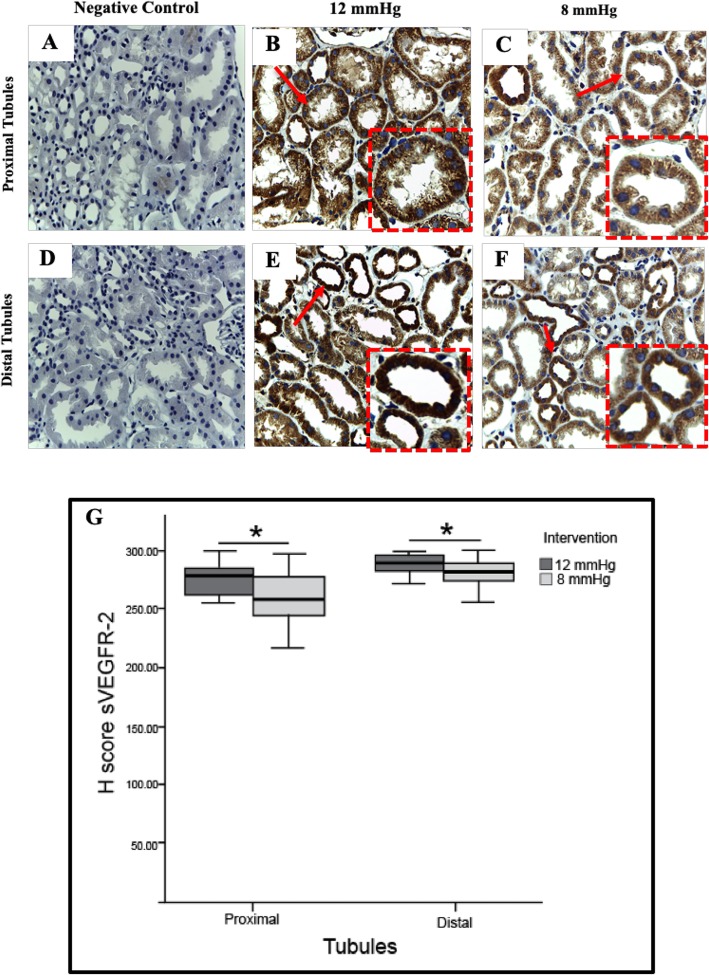
Methods: We conducted a prospective randomized study on 44 patients undergoing laparoscopic donor nephrectomy. Subjects were assigned to standard (12 mmHg) or low pressure (8 mmHg) groups. Baseline, intraoperative, and postoperative plasma interleukin-6, syndecan-1, and sVEGFR-2 were quantified by ELISA. Syndecan-1 and VEGFR-2 expression were assessed immunohistochemically in renal cortex tissue. Renal tubule and peritubular capillary ultrastructures were examined using electron microscopy. Perioperative hemodynamic changes, end-tidal CO2, serum creatinine, blood urea nitrogen, and urinary KIM-1 were recorded.

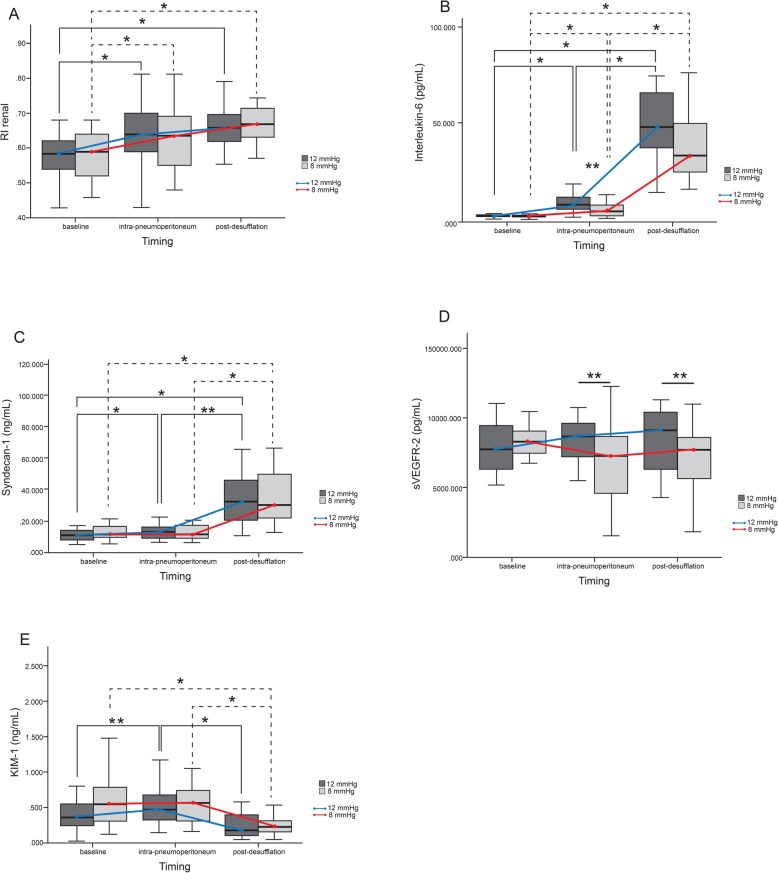
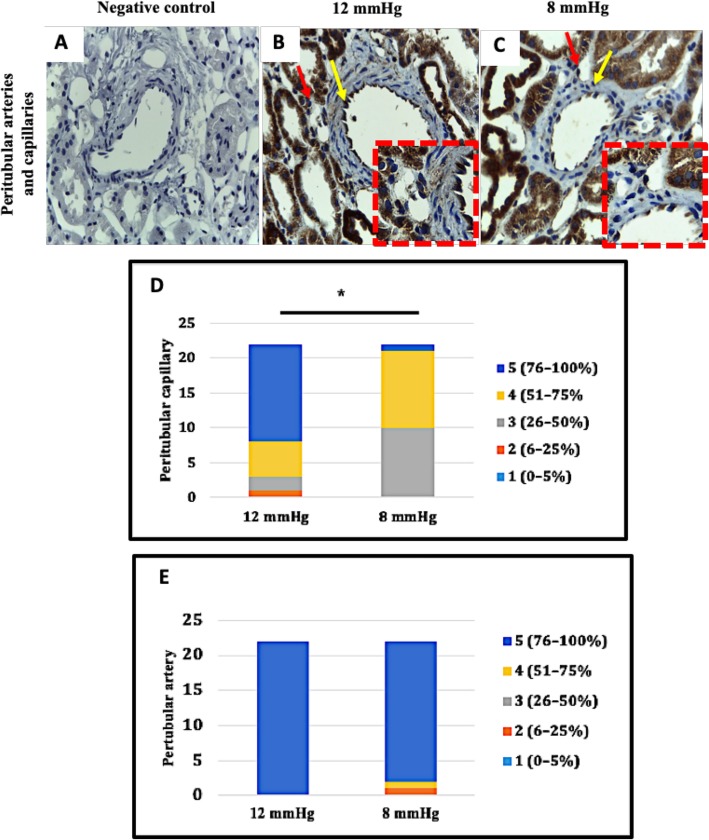
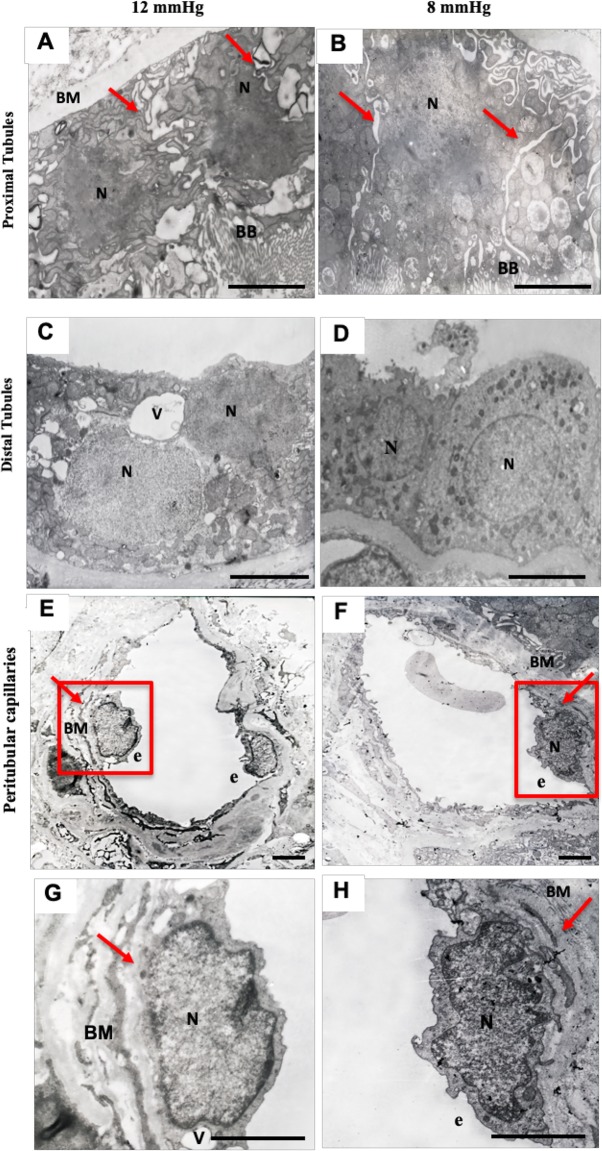
Results: The low pressure group showed lower intra- and postoperative heart rate, intraoperative plasma IL-6, sVEGFR-2 levels and plasma syndecan-1 than standard pressure group. Proximal tubule syndecan-1 expression was higher in the low pressure group. Proximal-distal tubules and peritubular capillary endothelium VEGFR-2 expression were lower in low pressure group. The low pressure group showed renal tubule and peritubular capillary ultrastructure with intact cell membranes, clear cell boundaries, and intact brush borders, while standard pressure group showed swollen nuclei, tenuous cell membrane, distant boundaries, vacuolizations, and detached brush borders.

Conclusion: The low pressure pneumoperitoneum attenuated the inflammatory response and resulted in reduction of syndecan-1 shedding and VEGFR-2 expression as the renal tubular and vascular endothelial proinflammatory markers to injury due to a systemic inflammation in laparoscopic nephrectomy.

Trial registration: ClinicalTrials.gov NCT:03219398, prospectively registered on July 17th, 2017.

Keywords: Interleukin-6; Laparoscopic nephrectomy; Pneumoperitoneum; Renal resistive index; Syndecan-1; sVEGFR-2.


Conflict of interest statement

The authors declare that they have no competing interests.

Figures

Fig. 1
Fig. 1
CONSORT flow diagram
Fig. 2
Fig. 2
Comparison of renal resistive index (RI), plasma interleukin-6 (IL-6), syndecan-1, soluble VEGFR-2, and urinary KIM-1 between 12 mmHg and 8 mmHg groups. a RI. 12 mmHg vs 8 mmHg: 2-h pneumoperitoneum (0.66 (0.63–0.68) vs 0.67 (0.65–0.70), p = 0.4); 2 h desufflation (0.66 (0.64–0.68) vs 0.68 (0.66–0.70), p = 0.4). Compared to baseline (12 mmHg: 0.59 (0.55–0.62); 8 mmHg: 0.60 (0.55–0.61)) 2-h pneumoperitoneum and 2-h desufflation were significantly higher (p < 0.001). b IL-6 (pg/dL). 12 mmHg vs 8 mmHg: 2-h pneumoperitoneum (8.92 (6.21–11.62) vs 4.75 (3.50–5.99), p = 0.003); 2-h desufflation (46.17 (35.36–56.98) vs 37.42 (27.89–46.95), p = 0.2). Compared to baseline: (12 mmHg: 1.66 (1.41–1.90); 8 mmHg: 1.50 (1.31–1.69)) 2-h pneumoperitoneum and 2-h desufflation were significantly higher (p < 0.001). c Syndecan-1 (ng/mL). 12 mmHg vs 8 mmHg: 2-h pneumoperitoneum 15.18 (11.14–19.22) vs 13.66 (10.04–17.27), p = 0.1); 2-h desufflation (12 mmHg: 30.52 (23.80–37.23) vs 33.12 (25.21–41.02), p = 0.9). Compared to baseline: (12 mmHg: 10.87 (8.81–12.92); 8 mmHg: 12.07 (9.56–14.57)) 2-h pneumoperitoneum and 2-h desufflation were significantly higher (p < 0.001). d sVEGFR-2 (pg/dL). 12 mmHg vs 8 mmHg: 2-h pneumoperitoneum 8106.02 (7187.38–9024.66) vs 6841.05 (5598.85–8083.25), p = 0.032), 2-h desufflation (8452.25 (7486.88–9417.61) vs 7263.92 (6258.32–8269.51); p = 0.044) e KIM-1 (ng/mL). 12 mmHg vs 8 mmHg: 2-h pneumoperitoneum (0.47 (0.33–0.60) vs 0.51 (0.38–0.64), p = 0.7), 2-h desufflation (0.20 (0.12–0.27) vs 0.21 (0.15–0.27), p = 0.7). Compared to baseline: (12 mmHg: 0.32 (0.18–0.45); 8 mmHg: 0.52 (0.36–0.68)) 2-h pneumoperitoneum and 2-h desufflation were significantly different (p < 0.001). All data are presented as geometric mean and confidence interval 95% (minimum–maximum). Continuous data was analyzed using repeated ANOVA. Between-group comparisons were analyzed using unpaired t-test and a general linear model; * p < 0.001, ** p < 0.05
Fig. 3
Fig. 3
Syndecan-1 expression of tubular epithelial cells in 12 mmHg and 8 mmHg groups. a, d, g Negative control. b Reduced intensity of proximal tubule syndecan-1 expression in the 12 mmHg group. c Proximal tubule syndecan-1 expression is weaker in the 12 mmHg group than in the 8 mmHg group. e Syndecan-1 expression between the distal tubule of the 12 mmHg group and f the 8 mmHg group was not different. h, i Syndecan-1 expression is negative in the glomerular and peritubular capillaries of both pressure groups. Original magnification was × 400, and red dashed boxes show a higher magnification. Red arrows indicate positive syndecan-1 expression, yellow arrows indicate negative syndecan-1 expression. j The H-score of proximal tubule syndecan-1 expression is lower in the 12 mmHg group than the 8 mmHg group (211.00 (199.05–219.67) vs 225.90 (215.46–231.50), p = 0.030), and is not significantly different between groups in the distal tubules (108.10 (98.49–118.31) vs 112.80 (94.53–128.12), p = 0.8). Data are presented as median (95% CI). The two groups were compared using Mann-Whitney test; * p < 0.05
Fig. 4
Fig. 4
Tubular epithelial VEGFR-2 expression in the 12 mmHg and 8 mmHg groups. a, d Negative control. b Increased proximal tubule VEGFR-2 expression in the 12 mmHg group. c Proximal tubule VEGFR-2 expression is stronger in the 12 mmHg group than in the 8 mmHg group. e Increased distal tubule VEGFR-2 expression in the 12 mmHg group. f Distal tubule VEGFR-2 expression is stronger in the 12 mmHg group than in the 8 mmHg group. Original magnification was × 400, and red dashed boxes show a higher magnification. Red arrows indicate positive VEGFR-2 expression. g The H-score of proximal tubule VEGFR-2 expression are significantly higher in the 12 mmHg group than in the 8 mmHg group (278.00 (269.37–282.05) vs 258.80 (248.93–268.91), p = 0.005) and distal tubule (288.80 (282.59–291.37) vs 279.40 (271.36–284.72), p = 0.02). Data are presented as median (95%CI). The two groups were compared using Mann-Whitney test; * p < 0.05
Fig. 5
Fig. 5
Peritubular vascular endothelial cell VEGFR-2 expression in 12 mmHg and 8 mmHg pneumoperitoneum pressure groups. a Negative control. b Strong peritubular capillary and artery VEGFR-2 expression in the 12 mmHg group. c Peritubular capillary and artery VEGFR-2 expression is stronger in the 12 mmHg group than in the 8 mmHg group. Original magnification was × 400, and red dashed boxes show a higher magnification. Red arrows indicate positive VEGFR-2 expression in the peritubular capillary endothelium, and yellow arrows indicate positive VEGFR-2 expression in the peritubular artery endothelium. d VEGFR-2 peritubular capillary expression score is significantly higher in the 12 mmHg group than 8 mmHg group (76.27 (66.53–86.02) vs 54.55 (48.56–60.53), p < 0.001). e Artery VEGFR-2 expression score is not significantly different between groups (93.27 (91.69–94.60) vs 83.27 (76.60–89.95), p = 0.2). Data were analyzed using Chi-square test for trends or Mann-Whitney test; * p < 0.001, ** p < 0.05
Fig. 6
Fig. 6
Renal tubule and peritubular capillary ultrastructure in the 12 mmHg and 8 mmHg pneumoperitoneum pressure groups. a Proximal tubular epithelial cells in the 12 mmHg group. Arrows show tenuous epithelial membranes and detached brush borders. b Proximal tubular epithelial cells in the 8 mmHg group. Arrows indicate a tight epithelial membrane and intact brush border. c Distal tubular epithelial cells in the 12 mmHg group show vacuolizations and a diffuse nuclear border. d Distal tubular epithelial cells in the 8 mmHg group show an intact nucleus and no vacuolization. e The peritubular capillary in the 12 mmHg group shows a swollen nucleus and edematous endothelial layer. The arrow shows a disrupted basement membrane. f The peritubular capillary endothelium in the 8 mmHg group shows an intact nucleus and endothelial layer. The arrow shows an intact basement membrane. The red box represents the details of images (e) and (f), and can be seen at a larger scale in (g) and (h); scale bar = 2 μm. N = nucleus, P = Podocyte, FP = Foot podocyte, BB = Brush Border, V = vacuole, BM = basement membrane, e = endothelium
Fig. 7
Fig. 7
The proposed mechanism of endothelial cell and kidney tubule injury that occurs in the standard and low pressure pneumoperitoneum. Normal baseline condition [A]. 1. Standard pressure (12 mmHg group) decreases interlobar artery blood flow and results in more changes from laminar flow to turbulent flow [B] than low pressure (8 mmHg group) [C]. 2. The inflammatory response in the 12 mmHg group produces higher IL-6 levels than the 8 mmHg group. 3. Interleukin-6 causes more syndecan-1 activation and shedding from the endothelial surface into the bloodstream in the 12 mmHg group than in the 8 mmHg group. 4. (a) Interleukin-6 and syndecan-1 stimulate VEGF-A synthesis and (b) binding to VEGFR-2 on the endothelial surface. 5. Activation of VEGFR-2 increases sVEGFR-2 levels more so in the 12 mmHg group than in the 8 mmHg group. 6. The expression of VEGFR-2 in tubular epithelial cells is higher in the 12 mmHg group, and the expression of syndecan-1 is lower in the 12 mmHg group than in the 8 mmHg group. 7. Due to inflammation, tubular epithelial cell injury stimulates the synthesis of KIM-1 molecules that will be released into the tubular lumen (urine). Figure courtesy of Dita Aditianingsih, MD, PhD. Permission to reuse the figure in any form must be obtained directly from Dr. Aditianingsih

Similar articles

Cited by

References

    1. Lentine KL, Lam NN, Axelrod D, Schitzler MA, Garg AX, Xiao H, et al. Perioperative complications after living kidney donation: a national study. Am J Transplant. 2016;16(6):1848–1857. doi: 10.1111/ajt.13687. - DOI - PubMed
    1. Liu N, Wazir R, Wang J, Wang KJ. Maximizing the donor pool: left versus right laparoscopic live donor nephrectomy—systematic review and meta-analysis. Int Urol Nephrol. 2014;46(8):1511–1519. doi: 10.1007/s11255-014-0671-8. - DOI - PubMed
    1. Smit M, Hofker HS, Leuvenink HG, Krikke C, Jongman RM, Zijlstra JG, van Meurs M. A human model of intra-abdominal hypertension: even slightly elevated pressure lead to increased acute systemic inflammation and signs of acute kidney injury. Crit Care. 2013;17(2):425. doi: 10.1186/cc12568. - DOI - PMC - PubMed
    1. Cobb WS, Burns JM, Kercher KW, Matthews BD, James Norton H, Todd HB. Normal intraabdominal pressure in healthy adults. J Surg Res. 2005;129(2):231–235. doi: 10.1016/j.jss.2005.06.015. - DOI - PubMed
    1. Kirkpatrick AW, Roberts DJ, De Waele J, Jaeschke R, Malbrain ML, De Keulenaer B, et al. Intra-abdominal hypertension and the abdominal compartment syndrome: updated consensus definitions and clinical practice guidelines from the world Society of the Abdominal Compartment Syndrome. Intensive Care Med. 2013;39(7):1190–1206. doi: 10.1007/s00134-013-2906-z. - DOI - PMC - PubMed

Publication types