. 2020 Feb 4;20(1):55.
doi: 10.1186/s12870-019-2012-7.

Drought tolerance of the grapevine, Vitis champinii cv. Ramsey, is associated with higher photosynthesis and greater transcriptomic responsiveness of abscisic acid biosynthesis and signaling

Affiliations

Drought tolerance of the grapevine, Vitis champinii cv. Ramsey, is associated with higher photosynthesis and greater transcriptomic responsiveness of abscisic acid biosynthesis and signaling

Noé Cochetel et al. BMC Plant Biol. .

Abstract

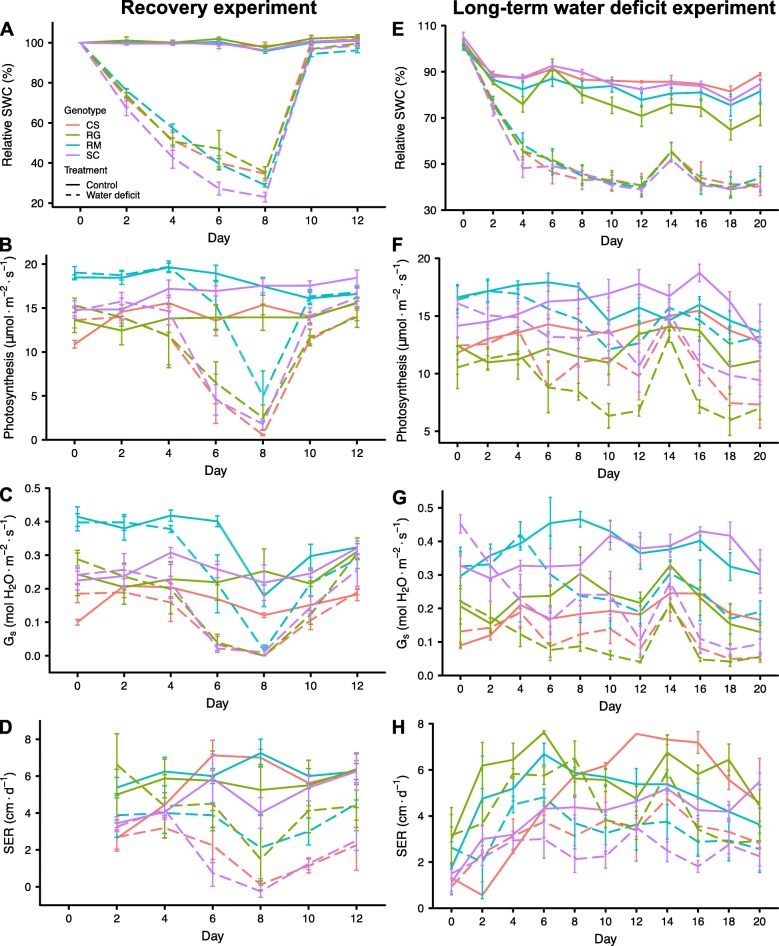
Background: Grapevine is an economically important crop for which yield and berry quality is strongly affected by climate change. Large variations in drought tolerance exist across Vitis species. Some of these species are used as rootstock to enhance abiotic and biotic stress tolerance. In this study, we investigated the physiological and transcriptomic responses to water deficit of four different genotypes that differ in drought tolerance: Ramsey (Vitis champinii), Riparia Gloire (Vitis riparia), Cabernet Sauvignon (Vitis vinifera), and SC2 (Vitis vinifera x Vitis girdiana).

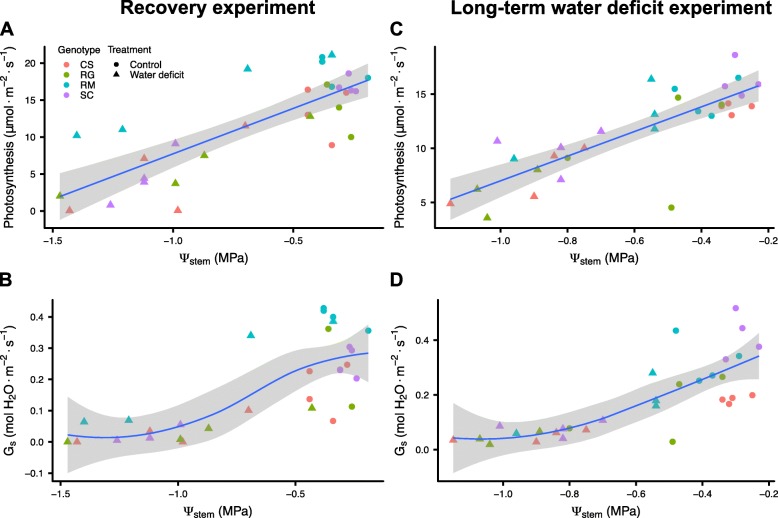
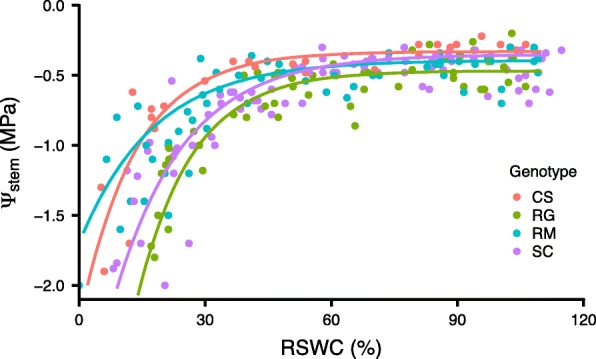
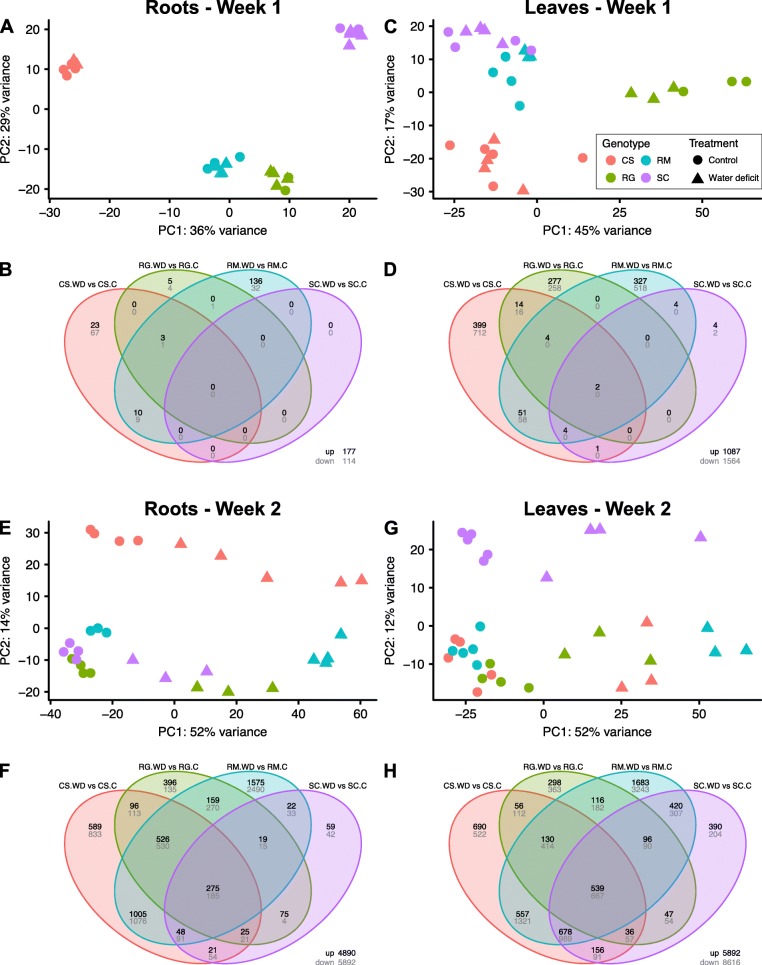
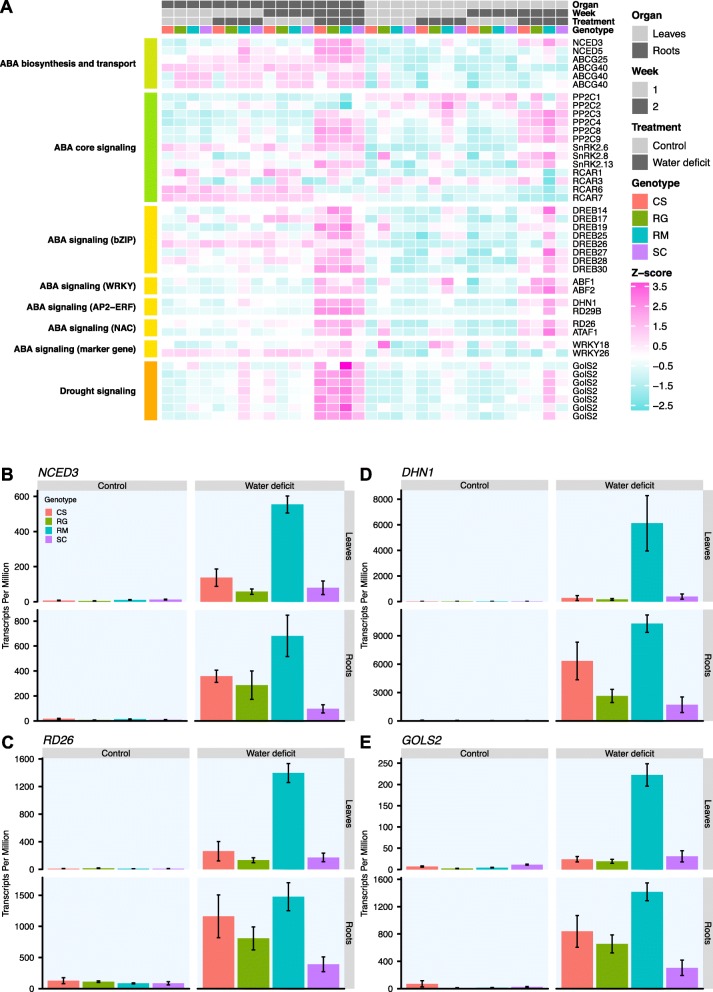
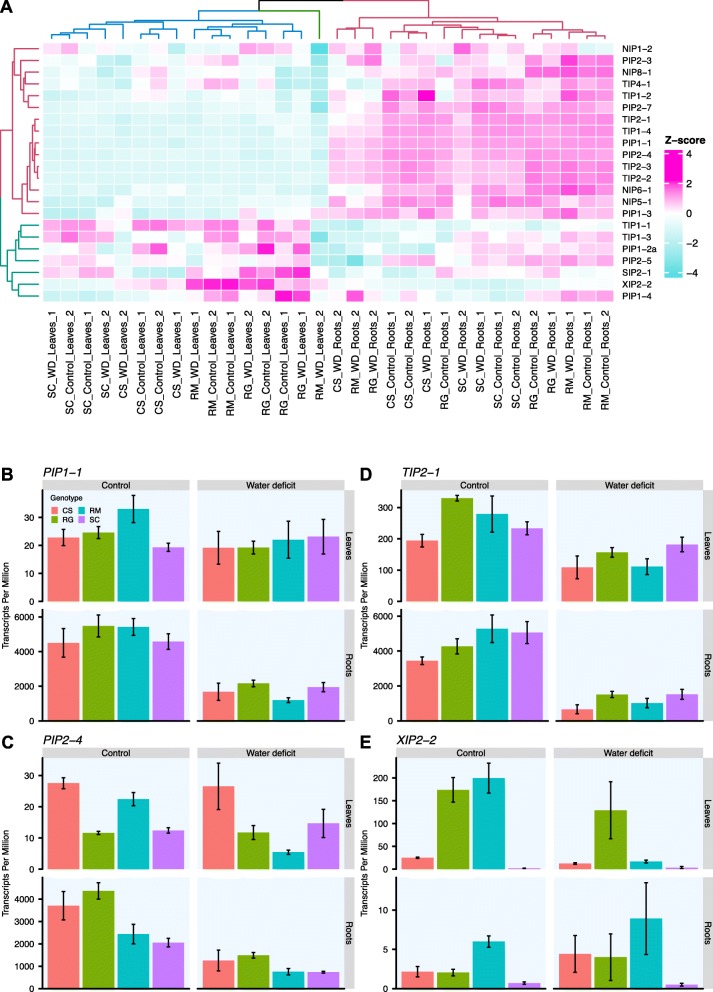
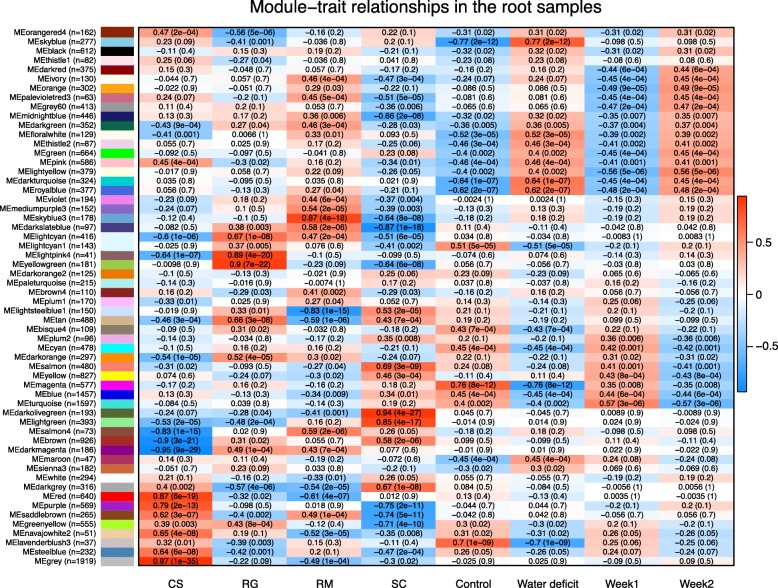
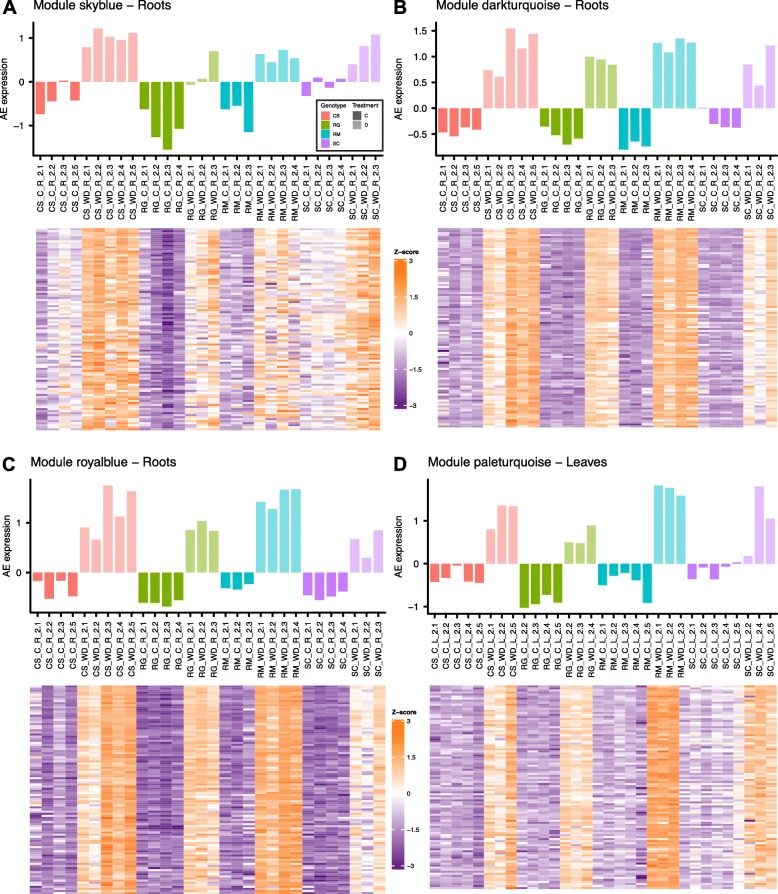
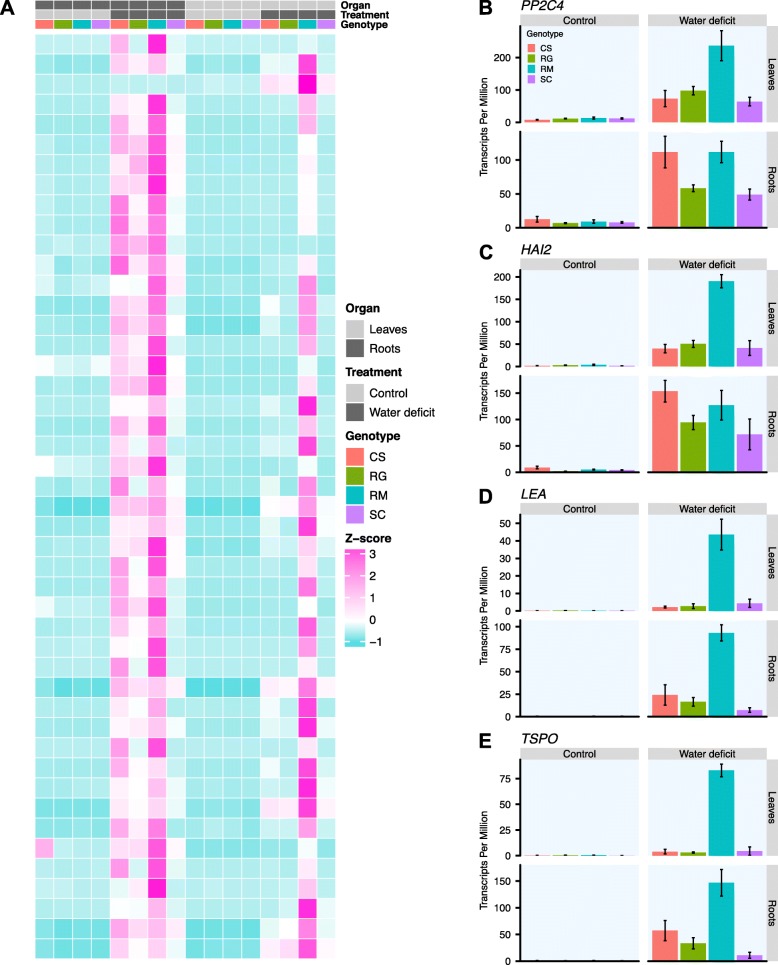
Results: Ramsey was particularly more drought tolerant than the other three genotypes. Ramsey maintained a higher stomatal conductance and photosynthesis at equivalent levels of moderate water deficit. We identified specific and common transcriptomic responses shared among the four different Vitis species using RNA sequencing analysis. A weighted gene co-expression analysis identified a water deficit core gene set with the ABA biosynthesis and signaling genes, NCED3, RD29B and ABI1 as potential hub genes. The transcript abundance of many abscisic acid metabolism and signaling genes was strongly increased by water deficit along with genes associated with lipid metabolism, galactinol synthases and MIP family proteins. This response occurred at smaller water deficits in Ramsey and with higher transcript abundance than the other genotypes. A number of aquaporin genes displayed differential and unique responses to water deficit in Ramsey leaves. Genes involved in cysteine biosynthesis and metabolism were constitutively higher in the roots of Ramsey; thus, linking the gene expression of a known factor that influences ABA biosynthesis to this genotype's increased NCED3 transcript abundance.

Conclusion: The drought tolerant Ramsey maintained higher photosynthesis at equivalent water deficit than the three other grapevine genotypes. Ramsey was more responsive to water deficit; its transcriptome responded at smaller water deficits, whereas the other genotypes did not respond until more severe water deficits were reached. There was a common core gene network responding to water deficit for all genotypes that included ABA metabolism and signaling. The gene clusters and sub-networks identified in this work represent interesting gene lists to explore and to better understand drought tolerance molecular mechanisms.

Keywords: Abscisic acid; Drought; Galactinol synthases; Grapevine; Transcriptomics; Vitis; Water deficit.


Conflict of interest statement

The authors declare that they have no competing interests. Grant R. Cramer is a member of the editorial board (section editor) of this journal.

Figures

Fig. 1
Fig. 1
Physiological measurements of one- to three-year-old vines of the four Vitis genotypes during recovery and WD experiments. a), e) Relative soil water content (Relative SWC), b), f) photosynthesis, c), g) stomatal conductance (Gs) and d), h) shoot elongation rate (SER), were measured every two days during both experiments. The first experiment consisted of a WD treatment during eight days followed by a recovery (a-d). The second experiment involved a WD treatment maintained at 50% RSWC for the stressed vines during 20 days (e-h). Red, green, blue and purple colors correspond to CS, RG, RM and SC, respectively. Data are means ± SE, n = four individual potted vines (except for RG in WD treatment with three individual potted vines for the long-term WD experiment)
Fig. 2
Fig. 2
Relationship between physiological measurements of the four Vitis genotypes during the recovery and WD experiments. a), c) Relation between photosynthesis and stem water potential. b), d) Relation between stomatal conductance and stem water potential. The first experiment consisted of a WD treatment during eight days followed by a recovery (a-b). The second experiment involved a WD treatment maintained at 50% RSWC for the stressed vines during 20 days (c-d). Red, green, blue and purple colors correspond to CS, RG, RM and SC, respectively. Data are represented by four individual potted vines (except for RG in WD treatment with three individual potted vines)
Fig. 3
Fig. 3
Stem water potential of the four Vitis species depending on the RSWC. Relationship between the stem water potential and the RSWC in the four different genotypes grown in small pots. Red, green, blue and purple colors correspond to CS, RG, RM and SC, respectively. They are represented by 27, 52, 59 and 78 individual potted vines, respectively. Non-linear regression models were predicted for each genotype using an exponential equation (One-phase association) and the corresponding regression curves were drawn
Fig. 4
Fig. 4
PCA and differential expression analysis results overview. a), c), e) and g) PCA representation of the samples collected from the roots or leaves after the first and the second week of treatment, respectively. Red, green, blue and purple colors correspond to CS, RG, RM and SC, respectively. Circles and triangles represent control and drought treatment, respectively. b), d), f) and h) Venn diagrams of the DEGs between drought and control vines. The color code used to differentiate the genotype is identical to that used for the PCAs
Fig. 5
Fig. 5
Sum of the enriched functional categories related to WD response. Enrichment analyses were performed on GO and BIN codes list extracted from the Venn diagrams of Fig. 2. The sum of the number of enriched functional categories related to ABA, response to water deprivation and galactinol synthase is represented. The vertical barplot shows the number of these enriched functional categories for the different Venn gene sets. The colored horizontal barplot shows the total number of enriched functional categories per genotype. Red, green, blue and purple colors correspond to CS, RG, RM and SC, respectively. (Details on the functional categories used can be found in the Additional file 7)
Fig. 6
Fig. 6
ABA-related genes expression in the four genotypes in response to water deficit. a) Heatmap representation of the gene expression of ABA-related genes across the different conditions. For each condition (Organ x Week x Treatment x Genotype), an average TPM value was calculated and log2 transformed. These expression values are represented as Z-scores (calculated per gene) on the heatmap and are colored from turquoise (low value) to pink (high value). Genes were clustered by process or protein family labeled on the left. At the top of the heatmap, a chart identifies the different conditions with leaves and roots in light grey and dark grey, respectively; week 1 and week 2 in light grey and dark grey, respectively; control and drought treatment in light grey and dark grey, respectively; and the genotypes CS, RG, RM and SC in red, green, blue and purple, respectively. Expression profiles of NCED3 (b), RD26 (c), DHN1 (d) and GOLS2 (e) after two weeks of treatment. Expression in control (left column) and WD treated vines (right column) for the leaves (top row) and the roots (bottom row) is represented in transcripts per million, mean ± SE, n = three-five individual vines. Genotypes are color coded as for the heatmap (a)
Fig. 7
Fig. 7
MIP-related genes expression in the four genotypes in response to water deficit. a) Clustering of the MIP family members. The heatmap represents transcript abundance of the MIP family genes, log2 transformed TPM values are represented as Z-scores calculated per gene ranging from turquoise to pink color for low to high values. Dendrograms were colored to distinguish the main clusters. Expressed genes were selected by removing genes with log2TPM < 1 in more than 75% of the samples. Expression profiles of PIP1–1 (b), PIP2–4 (c), TIP2–4 (d) and XIP2–2 (e) after two weeks of treatment. Expression in control (left column) and WD treated vines (right column) for the leaves (top row) and the roots (bottom row) is represented in transcripts per million, mean ± SE, n = three-five individual vines. The genotypes CS, RG, RM and SC are represented in red, green, blue and purple respectively
Fig. 8
Fig. 8
WGCNA on the root transcriptome. Correlation heatmap among the identified modules and the different experimental conditions for the root samples. Experimental traits are presented in columns and their association with module eigengene (rows) is represented by a Pearson’s correlation coefficient and a p-value within parentheses. The color of each cell ranges from blue indicating a high negative correlation to red for a high positive correlation. The number of genes included in each module is presented within parentheses
Fig. 9
Fig. 9
Gene expression in WGCNA modules. Eigengene average expression for the root modules “skyblue” (a), “darkturquoise” (b), “royalblue” (c) and for the leaf module “paleturquoise” (d) after two weeks of treatment. Samples are represented in columns. Red, green, blue and purple colors correspond to CS, RG, RM and SC, respectively. Solid and semi-transparent colors correspond to control (c) and water deficit (WD) treatments, respectively. Lower heatmaps represent Z-scores calculated per gene using log2 transformed TPM values of the top 100 most connected genes in the module (orange indicates high expression and purple low expression)
Fig. 10
Fig. 10
WGCNA on the leaf transcriptome. Correlation heatmap among the identified modules and the different experimental conditions for the leaf samples. Experimental traits are presented in columns and their association with module eigengene (rows) is represented by a Pearson’s correlation coefficient and a p-value within parentheses. The color of each cell ranges from blue indicating a high negative correlation to red for a high positive correlation. The number of genes included in each module is presented within parentheses
Fig. 11
Fig. 11
Expression profiles of DEGs induced by the WD in roots and leaves after two weeks of treatment in RM. a) Heatmap representation of the gene expression across the different conditions after two weeks of treatment. For each condition (Organ x Treatment x Genotype), an average TPM value was calculated and log2 transformed. These expression values are represented as Z-scores (calculated per gene) on the heatmap and are colored from turquoise (low value) to pink (high value). At the top of the heatmap, a chart identifies the different conditions with leaves and roots in light grey and dark grey respectively, control and water deficit treatment in light grey and dark grey respectively and the genotypes CS, RG, RM and SC in red, green, blue and purple respectively. Expression profiles of PP2C4 (b), HAI2 (c), LEA (d) and TSPO (e) after two weeks of treatment. Expression in the control (left column) and WD treated vines (right column) for the leaves (first row) and the roots (second row) is represented in transcripts per million (TPM), mean ± SE, n = three-five individual vines. The different genotypes are represented using the same color code used for the heatmap (a)

Similar articles

Cited by

References

    1. Fahad S, Bajwa AA, Nazir U, Anjum SA, Farooq A, Zohaib A, Sadia S, Nasim W, Adkins S, Saud S et al: Crop Production under Drought and Heat Stress: Plant Responses and Management Options. Front Plant Sci 2017, 8:1147. - PMC - PubMed
    1. Stagnari F, Galieni A, Pisante M: Drought stress effects on crop quality. In: Water Stress and Crop Plants: A Sustainable Approach. Edited by Ahmad P; 2016: 375–92.
    1. Tardieu F: Plant tolerance to water deficit: physical limits and possibilities for progress. C R Geosci 2005, 337(1-2):57–67.
    1. Chaves MM, Zarrouk O, Francisco R, Costa JM, Santos T, Regalado AP, Rodrigues ML, Lopes CM. Grapevine under deficit irrigation: hints from physiological and molecular data. Annals of Botany 2010;105(5):661–76. - PMC - PubMed
    1. Schultz HR. Differences in hydraulic architecture account for near-isohydric and anisohydric behaviour of two field-grown Vitis vinifera L. cultivars during drought. Plant, Cell & Environment 2003;26(8):1393–405.