

Linkage disequilibrium mapping for grain Fe and Zn enhancing QTLs useful for nutrient dense rice breeding
- PMID: 32019504
- PMCID: PMC7001215
- DOI: 10.1186/s12870-020-2262-4
Linkage disequilibrium mapping for grain Fe and Zn enhancing QTLs useful for nutrient dense rice breeding
Abstract
Background: High yielding rice varieties are usually low in grain iron (Fe) and zinc (Zn) content. These two micronutrients are involved in many enzymatic activities, lack of which cause many disorders in human body. Bio-fortification is a cheaper and easier way to improve the content of these nutrients in rice grain.
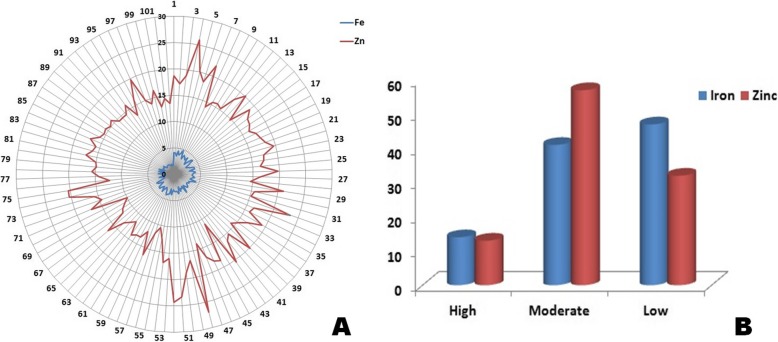
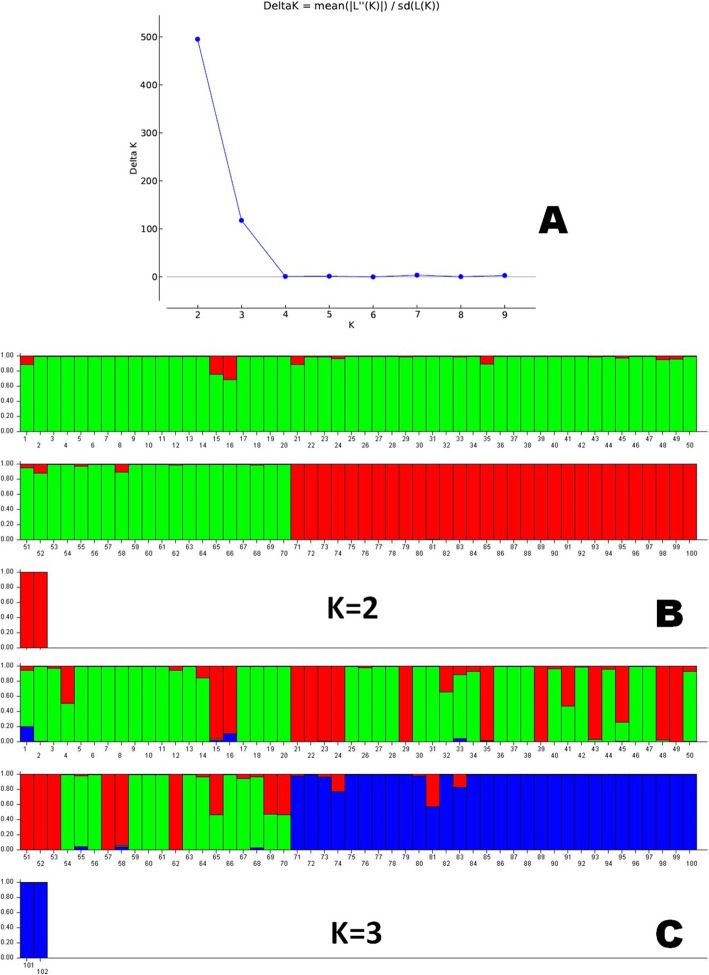
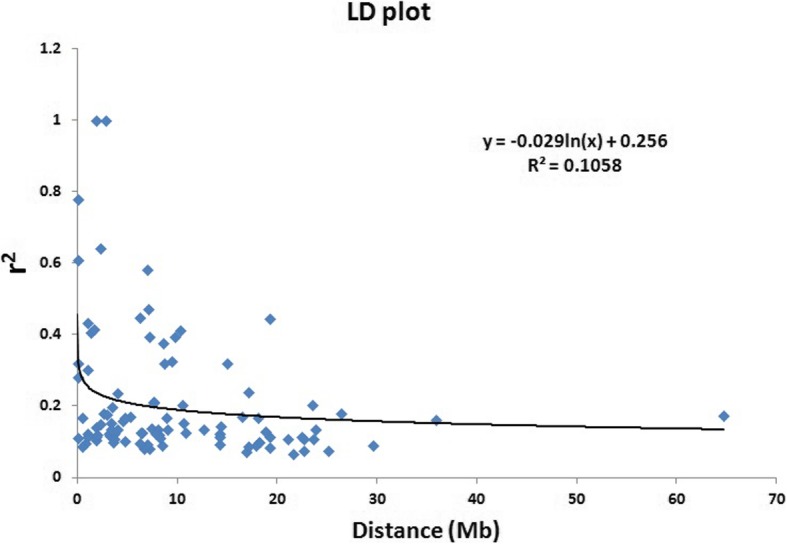
Results: A population panel was prepared representing all the phenotypic classes for grain Fe-Zn content from 485 germplasm lines. The panel was studied for genetic diversity, population structure and association mapping of grain Fe-Zn content in the milled rice. The population showed linkage disequilibrium showing deviation of Hardy-Weinberg's expectation for Fe-Zn content in rice. Population structure at K = 3 categorized the panel population into distinct sub-populations corroborating with their grain Fe-Zn content. STRUCTURE analysis revealed a common primary ancestor for each sub-population. Novel quantitative trait loci (QTLs) namely qFe3.3 and qFe7.3 for grain Fe and qZn2.2, qZn8.3 and qZn12.3 for Zn content were detected using association mapping. Four QTLs, namely qFe3.3, qFe7.3, qFe8.1 and qFe12.2 for grain Fe content were detected to be co-localized with qZn3.1, qZn7, qZn8.3 and qZn12.3 QTLs controlling grain Zn content, respectively. Additionally, some Fe-Zn controlling QTLs were co-localized with the yield component QTLs, qTBGW, OsSPL14 and qPN. The QTLs qFe1.1, qFe3.1, qFe5.1, qFe7.1, qFe8.1, qZn6, qZn7 and gRMm9-1 for grain Fe-Zn content reported in earlier studies were validated in this study.
Conclusion: Novel QTLs, qFe3.3 and qFe7.3 for grain Fe and qZn2.2, qZn8.3 and qZn12.3 for Zn content were detected for these two traits. Four Fe-Zn controlling QTLs and few yield component QTLs were detected to be co-localized. The QTLs, qFe1.1, qFe3.1, qFe5.1, qFe7.1, qFe8.1, qFe3.3, qFe7.3, qZn6, qZn7, qZn2.2, qZn8.3 and qZn12.3 will be useful for biofortification of the micronutrients. Simultaneous enhancement of Fe-Zn content may be possible with yield component traits in rice.
Keywords: Association study; Biofortification; Grain Fe content; Grain Zn content; Linkage disequilibrium.
Conflict of interest statement
The authors declare that they have no competing interests.
Figures


Similar articles
-
Association mapping reveals multiple QTLs for grain protein content in rice useful for biofortification.Mol Genet Genomics. 2019 Aug;294(4):963-983. doi: 10.1007/s00438-019-01556-w. Epub 2019 Apr 8. Mol Genet Genomics. 2019. PMID: 30963249
-
Identification of genomic region(s) responsible for high iron and zinc content in rice.Sci Rep. 2019 May 31;9(1):8136. doi: 10.1038/s41598-019-43888-y. Sci Rep. 2019. PMID: 31148549 Free PMC article.
-
Genetic Analysis of Agronomic Traits and Grain Iron and Zinc Concentrations in a Doubled Haploid Population of Rice (Oryza sativa L.).Sci Rep. 2020 Feb 10;10(1):2283. doi: 10.1038/s41598-020-59184-z. Sci Rep. 2020. PMID: 32042046 Free PMC article.
-
Improving Zinc and Iron Biofortification in Wheat through Genomics Approaches.Mol Biol Rep. 2022 Aug;49(8):8007-8023. doi: 10.1007/s11033-022-07326-z. Epub 2022 Jun 3. Mol Biol Rep. 2022. PMID: 35661970 Free PMC article. Review.
-
2Gs and plant architecture: breaking grain yield ceiling through breeding approaches for next wave of revolution in rice (Oryza sativa L.).Crit Rev Biotechnol. 2024 Feb;44(1):139-162. doi: 10.1080/07388551.2022.2112648. Epub 2022 Sep 29. Crit Rev Biotechnol. 2024. PMID: 36176065 Review.
Cited by
-
Transfer of Stress Resilient QTLs and Panicle Traits into the Rice Variety, Reeta through Classical and Marker-Assisted Breeding Approaches.Int J Mol Sci. 2023 Jun 27;24(13):10708. doi: 10.3390/ijms241310708. Int J Mol Sci. 2023. PMID: 37445885 Free PMC article.
-
Genetic Manipulation for Improved Nutritional Quality in Rice.Front Genet. 2020 Jul 24;11:776. doi: 10.3389/fgene.2020.00776. eCollection 2020. Front Genet. 2020. PMID: 32793287 Free PMC article. Review.
-
Association mapping of drought tolerance and agronomic traits in rice (Oryza sativa L.) landraces.BMC Plant Biol. 2021 Oct 23;21(1):484. doi: 10.1186/s12870-021-03272-3. BMC Plant Biol. 2021. PMID: 34686134 Free PMC article.
-
Mapping QTLs underpin nutrition components in aromatic rice germplasm.PLoS One. 2020 Jun 11;15(6):e0234395. doi: 10.1371/journal.pone.0234395. eCollection 2020. PLoS One. 2020. PMID: 32525930 Free PMC article.
-
Genetic mapping of physiological traits associated with terminal stage drought tolerance in rice.BMC Genet. 2020 Jul 14;21(1):76. doi: 10.1186/s12863-020-00883-x. BMC Genet. 2020. PMID: 32664865 Free PMC article.
References
-
- Allen LH, De Benoist B, Dary O, Hurrell R, editors. Guidelines on food fortification with micronutrients. Geneva: World Health Organization; 2006. pp. 124–125.
-
- Qui LC, Pan J, Dan BW. The mineral nutrient component and characteristic of color and white brown rice. Chinese J Rice Sci. 1995;7(2):95–100.
-
- Ahmed SA, Borua I, Das D. Chemical composition of scented rice. Oryza. 1998;35(2):167–169.
-
- Graham R, Senadhira D, Beebe S, Iglesias C, Monasterio I. Breeding for micronutrient density in edible portions of staple food crops: conventional approaches. Field Crops Res. 1999;60:57–80. doi: 10.1016/S0378-4290(98)00133-6. - DOI
MeSH terms
Substances
LinkOut - more resources
Full Text Sources
Medical
