. 2020 Feb 4;11(1):e02273-19.
doi: 10.1128/mBio.02273-19.

Deciphering the Rules Underlying Xenogeneic Silencing and Counter-Silencing of Lsr2-like Proteins Using CgpS of Corynebacterium glutamicum as a Model

Affiliations

Deciphering the Rules Underlying Xenogeneic Silencing and Counter-Silencing of Lsr2-like Proteins Using CgpS of Corynebacterium glutamicum as a Model

Johanna Wiechert et al. mBio. .

Abstract

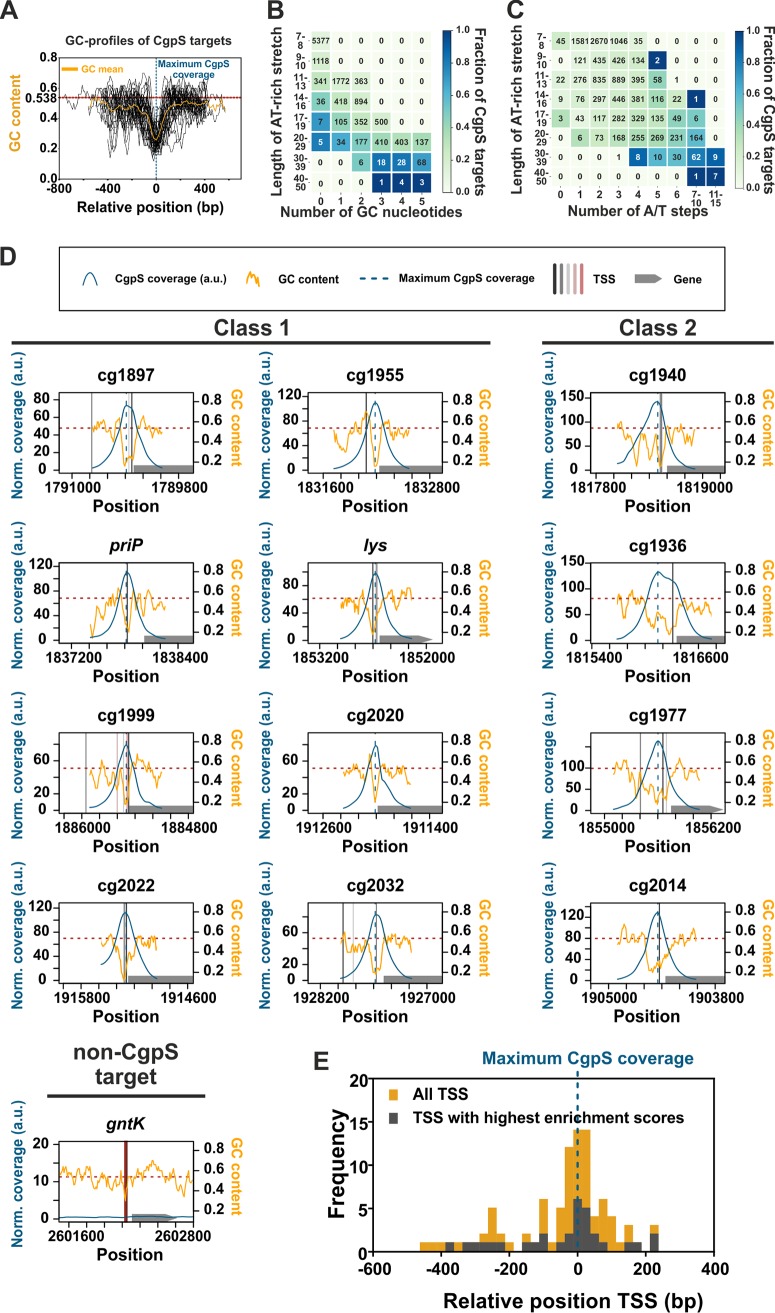
Lsr2-like nucleoid-associated proteins play an important role as xenogeneic silencers (XS) of horizontally acquired genomic regions in actinobacteria. In this study, we systematically analyzed the in vivo constraints underlying silencing and counter-silencing of the Lsr2-like protein CgpS in Corynebacterium glutamicum Genome-wide analysis revealed binding of CgpS to regions featuring a distinct drop in GC profile close to the transcription start site (TSS) but also identified an overrepresented motif with multiple A/T steps at the nucleation site of the nucleoprotein complex. Binding of specific transcription factors (TFs) may oppose XS activity, leading to counter-silencing. Following a synthetic counter-silencing approach, target gene activation was realized by inserting operator sites of an effector-responsive TF within various CgpS target promoters, resulting in increased promoter activity upon TF binding. Analysis of reporter constructs revealed maximal counter-silencing when the TF operator site was inserted at the position of maximal CgpS coverage. This principle was implemented in a synthetic toggle switch, which features a robust and reversible response to effector availability, highlighting the potential for biotechnological applications. Together, our results provide comprehensive insights into how Lsr2 silencing and counter-silencing shape evolutionary network expansion in this medically and biotechnologically relevant bacterial phylum.IMPORTANCE In actinobacteria, Lsr2-like nucleoid-associated proteins function as xenogeneic silencers (XS) of horizontally acquired genomic regions, including viral elements, virulence gene clusters in Mycobacterium tuberculosis, and genes involved in cryptic specialized metabolism in Streptomyces species. Consequently, a detailed mechanistic understanding of Lsr2 binding in vivo is relevant as a potential drug target and for the identification of novel bioactive compounds. Here, we followed an in vivo approach to investigate the rules underlying xenogeneic silencing and counter-silencing of the Lsr2-like XS CgpS from Corynebacterium glutamicum Our results demonstrated that CgpS distinguishes between self and foreign by recognizing a distinct drop in GC profile in combination with a short, sequence-specific motif at the nucleation site. Following a synthetic counter-silencer approach, we studied the potential and constraints of transcription factors to counteract CgpS silencing, thereby facilitating the integration of new genetic traits into host regulatory networks.

Keywords: AT-rich DNA; Lsr2; actinobacteria; counter-silencing; horizontal gene transfer; regulatory networks; xenogeneic silencing.


Figures

FIG 1
FIG 1
CgpS preferentially binds to long and consecutive AT stretches. (A) Overlay and calculated mean (orange curve) of GC profiles of CgpS target promoters located within the CGP3 prophage (n = 35) (4). Profiles were calculated by a rolling mean with a window size of 50 bp and a step size of 10 bp. The GC profiles of the promoters were normalized regarding the orientation and position of the maximal CgpS binding peak (blue line), which was defined for all sequences as position 0. The mean GC content of the C. glutamicum genome (69) is shown as a red line (53.8%). (B and C) Genome-wide analysis of CgpS binding to consecutive AT stretches of different lengths considering G/C interruptions (occurrence of G or C within an AT stretch) (B) or number of A/T steps (allowing up to five G/C interruptions) (C). A/T steps are defined as alterations of A to T and vice versa. The value in the array represents the number of stretches found in the C. glutamicum genome fitting the respective criteria, while the color indicates the fraction of CgpS targets per array. (D) Inverse correlation of GC profiles and CgpS coverage of CgpS target promoters. CgpS coverage obtained from previous ChAP-seq experiments (4) was calculated with a rolling mean with a window size of 50 and a step size of 10. All identified TSS (see Materials and Methods and Text S1) are shown in Table S1 and represented as vertical black, gray, and red lines (mapped according to their enrichment scores: black > shades of gray > red). Positions of maximal CgpS coverage and average GC content are shown as described for panel A. The corresponding genes are shown as gray arrows. Promoters were grouped into two classes based on the width of the region bound by CgpS (class 1 promoters, 500 to 850 bp, typically featuring one distinct drop in GC profile; class 2 promoters, >850 bp, often broader and containing multiple drops in GC content). As a negative control, the non-CgpS target promoter of the gene gntK is shown. a.u., arbitrary units. (E) Frequency distribution of relative positions of all new identified TSS (yellow) of CgpS target promoters referred to the position of maximal CgpS binding. TSS showing the highest enrichment scores per gene are highlighted in gray.
FIG 2
FIG 2
Synthetic in vivo approach to dissect the relevance of the GC profile and a sequence-specific binding motif for CgpS silencing. (A) Identified 10-bp CgpS binding motif using MEME-ChIP (41) analysis found within 51 of 54 CgpS target promoters (4) (E value, 5.2 × 10⁻⁹). The bar plot represents the genome-wide fraction of CgpS targets in AT stretches of different length, allowing up to 5 G/C interruptions with or without the identified motif. (B) CgpS silencing of synthetic constructs (Pcg1999_A-T/G-C and Pcg1999_rand), based on a 50-bp core promoter region (green box) of the phage gene cg1999. The fixed 50-bp DNA sequence covered the −10 and −35 box, positions of the TSS (40), and potential binding motif (gray box). The adjacent sequence (N upstream, 260 bp; N downstream, 48 bp) was either adjusted to maintain the native density of AT stretches (Pcg1999_A-T/G-C, exchange of A to T and G to C) or randomized (Pcg1999_rand). (C) Surface plasmon resonance analysis of CgpS binding to the synthetic promoter Pcg1999_A-T/G-C (423 bp) compared to that of the negative-control Pcg3336 (424 bp) and the corresponding native CgpS target Pcg1999 (423 bp). ka, association constant; kd, dissociation constant. (D) CgpS silencing of synthetic constructs based on fixed 70- to 100-bp promoter regions of the phage gene lys. The 70-bp sequence (green box) covered the −10 and −35 box and TSS but only half of the putative motif. The 80-bp region (green and orange boxes) covered the motif completely, and the 100-bp region (all boxes) additionally covered the position of maximal CgpS coverage. The adjacent sequences (N upstream, 304 bp; N downstream, 70 to 100 bp) were adjusted to maintain the native density of AT stretches (A-T/G-C). (B and D) Reporter outputs (Venus) of the native and corresponding synthetic variants (plasmid backbone pJC1) in wild-type and Δphage (ΔcgpS) strains after 5 h of cultivation in a microtiter cultivation system in CGXII medium containing 100 mM glucose. Shown are mean values and standard deviations from biological triplicates. All synthetic sequences are listed in Table S2I.
FIG 3
FIG 3
Synthetic approach to study disruptive counter-silencing. (A) Schematic overview of a native CgpS target promoter (phage) and the corresponding synthetic counter-silencer construct. (B) Signal inversion by synthetic counter-silencing. Comparison of the reporter outputs of PgntK, the native target promoter of the regulator of gluconate catabolism GntR (43), and the synthetic GntR-dependent counter-silencer promoter Plys_CS_0. C. glutamicum wild-type strains harboring the plasmid-based constructs (pJC1) were cultivated in the absence of the effector (111 mM glucose) or in its presence (100 mM gluconate) in a microtiter cultivation system. Graphs represent the means and error bars the standard deviations from biological triplicates. Backscatter and fluorescence were measured at 15-min intervals. (C) Counter-silencing efficiency of different phage promoters with inserted GntR binding sites located directly upstream of the position of maximal CgpS binding. Promoters were grouped into two classes based on the width of the region bound by CgpS (class 1 promoters, 500 to 850 bp, often one distinct drop in GC profile; class 2 promoters, >850 bp, often broader or multiple drops in GC content). CgpS coverage and GC profiles of two representative promoters are shown. The highest-ranked TSS are marked as vertical gray lines and the position of maximal CgpS binding as vertical blue lines. GC profiles of all used phage promoters are shown in Fig. 1D. C. glutamicum wild-type cells harboring the plasmid-based (pJC1) counter-silencers were cultivated in the presence (100 mM gluconate) or absence (100 mM glucose) of the effector molecule gluconate in a microtiter cultivation system. Fold change ratios of Venus reporter outputs in the absence and in the presence of the effector were calculated based on the specific reporter outputs after 5 h of cultivation (Fig. S1A). Dots represent the means and error bars the standard deviations from at least biological triplicates. Yellow dots demonstrate counter-silencing (activated by GntR binding), while blue dots represent repression (repressed by GntR binding). Promoters, which did not show significant changes in reporter output, are shown as gray dots (t test; P < 0.05).
FIG 4
FIG 4
Silencing is mediated by CgpS, while counter-silencing depends of GntR binding. (A) Reporter output (venus expression) of different C. glutamicum strains carrying the native Plys promoter or the counter-silencing design Plys_CS_0 after 5 h of cultivation. Both constructs were analyzed in C. glutamicum wild-type cells, in a gntR1-gntR2 double deletion strain, in the prophage-free strain Δphage (lacking the phage-encoded cgpS), and in its variant with reintegrated cgpS under the control of its native promoter (Δphage::PcgpS-cgpS). Cells were cultivated in a microtiter cultivation system in CGXII medium supplemented with either 100 mM gluconate (+ effector) or 100 mM fructose (− effector). (B) EMSA of GntR binding to DNA fragments covering the synthetic counter-silencer promoter Plys_CS_0 (533 bp, 14 nM) or the native phage promoter Plys (518 bp, 14 nM). (C) Impact of the effector molecule gluconate on binding of GntR to the synthetic counter-silencer construct. EMSA was performed as described for panel B, but GntR and the DNA fragments were incubated either in the presence of the effector (100 mM gluconate) or in its absence (100 mM glucose). (D) Surface plasmon resonance analysis of CgpS binding kinetics to biotinylated DNA fragments covering the negative-control Pcg3336 (424 bp), the native phage promoter Plys (424 bp), or the corresponding synthetic counter-silencer construct (439 bp) that were captured onto a streptavidin-coated sensor chip. Different concentrations of CgpS were passed over the chip using a contact (association) time of 180 s, followed by a 420-s dissociation phase. The increase in response units correlates with increasing CgpS concentrations.
FIG 5
FIG 5
Impact of GntR operator position on inducibility of Plys-based promoter constructs. (A) Inverse correlation of GC profile and CgpS binding coverage (4) of the phage promoter Plys. The transcriptional start site (TSS) and the position of maximal CgpS binding are shown as vertical lines. Binding site positions (also used in panels B and C) refer to the sequence base associated with maximal CgpS binding. The position directly upstream of this nucleotide was defined as position 0. (B) Impact of inserted GntR binding site position on specific reporter outputs in the presence (gluconate) and absence (glucose) of the effector molecule after 5 h of cultivation. Positions of TSS and maximal CgpS coverage are marked by horizontal lines, and the range of the putative CgpS binding motif is shown. (C) Impact of GntR binding site position on counter-silencing efficiency of Plys-based promoter constructs. Ratio of specific reporter outputs, shown in panel B, were used for the calculation of their inducibility (fold change). Cells harboring the plasmid-based synthetic promoter constructs were grown in CGXII medium supplemented with either 111 mM glucose or 100 mM gluconate. Bars (B) and dots (C) represent the means and error bars the standard deviations from at least biological triplicates.
FIG 6
FIG 6
Implementation of PgntK and Plys_CS_0 in a genetic toggle switch. (A) Scheme of the designed toggle switch based on the native GntR target promoter PgntK and the synthetic GntR-dependent Plys counter-silencer construct. In order to monitor their activities, the promoters were fused to different reporter genes (Plys_CS_0-venus and PgntK-e2-crimson). The promoter reporter gene fusions were oriented in opposite directions and separated by a short terminator sequence. (B) Dynamic switch between both reporter outputs. C. glutamicum wild-type cells harboring the plasmid-based toggle were cultivated in a microfluidic cultivation system (46) with continuous supply of CGXII medium supplemented either 111 mM glucose or 100 mM gluconate and analyzed by time-lapse microscopy at 20-min intervals. Switch of carbon source supply was performed after the first 17 h. This time point was defined as T0. The graphs show the specific fluorescence of three independent microcolonies (circles, squares, and triangles) over time, and images display one representative colony.

Similar articles

Cited by

References

    1. Ochman H, Lawrence JG, Groisman EA. 2000. Lateral gene transfer and the nature of bacterial innovation. Nature 405:299–304. doi:10.1038/35012500. - DOI - PubMed
    1. Dorman CJ. 2014. H-NS-like nucleoid-associated proteins, mobile genetic elements and horizontal gene transfer in bacteria. Plasmid 75:1–11. doi:10.1016/j.plasmid.2014.06.004. - DOI - PubMed
    1. Navarre WW. 2016. The impact of gene silencing on horizontal gene transfer and bacterial evolution. Adv Microb Physiol 69:157–186. doi:10.1016/bs.ampbs.2016.07.004. - DOI - PubMed
    1. Pfeifer E, Hünnefeld M, Popa O, Polen T, Kohlheyer D, Baumgart M, Frunzke J. 2016. Silencing of cryptic prophages in Corynebacterium glutamicum. Nucleic Acids Res 44:10117–10131. doi:10.1093/nar/gkw692. - DOI - PMC - PubMed
    1. Vogan AA, Higgs PG. 2011. The advantages and disadvantages of horizontal gene transfer and the emergence of the first species. Biol Direct 6:1. doi:10.1186/1745-6150-6-1. - DOI - PMC - PubMed

Publication types

MeSH terms

LinkOut - more resources