. 2020 Feb 4;11(1):e02752-19.
doi: 10.1128/mBio.02752-19.

Three-Dimensional Light Sheet Fluorescence Microscopy of Lungs To Dissect Local Host Immune-Aspergillus fumigatus Interactions

Affiliations

Three-Dimensional Light Sheet Fluorescence Microscopy of Lungs To Dissect Local Host Immune-Aspergillus fumigatus Interactions

Jorge Amich et al. mBio. .

Abstract

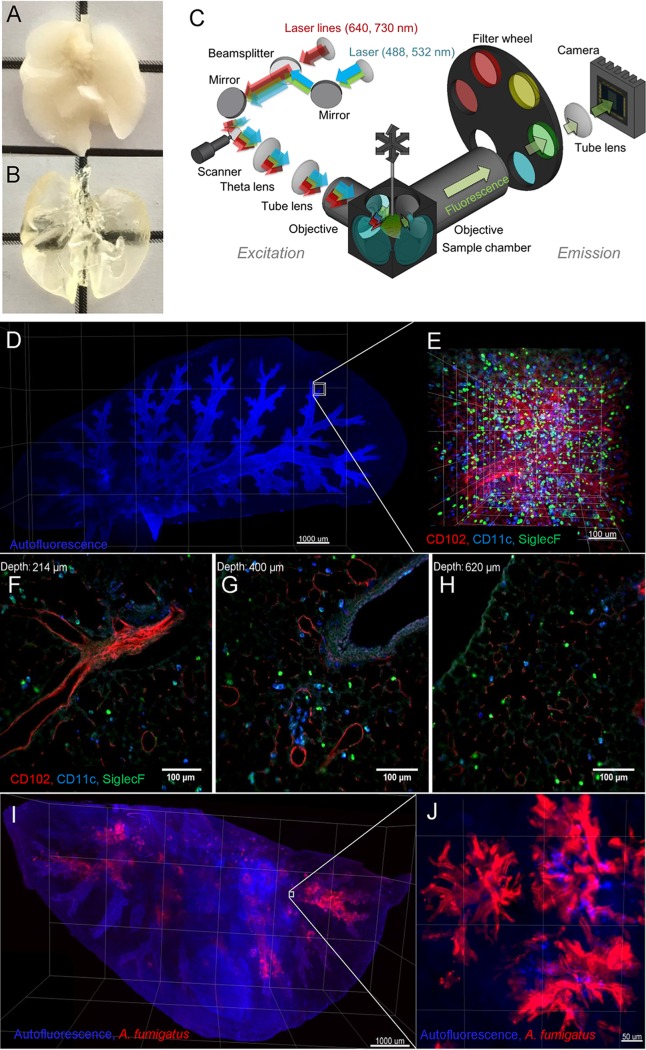
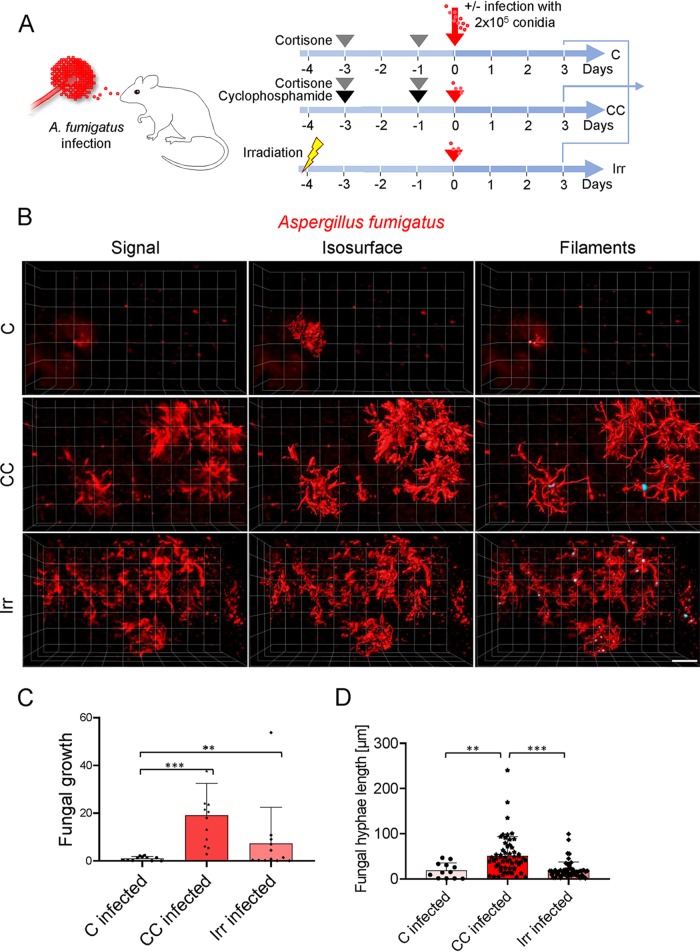
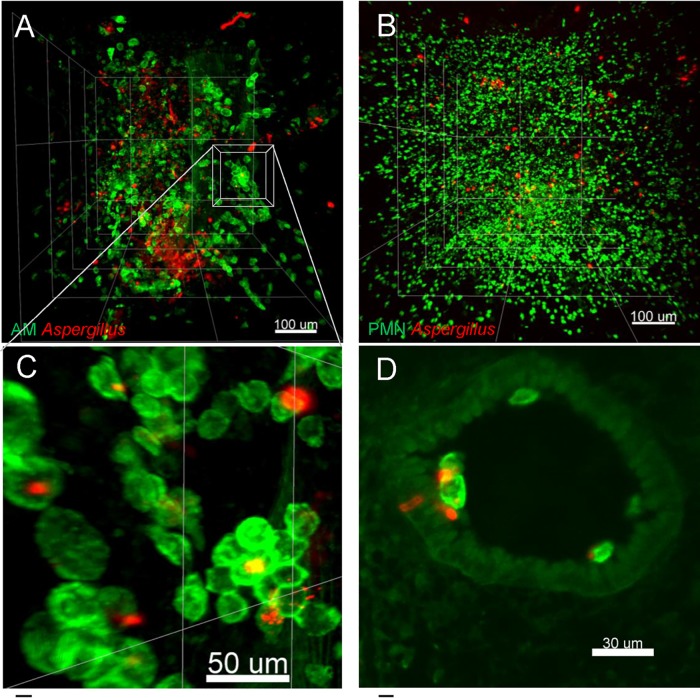
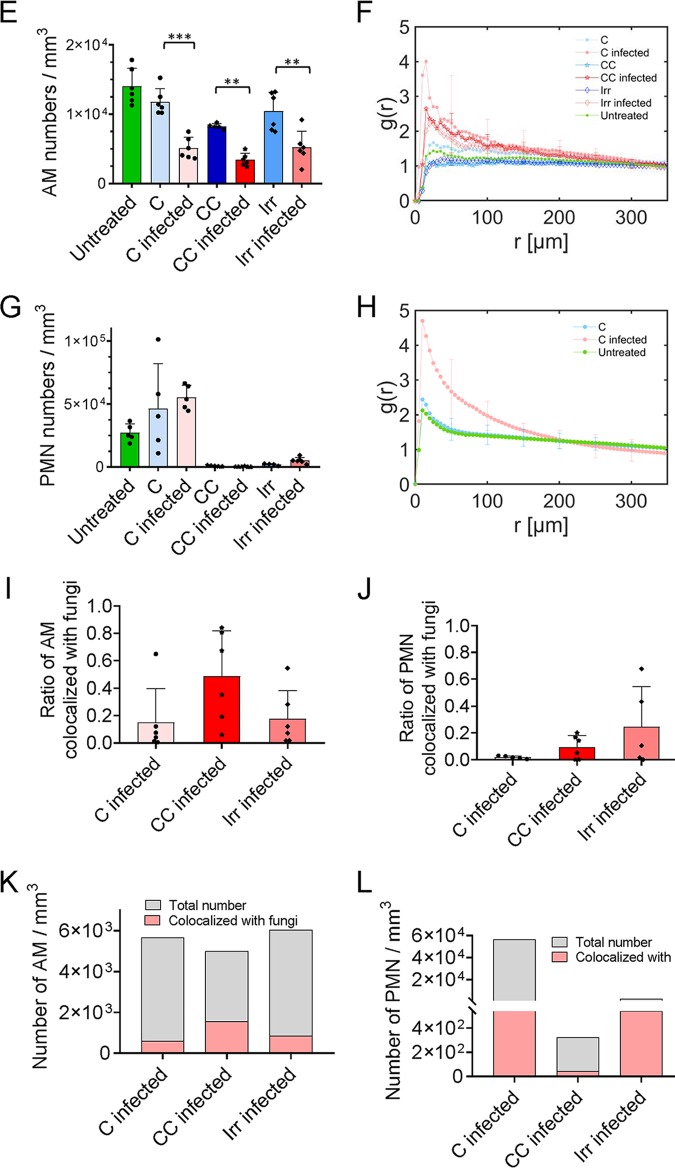
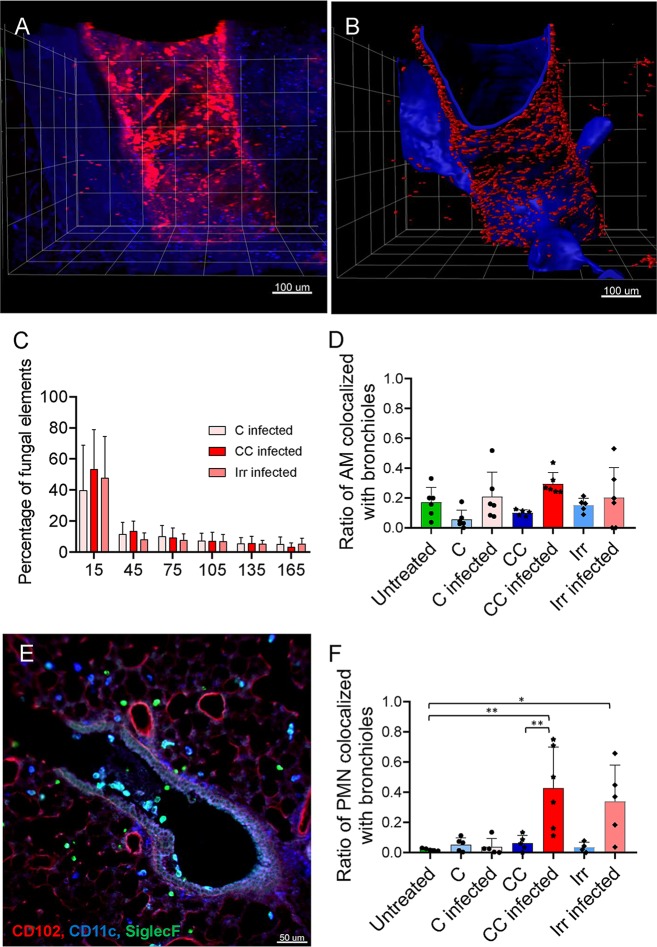
Aspergillus fumigatus is an opportunistic fungal pathogen that can cause life-threatening invasive lung infections in immunodeficient patients. The cellular and molecular processes of infection during onset, establishment, and progression of A. fumigatus infections are highly complex and depend on both fungal attributes and the immune status of the host. Therefore, preclinical animal models are of paramount importance to investigate and gain better insight into the infection process. Yet, despite their extensive use, commonly employed murine models of invasive pulmonary aspergillosis are not well understood due to analytical limitations. Here, we present quantitative light sheet fluorescence microscopy (LSFM) to describe fungal growth and the local immune response in whole lungs at cellular resolution within its anatomical context. We analyzed three very common murine models of pulmonary aspergillosis based on immunosuppression with corticosteroids, chemotherapy-induced leukopenia, or myeloablative irradiation. LSFM uncovered distinct architectures of fungal growth and degrees of tissue invasion in each model. Furthermore, LSFM revealed the spatial distribution, interaction, and activation of two key immune cell populations in antifungal defense: alveolar macrophages and polymorphonuclear neutrophils. Interestingly, the patterns of fungal growth correlated with the detected effects of the immunosuppressive regimens on the local immune cell populations. Moreover, LSFM demonstrates that the commonly used intranasal route of spore administration did not result in complete intra-alveolar deposition, as about 80% of fungal growth occurred outside the alveolar space. Hence, characterization by LSFM is more rigorous than by previously used methods employing murine models of invasive pulmonary aspergillosis and pinpoints their strengths and limitations.IMPORTANCE The use of animal models of infection is essential to advance our understanding of the complex host-pathogen interactions that take place during Aspergillus fumigatus lung infections. As in the case of humans, mice need to suffer an immune imbalance in order to become susceptible to invasive pulmonary aspergillosis (IPA), the most serious infection caused by A. fumigatus There are several immunosuppressive regimens that are routinely used to investigate fungal growth and/or immune responses in murine models of invasive pulmonary aspergillosis. However, the precise consequences of the use of each immunosuppressive model for the local immune populations and for fungal growth are not completely understood. Here, to pin down the scenarios involving commonly used IPA models, we employed light sheet fluorescence microscopy (LSFM) to analyze whole lungs at cellular resolution. Our results will be valuable to optimize and refine animal models to maximize their use in future research.

Keywords: Aspergillus fumigatus; host immune response; host-pathogen interactions; in vivo fungal growth; invasive aspergillosis; light sheet fluorescence microscopy; lung immunity; lung infection; microscopy/imaging; murine models of invasive pulmonary aspergillosis; whole-organ imaging.


Figures

FIG 1
FIG 1
Light sheet fluorescence microscopy (LSFM) maps the three-dimensional structural microarchitecture of intact lungs with cellular resolution. (A and B) Whole lungs explanted from a perfused mouse before (A) and after (B) clearing. (C) Optical setup of LSFM. (D) Autofluorescence signal of a murine lung lobe acquired with LSFM. Several fields of view were acquired and stitched together (5× objective, scale bar = 1 mm). (E) Zoomed LSFM image precisely depicts immune cell subpopulations at cellular resolution (20× objective, scale bar = 100 μm). Alveolar macrophages (SiglecF+ CD11c+, light blue) are evenly distributed in the anatomical microenvironment of the lung. (SiglecF CD11c+ cells correspond predominantly to dendritic cells and SiglecF+ CD11c cells to eosinophils.) CD102+ blood vessels are depicted in red. (F, G, and H) Representative two-dimensional optical sections of the lung of an imaging stack at penetration depths of 214 μm (F), 400 μm (G), and 620 μm (H). (I) Lung lobe of a neutropenic mouse infected with 2 × 105 A. fumigatus conidia (5× objective, scale bar = 1 mm). (J) Foci of fungal growth (red) can be observed throughout the tissue as intense cloudy signals at the terminal bronchi (not detected with isotype control antibody) (20× objective, scale bar = 50 μm).
FIG 2
FIG 2
The level of immunosuppression determines local fungal spread. (A) Mouse models of immunosuppression employed to study invasive aspergillosis. (B) LSFM reveals 3D structures of fungal growth in different models of immunosuppression. Images represent fluorescence signal detected with LSFM (left), calculated isosurfaces of fungal hyphae formation (middle), and filament allocation (right) for a representative focus of fungal growth in each immunosuppression model (20× objective, scale bar = 100 μm) (C) Percentage of fungal mass infiltrating lung tissue. Lungs were imaged at 5 to 6 locations to cover the whole lung lobule, and two mice per condition were analyzed. (D) Length of all A. fumigatus filaments (hyphae) detected in the lungs of two mice per condition were analyzed. For data presented in all graphs, One-way ANOVA with multiple comparisons was applied. (***, P < 0.0001; **, 0.01 < P < 0.001).
FIG 3
FIG 3
Quantitative image analysis reveals distribution and interaction of immune cells with A. fumigatus in 3D lung environment. (A and B) Representative 3D images acquired and reconstructed from lungs of infected mice treated with cortisone (C) or with cyclophosphamide and cortisone (CC) or after myeloablative whole-body irradiation (Irr). (A) AMs (SiglecF+ CD11c+; depicted in green) and A. fumigatus (JF5 antibody staining; depicted in red) after irradiation and infection. (B) PMNs (CD11b+ Ly6G+) in infected mouse treated with cortisone are visualized in green. (C) Magnification of the image in panel A reveals strong AM clustering. (D) Fungal spores that had been engulfed by AMs germinated in close proximity to lung epithelial cells upon infection and irradiation. (E) AM numbers quantified with LSFM image analysis in the lungs of mice before and after A. fumigatus infection under different immunosuppressive regimens. AM numbers did not decrease after C and Irr treatments and declined only slightly after CC treatment. AM numbers markedly declined upon infection. (F) Pair correlation function [g(r)] calculated for AMs using multiple LSFM images from two mice. Correlation data reveal that the AMs clustered 3 days after infection, suggesting recruitment to sites of A. fumigatus infection (paired signed rank test, P < 0.001) (G) Number of PMNs in the lungs of immunosuppressed mice assessed by quantitative analysis of LSFM images. The number of PMNs increased after C treatment and was maintained upon infection. PMNs were virtually eliminated after CC and Irr treatments. (H) Pair correlation function for PMNs was calculated only from mice treated with cortisone only, due to the extremely low numbers in CC and Irr mice (paired signed rank test, P < 0.001). PMNs show a clustered distribution upon infection, indicating active recruitment to the infection sites. (I to L) Direct colocalization of AMs and PMNs with A. fumigatus indicates that these immune cells ingested fungal material, supporting the hypothesis of an active immune response against invasive aspergillosis. All quantifications were made from two mice per condition and 2 to 3 3D stacks per mouse. One-way ANOVA with Tukey’s multiple comparisons was applied (**, P < 0.01; ***, P < 0.001).
FIG 3
FIG 3
Quantitative image analysis reveals distribution and interaction of immune cells with A. fumigatus in 3D lung environment. (A and B) Representative 3D images acquired and reconstructed from lungs of infected mice treated with cortisone (C) or with cyclophosphamide and cortisone (CC) or after myeloablative whole-body irradiation (Irr). (A) AMs (SiglecF+ CD11c+; depicted in green) and A. fumigatus (JF5 antibody staining; depicted in red) after irradiation and infection. (B) PMNs (CD11b+ Ly6G+) in infected mouse treated with cortisone are visualized in green. (C) Magnification of the image in panel A reveals strong AM clustering. (D) Fungal spores that had been engulfed by AMs germinated in close proximity to lung epithelial cells upon infection and irradiation. (E) AM numbers quantified with LSFM image analysis in the lungs of mice before and after A. fumigatus infection under different immunosuppressive regimens. AM numbers did not decrease after C and Irr treatments and declined only slightly after CC treatment. AM numbers markedly declined upon infection. (F) Pair correlation function [g(r)] calculated for AMs using multiple LSFM images from two mice. Correlation data reveal that the AMs clustered 3 days after infection, suggesting recruitment to sites of A. fumigatus infection (paired signed rank test, P < 0.001) (G) Number of PMNs in the lungs of immunosuppressed mice assessed by quantitative analysis of LSFM images. The number of PMNs increased after C treatment and was maintained upon infection. PMNs were virtually eliminated after CC and Irr treatments. (H) Pair correlation function for PMNs was calculated only from mice treated with cortisone only, due to the extremely low numbers in CC and Irr mice (paired signed rank test, P < 0.001). PMNs show a clustered distribution upon infection, indicating active recruitment to the infection sites. (I to L) Direct colocalization of AMs and PMNs with A. fumigatus indicates that these immune cells ingested fungal material, supporting the hypothesis of an active immune response against invasive aspergillosis. All quantifications were made from two mice per condition and 2 to 3 3D stacks per mouse. One-way ANOVA with Tukey’s multiple comparisons was applied (**, P < 0.01; ***, P < 0.001).
FIG 4
FIG 4
Interaction analysis of fungal burden and bronchioles reveals heterogeneous distribution of fungal spores in murine lungs. (A) 3D representation of A. fumigatus distribution and lung morphology with images acquired and reconstructed from infected lungs. (B) Isosurfaces of fungi and bronchioles were reconstructed from anti-A. fumigatus JF5 antibody signals and antipodoplanin staining. Isosurface data were used to compute distances between fungi and bronchioles of lung. (C) Distance distributions of fungi and bronchioles are presented as a histogram for different treatments. In all treatment groups, a high proportion (∼60%) of spores were found to be in close proximity to bronchioles, indicating that a vast majority of the infective conidia did not reach the alveoli. Quantification (D and F) and imaging (E) representing colocalization of AMs (D and E) and PMNs (F) with bronchioles were performed, and quantification data are shown as ratios of total cell numbers (D and F). Notably, the results revealed a low ratio of AMs localized in the bronchioles under steady-state conditions that increased upon infection for C-treated and CC-treated mice. Furthermore, upon infection, the ratio of PMNs significantly increased in CC-treated and Irr-treated mice. All quantifications were made from two mice per condition and 2 to 3 3D stacks per mouse. One-way ANOVA Tukey’s multiple comparisons was applied (*, P < 0.05).

Similar articles

Cited by

References

    1. Kosmidis C, Denning DW. 2015. The clinical spectrum of pulmonary aspergillosis. Postgrad Med J 91:403–410. doi:10.1136/postgradmedj-2014-206291rep. - DOI - PubMed
    1. Paulussen C, Hallsworth JE, Álvarez-Pérez S, Nierman WC, Hamill PG, Blain D, Rediers H, Lievens B. 2017. Ecology of aspergillosis: insights into the pathogenic potency of Aspergillus fumigatus and some other Aspergillus species. Microb Biotechnol 10:296–322. doi:10.1111/1751-7915.12367. - DOI - PMC - PubMed
    1. Bongomin F, Gago S, Oladele R, Denning D. 2017. Global and multi-national prevalence of fungal diseases—estimate precision. J Fungi (Basel) 3:57. doi:10.3390/jof3040057. - DOI - PMC - PubMed
    1. Desoubeaux G, Cray C. 2018. Animal models of aspergillosis. Comp Med 68:109–123. - PMC - PubMed
    1. Brock M, Jouvion G, Droin-Bergère S, Dussurget O, Nicola M-A, Ibrahim-Granet O. 2008. Bioluminescent Aspergillus fumigatus, a new tool for drug efficiency testing and in vivo monitoring of invasive aspergillosis. Appl Environ Microbiol 74:7023–7035. doi:10.1128/AEM.01288-08. - DOI - PMC - PubMed

Publication types

MeSH terms

Substances