. 2020 Feb 4;11(1):e03234-19.
doi: 10.1128/mBio.03234-19.

RNA-Seq Analysis Illuminates the Early Stages of Plasmodium Liver Infection

Affiliations

RNA-Seq Analysis Illuminates the Early Stages of Plasmodium Liver Infection

Maria Toro-Moreno et al. mBio. .

Abstract

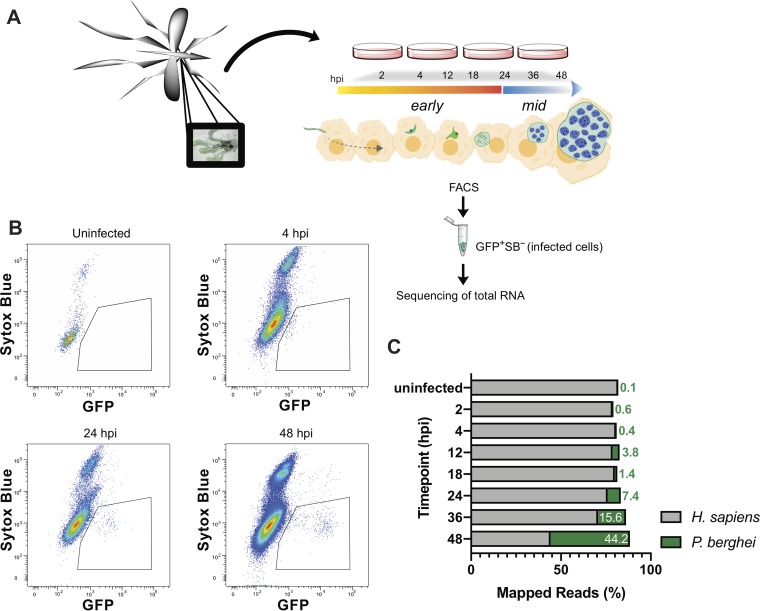
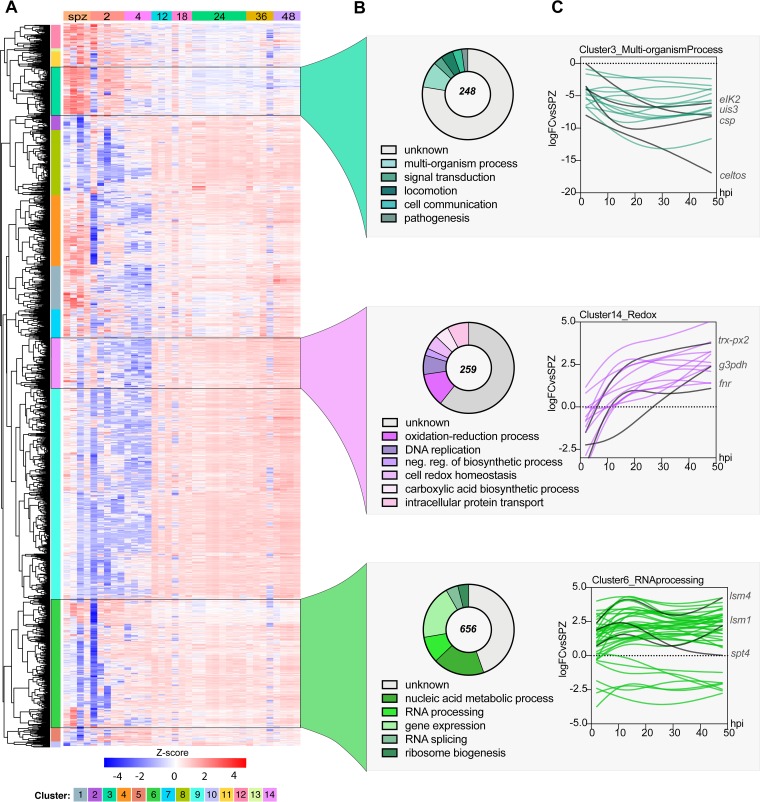
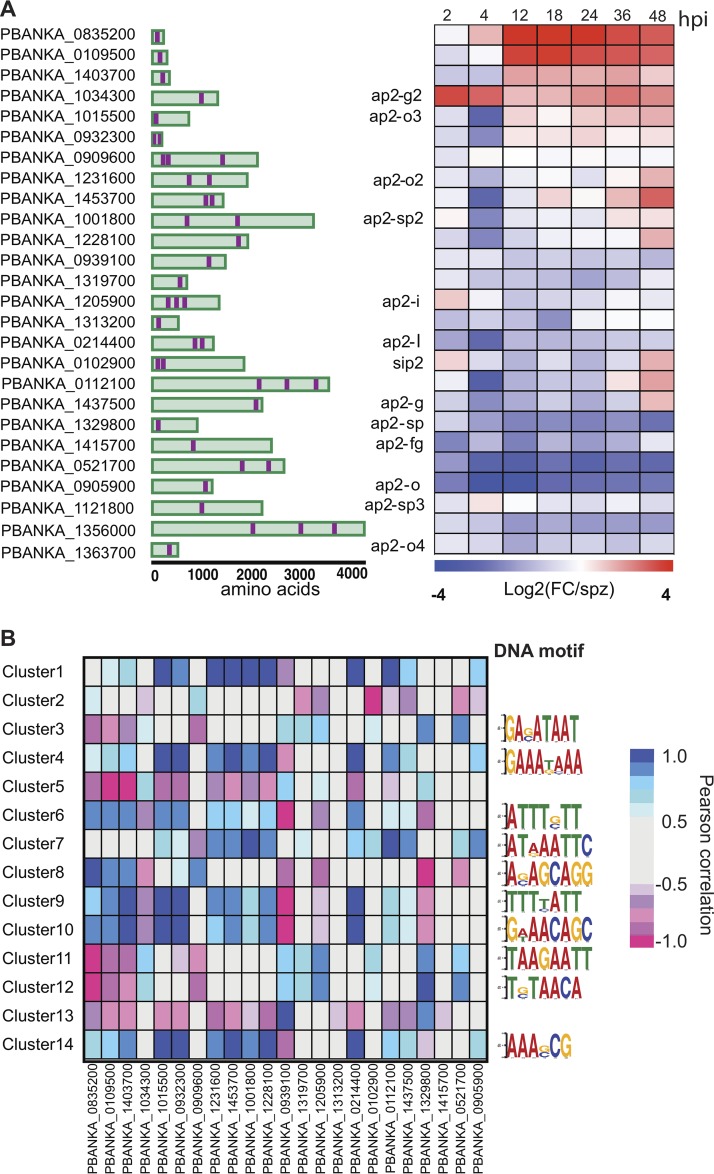
The apicomplexan parasites Plasmodium spp. are the causative agents of malaria, a disease that poses a significant global health burden. Plasmodium spp. initiate infection of the human host by transforming and replicating within hepatocytes. This liver stage (LS) is poorly understood compared to other Plasmodium life stages, which has hindered our ability to target these parasites for disease prevention. We conducted an extensive transcriptome sequencing (RNA-Seq) analysis throughout the Plasmodium berghei LS, covering as early as 2 h postinfection (hpi) and extending to 48 hpi. Our data revealed that hundreds of genes are differentially expressed at 2 hpi and that multiple genes shown to be important for later infection are upregulated as early as 12 hpi. Using hierarchical clustering along with coexpression analysis, we identified clusters functionally enriched for important liver-stage processes such as interactions with the host cell and redox homeostasis. Furthermore, some of these clusters were highly correlated to the expression of ApiAP2 transcription factors, while showing enrichment of mostly uncharacterized DNA binding motifs. This finding indicates potential LS targets for these transcription factors, while also hinting at alternative uncharacterized DNA binding motifs and transcription factors during this stage. Our work presents a window into the previously undescribed transcriptome of Plasmodium upon host hepatocyte infection to enable a comprehensive view of the parasite's LS. These findings also provide a blueprint for future studies that extend hypotheses concerning LS gene function in P. berghei to human-infective Plasmodium parasites.IMPORTANCE The LS of Plasmodium infection is an asymptomatic yet necessary stage for producing blood-infective parasites, the causative agents of malaria. Blocking the liver stage of the life cycle can prevent clinical malaria, but relatively less is known about the parasite's biology at this stage. Using the rodent model P. berghei, we investigated whole-transcriptome changes occurring as early as 2 hpi of hepatocytes. The transcriptional profiles of early time points (2, 4, 12, and 18 hpi) have not been accessible before due to the technical challenges associated with liver-stage infections. Our data now provide insights into these early parasite fluxes that may facilitate establishment of infection, transformation, and replication in the liver.

Keywords: P. berghei; Plasmodium; RNA sequencing; liver stage; malaria; transcription.


Figures

FIG 1
FIG 1
Experimental design for RNA-Seq of early and mid-stages of P. berghei liver infection. (A) Experimental design schematic. Female Anopheles mosquitoes were dissected and GFP-expressing P. berghei sporozoites were harvested to infect HuH7 or HepG2 cells. Cells were harvested 2, 4, 12, 18, 24, 36, or 48 hpi and FACS sorted to enrich viable P. berghei-infected cells for RNA collection. (B) Representative flow cytometry fluorescence dot plots indicating the population of GFP+ Sytox Blue cells that were collected at various time points. (C) Relative percentage of transcripts mapping to P. berghei or H. sapiens at various times postinfection. Uninfected samples correspond to naive uninfected cells treated with debris from dissected male Anopheles mosquito salivary glands. The data are medians of two to five biological replicates.
FIG 2
FIG 2
Overview of Plasmodium transcriptome analyses. Hierarchical clustering of gene expression data sets from different stages of the Plasmodium life cycle (7, 8, 25, 31, 33, 51–53). Data sets generated in this study are in bold. Clustering is based on Spearman correlation coefficients calculated and plotted using R. Refer to Table S1 in the supplemental material for information regarding the data sets used to generate this figure.
FIG 3
FIG 3
Dynamic gene regulation throughout liver-stage P. berghei development. (A and B) Total (A) and upregulated (red)/downregulated (blue) (B) differentially expressed (DE) transcripts (q < 0.01) are shown at each time point. (C) Expression profiles of 1,197 genes upregulated at 24, 36, and 48 hpi ordered based on the time point they were first observed to be upregulated. Expression is shown as the log2-fold change (Log2FC) versus sporozoite samples. (D) The proportions of genes upregulated throughout late-stage development (24, 36, and 48 hpi) are divided by when they were first observed to be upregulated (2, 4, or 12 hpi).
FIG 4
FIG 4
Coexpression analysis identifies enriched processes during P. berghei development in hepatocytes. (A) Hierarchical clustering using a correlation distance with complete linkage of all genes significant (FDR ≤ 5%) in at least one of the analyses. Gene expression is z-score transformed. (B) GO enrichment analysis (biological process) of enriched clusters 3, 14, and 6. Representative GO terms (P < 0.01) and their respective number of genes (pie chart) are shown. The total numbers of genes in each cluster are shown at the center of the pie chart. (C) Spline models of gene expression data for all the genes in the top-scoring GO term in each cluster. Key genes in each group and their expression patterns are highlighted in red. Refer to Data Set S2 in the supplemental material for complete GO analysis of all clusters.
FIG 5
FIG 5
Expression of P. berghei AP2 transcription factors in the liver stage. (A) Gene IDs of the 26 AP2 transcription factors in the P. berghei genome, their respective protein architecture schematic (with AP2 displayed in purple), and their corresponding expression as the log2-fold change versus spz at each time point in the LS. (B) Heat map of Pearson correlations between AP2 transcription factors and the average expression of all genes in each cluster (left). The top most enriched DNA motif for each cluster discovered through the DREME pipeline is shown (right). Refer to Data Set S2 for a complete set of motifs and their respective enrichment scores.

Similar articles

Cited by

References

    1. Prudêncio M, Rodriguez A, Mota MM. 2006. The silent path to thousands of merozoites: the Plasmodium liver stage. Nat Rev Microbiol 4:849–856. doi:10.1038/nrmicro1529. - DOI - PubMed
    1. Aly ASI, Vaughan AM, Kappe S. 2009. Malaria parasite development in the mosquito and infection of the mammalian host. Annu Rev Microbiol 63:195–221. doi:10.1146/annurev.micro.091208.073403. - DOI - PMC - PubMed
    1. World Health Organization. 2019. World malaria report. World Health Organization, Geneva, Switzerland.
    1. Josling GA, Williamson KC, Llinás M. 2018. Regulation of sexual commitment and gametocytogenesis in malaria parasites. Annu Rev Microbiol 72:501–519. doi:10.1146/annurev-micro-090817-062712. - DOI - PMC - PubMed
    1. Tarun AS, Peng X, Dumpit RF, Ogata Y, Silva-Rivera H, Camargo N, Daly TM, Bergman LW, Kappe S. 2008. A combined transcriptome and proteome survey of malaria parasite liver stages. Proc Natl Acad Sci U S A 105:305–310. doi:10.1073/pnas.0710780104. - DOI - PMC - PubMed

Publication types

Substances