. 2020 Mar 4;40(10):2166-2177.
doi: 10.1523/JNEUROSCI.2480-19.2020. Epub 2020 Feb 4.

Direct Activation of Primary Motor Cortex during Subthalamic But Not Pallidal Deep Brain Stimulation

Affiliations

Direct Activation of Primary Motor Cortex during Subthalamic But Not Pallidal Deep Brain Stimulation

Luke A Johnson et al. J Neurosci. .

Abstract

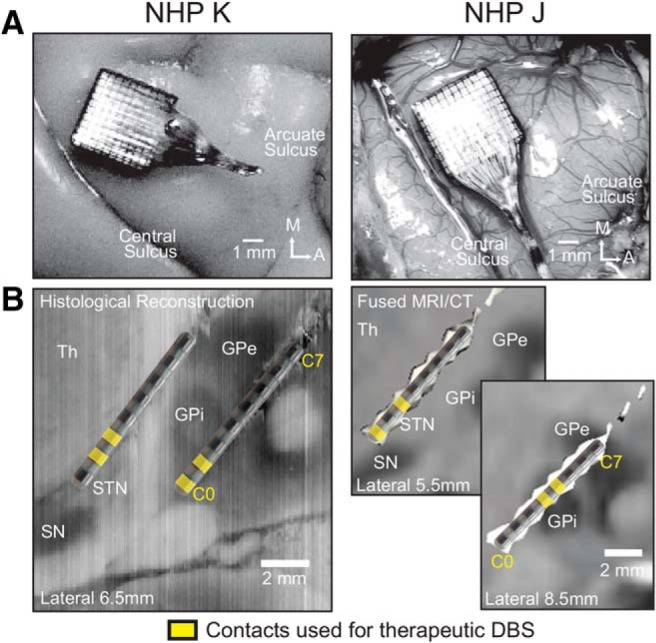
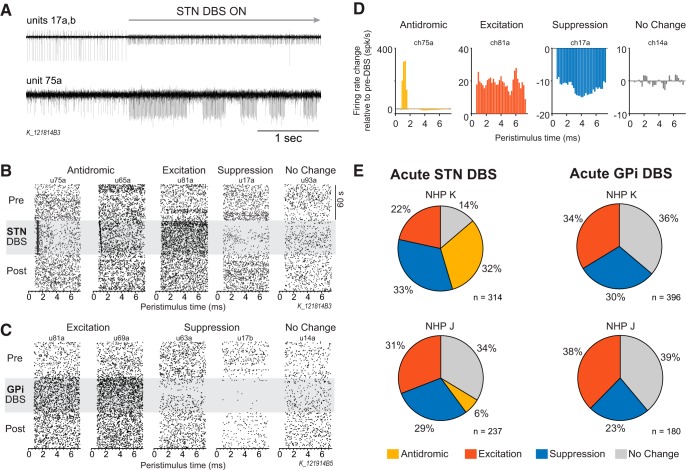
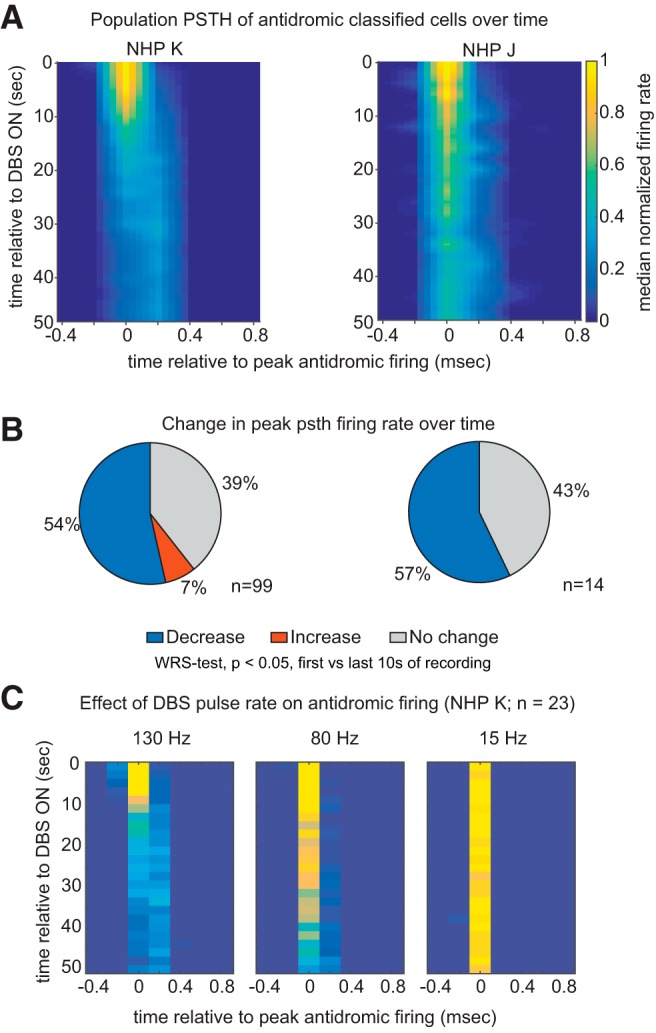
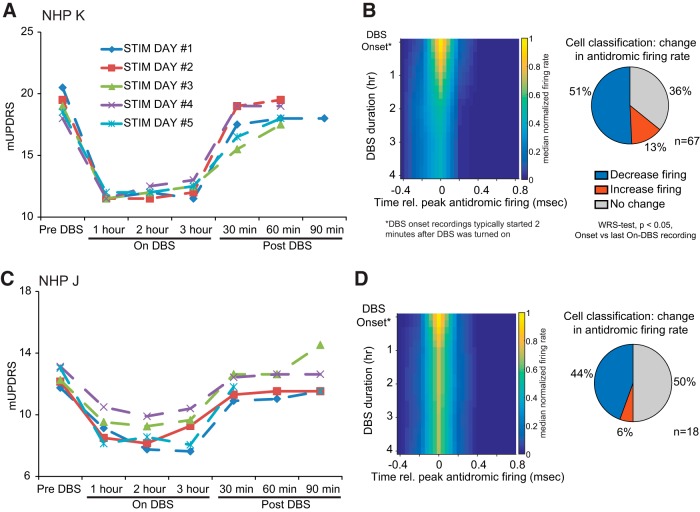
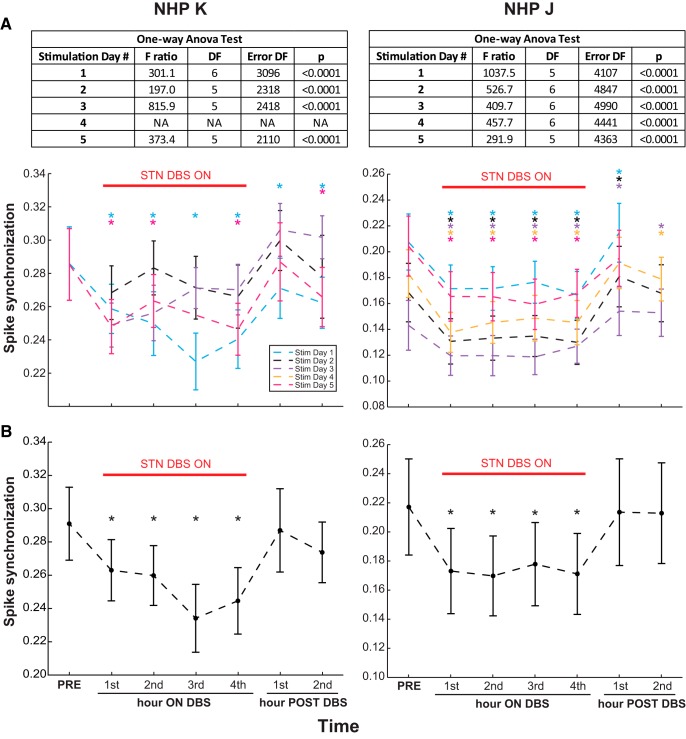
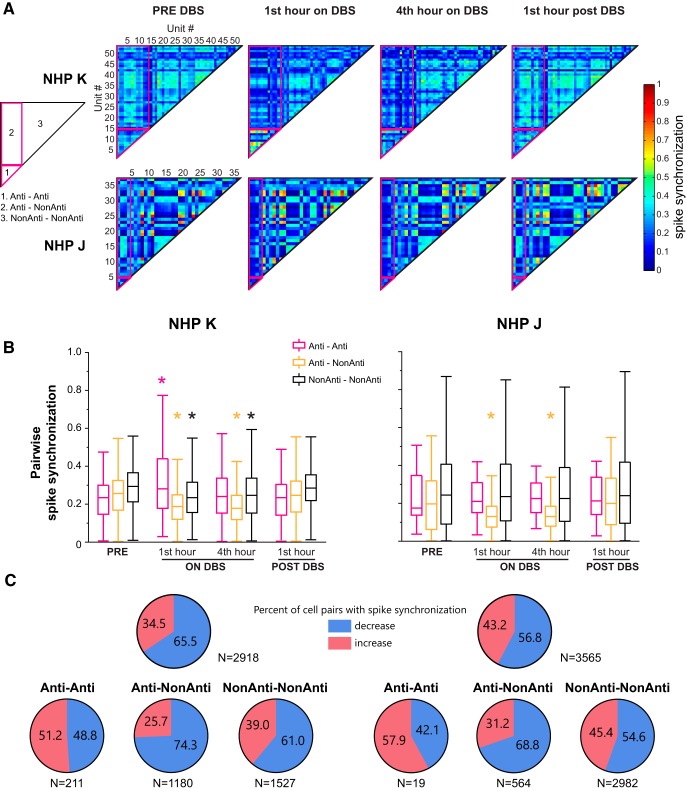
Deep brain stimulation (DBS) of the subthalamic nucleus (STN) and globus pallidus internus (GPi) is an effective treatment for parkinsonian motor signs. Though its therapeutic mechanisms remain unclear, it has been suggested that antidromic activation of the primary motor cortex (M1) plays a significant role in mediating its therapeutic effects. This study tested the hypothesis that antidromic activation of M1 is a prominent feature underlying the therapeutic effect of STN and GPi DBS. Single-unit activity in M1 was recorded using high-density microelectrode arrays in two parkinsonian nonhuman primates each implanted with DBS leads targeting the STN and GPi. Stimulation in each DBS target had similar therapeutic effects, however, antidromic activation of M1 was only observed during STN DBS. Although both animals undergoing STN DBS had similar beneficial effects, the proportion of antidromic-classified cells in each differed, 30 versus 6%. Over 4 h of continuous STN DBS, antidromic activation became less robust, whereas therapeutic benefits were maintained. Although antidromic activation waned over time, synchronization of spontaneous spiking in M1 was significantly reduced throughout the 4 h. Although we cannot discount the potential therapeutic role of antidromic M1 activation at least in the acute phase of STN DBS, the difference in observed antidromic activation between animals, and target sites, raise questions about its hypothesized role as the primary mechanism underlying the therapeutic effect of DBS. These results lend further support that reductions in synchronization at the level of M1 are an important factor in the therapeutic effects of DBS.SIGNIFICANCE STATEMENT Recently there has been great interest and debate regarding the potential role of motor cortical activation in the therapeutic mechanisms of deep brain stimulation (DBS) for Parkinson's disease. In this study we used chronically implanted high density microelectrode arrays in primary motor cortex (M1) to record neuronal population responses in parkinsonian nonhuman primates during subthalamic nucleus (STN) DBS and globus pallidus internus (GPi) DBS. Our results suggest a contribution of antidromic activation of M1 during STN DBS in disrupting synchronization in cortical neuronal populations; however, diminishing antidromic activity over time, and differences in observed antidromic activation between animals and target sites with antidromic activation not observed during GPi DBS, raise questions about its role as the primary mechanism underlying the therapeutic effect of DBS.

Keywords: Parkinson's disease; basal ganglia; deep brain stimulation; hyperdirect pathway; nonhuman primate; primary motor cortex.


Conflict of interest statement

Conflicts of interest: J.L.V. serves as a consultant for Medtronic, Boston Scientific, and Abbott, and serves on the scientific advisory board for Surgical Information Sciences. The remaining authors declare no competing financial interests.

Figures

Figure 1.
Figure 1.
Location of Utah array and DBS leads. A, Utah arrays were placed over the arm area of the M1 (top). The image of Subject K was obtained end of study after perfusion; the image of Subject J was obtained intraoperatively. B, DBS lead locations in the STN and GPi with location of DBS leads in the STN and GPi in each subject. Contacts used for therapeutic stimulation shown in yellow. In both animals, we verified that DBS in STN and GPi contacts produced improvements in parkinsonian motor signs (Table 1). Th = thalamus, SN = substantia nigra, GPe = globus pallidus externus.
Figure 2.
Figure 2.
M1 single-unit responses to acute STN and GPi DBS. A, Example recording traces from two channels at the onset of STN DBS. Channel 17 had two isolated cells: 17a decreased firing rate and 17b increased firing rate. Channel 75 had one isolated cell with antidromic firing response. B, Examples of peristimulus time raster plots aligned to DBS (or sham) pulses before, during, and after STN DBS illustrating the four main response categories based on firing rate and pattern: antidromic, suppression, excitation, and no change. C, Examples of peristimulus time raster plots demonstrating suppression, excitation, and no change responses before, during, and after GPi DBS. Antidromic activation of M1 was not observed with GPi DBS. D, Normalized peristimulus time histograms (firing rate relative to the mean pre-DBS period) are shown, illustrating the four response classifications used in this study. E, Pie charts illustrating the percentage of each response type in M1 during acute STN (left) and GPi DBS (right) for each animal. Antidromic firing in M1 was only observed during STN DBS, and in greater proportion in Subject K than in Subject J, whereas similar proportions of excitation and suppression were observed for each animal for either STN or GPi DBS.
Figure 3.
Figure 3.
Strength of antidromic firing in M1 diminishes over time. A, Heat map illustrating the time course of the population PSTH of M1 cells that were antidromically activated during the first 50 s of STN DBS for both subjects. Before averaging, the PSTH of each cell was aligned to the time bin in the PSTH where firing was maximal, and firing rate normalized to the firing rate calculated over the first three time bins. Zero on the x-axis represents the time point of peak antidromic firing. PSTH were calculated in 2 s bins and for visualization a 5-point linear interpolation both x and y axes was performed. B, The percentage of cells with significant change in their peak PSTH firing rate [first 10 s vs the last 10 s, Wilcoxon rank sum (WRS) test, p < 0.05]. C, Time course of the population PSTH of cells whose responses to 15 and 80 Hz stimulation were tested in addition to 130 Hz.
Figure 4.
Figure 4.
The strength of antidromic activation of M1 cells was progressively diminished over 4 h of continuous STN. A, C, Composite scores based on the mUPDRS (y-axis) for Subjects K and J, respectively. X-axis represents the time of stimulation. mUPDRS scores are shown for Hours 1–3 but were not taken in Hour 4. Detailed scores for individual motor signs are presented in Table 2. B, D, Time course of cell population PSTH over 4 h of STN DBS in each animal is shown in the heat map (left). The percentage of cells with significant change in their peak PSTH firing rate [DBS onset vs 4 h DBS duration, Wilcoxon rank sum (WRS) test, p < 0.05] is shown in the pie charts (right). PSTH were calculated in 2 s bins and grouped into DBS onset (first 50 s of recording) and 1, 2, 3, and 4 h DBS time bins. Before averaging, the PSTH of each cell was aligned to the time bin in the PSTH where firing was maximal, and firing rate normalized to the firing rate calculated over the first three time bins.
Figure 5.
Figure 5.
Interspike interval (ISI) probability histograms illustrate that antidromic-classified cells had highly regular discharge patterns during DBS. A, Spike occurrences during STN DBS in two M1 cells from Subject K are shown in the top (2.5 s duration segment shown, each row = 0.5 s). Corresponding ISI probability histograms from the entire recording block are shown in the bottom, with Off-DBS ISI histograms shown for comparison. Prominent peaks corresponding to one and two times the DBS stimulation interstimulus period (∼7.7 ms) are evident. B, ISI probability histograms from 15 simultaneously recorded cells identified as antidromic (Subject K) displayed as a heat map. C, Proportion of antidromic-classified cells in subacute DBS sessions with ISI probability peaks at one or two times the DBS ISI (or other) based on recordings at early (<0.5 h on-DBS) and late (3–4 h on-DBS) in the on-DBS recording period.
Figure 6.
Figure 6.
Synchronization in populational unit activities decreased with therapeutic STN DBS. A, Spike synchronization scores for all simultaneously recorded M1 cells across multiple 4 h STN DBS stimulation days (color coded) in both animals are shown as mean ± SD. Results of one-way ANOVA test for each session are shown in the tables (top). Following a significant one-way ANOVA test result, Dunnett's test with control = PRE (*p < 0.05) was performed for the sessions that had awake rest data in the PRE-DBS condition (2 for Subject K and 5 for Subject J), showing significant reduction of spike synchronization during STN DBS in each day. B, Combined spike synchronization scores (mean ± SD) from all the stimulation days that had the PRE-DBS condition are reduced during therapeutic STN DBS for both NHPs (mixed-model ANOVA, Subject K: F(6,9966) = 5.2, p = 0.028, 2 d; Subject J: F(6,22780) = 8.1, p < 0.0001, 5 d; followed by Dunnett's test with control = PRE (*p < 0.05). The combined spike synchronization scores for the first and second hours post-DBS returned to the pre-DBS level (Dunnett's test with control = PRE, p > 0.05).
Figure 7.
Figure 7.
Pairwise spike synchronization of simultaneously recorded unit activities pre, during and post-therapeutic STN DBS in both NHPs. A, Averaged matrix illustration of the pattern of cell–cell synchronization changes with STN DBS from the first stimulation day in each animal. Matrices were generated based on the synchronization score calculated for each pair of cells. Fourteen (of 54) and four (of 30) antidromic classified neurons were identified in Subjects K and J, respectively, in these examples. Different pairs including antidromic to antidromic (Anti–Anti), antidromic to non-antidromic (Anti–NonAnti), non-antidromic to non-antidromic (NonAnti–NonAnti) neurons are labeled as shown in the left matrix pattern. B, Pairwise spike synchronization from all the stimulation days that had awake rest data in the PRE-DBS condition (2 for Subject K and 5 for Subject J) for different groups (Anti–Anti, Anti–NonAnti and NonAnti–NonAnti) are shown. Anti–NonAnti pairwise spike synchronization was reduced by STN DBS in both subjects, whereas NonAnti–NonAnti spike synchronization was only reduced in Subject K. Anti-Anti spike synchronization did not change except for an increase at the first hour on STN DBS in Subject K. Wilcoxon test followed by Steel's test with control = PRE. *p < 0.05. C, Proportion of cell pairs with increased or decreased cell–cell spike synchronization scores, comparing pre-DBS period to fourth hour on-DBS, in all cell pairs (top) and in different groups (bottom).

References

    1. Agnesi F, Connolly AT, Baker KB, Vitek JL, Johnson MD (2013a) Deep brain stimulation imposes complex informational lesions. PLoS One 8:e74462. 10.1371/journal.pone.0074462 - DOI - PMC - PubMed
    1. Agnesi F, Johnson MD, Vitek JL (2013b) Deep brain stimulation: how does it work? Handb Clin Neurol 116:39–54. 10.1016/B978-0-444-53497-2.00004-8 - DOI - PubMed
    1. Anderson RW, Farokhniaee A, Gunalan K, Howell B, McIntyre CC (2018) Action potential initiation, propagation, and cortical invasion in the hyperdirect pathway during subthalamic deep brain stimulation. Brain Stimul 11:1140–1150. 10.1016/j.brs.2018.05.008 - DOI - PMC - PubMed
    1. Benabid AL, Pollak P, Louveau A, Henry S, de Rougemont J (1987) Combined (thalamotomy and stimulation) stereotactic surgery of the VIM thalamic nucleus for bilateral parkinson disease. Appl Neurophysiol 50:344–346. 10.1159/000100803 - DOI - PubMed
    1. Bergman H, Wichmann T, DeLong MR (1990) Reversal of experimental parkinsonism by lesions of the subthalamic nucleus. Science 249:1436–1438. 10.1126/science.2402638 - DOI - PubMed

Publication types

LinkOut - more resources