. 2020 Feb 4;5(1):e00729-19.
doi: 10.1128/mSystems.00729-19.

Global Network Analysis of Neisseria gonorrhoeae Identifies Coordination between Pathways, Processes, and Regulators Expressed during Human Infection

Affiliations

Global Network Analysis of Neisseria gonorrhoeae Identifies Coordination between Pathways, Processes, and Regulators Expressed during Human Infection

Ryan McClure et al. mSystems. .

Abstract

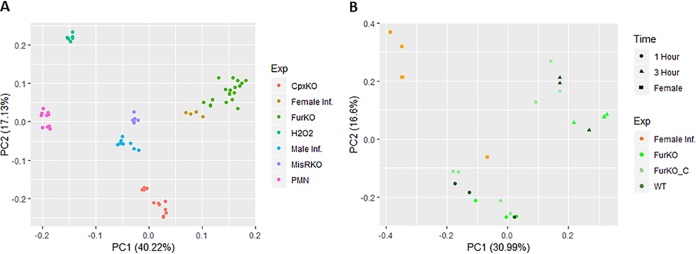
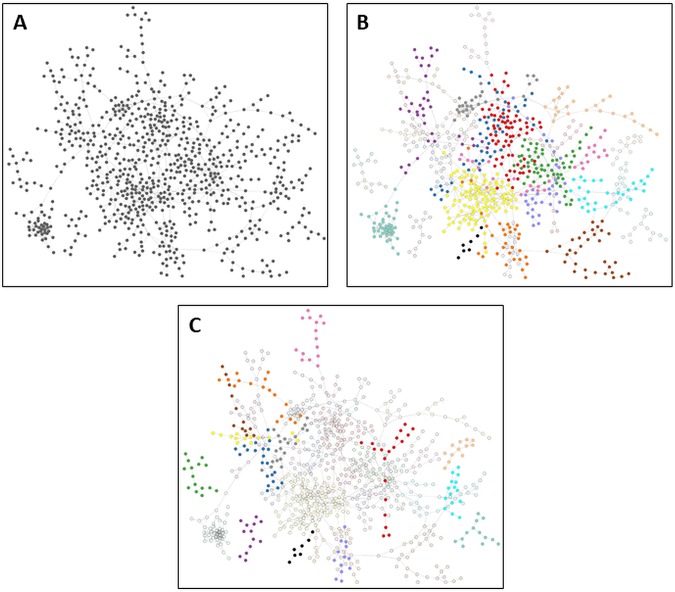
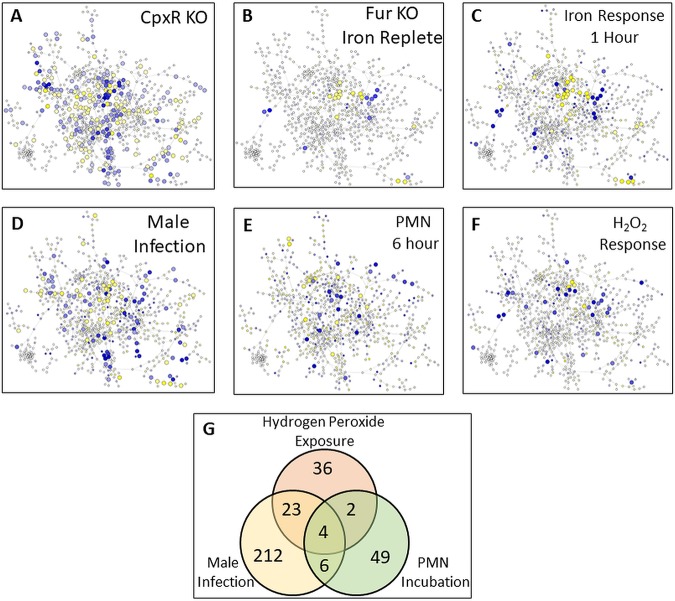
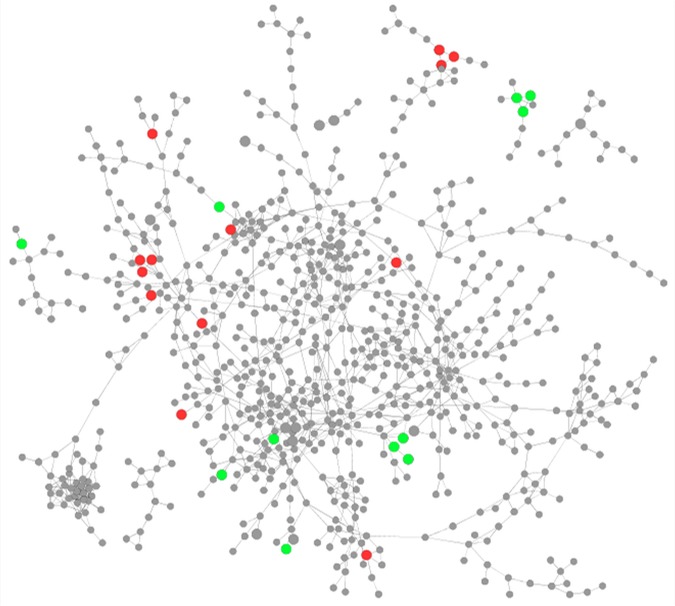
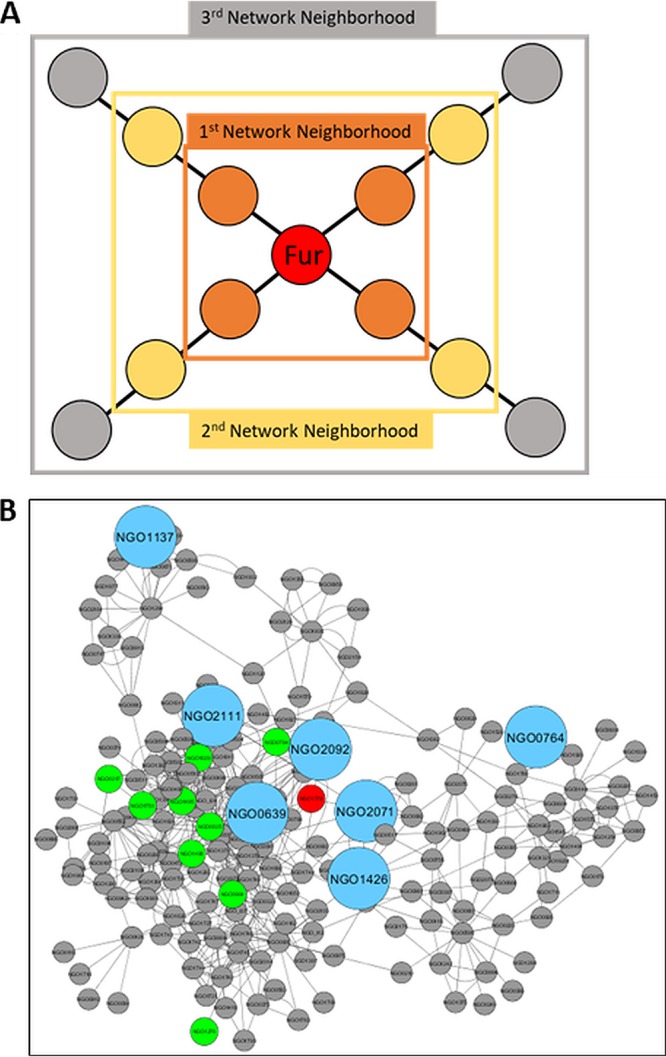
Neisseria gonorrhoeae is a Gram-negative diplococcus that is responsible for the sexually transmitted infection gonorrhea, a high-morbidity disease in the United States and worldwide. Over the past several years, N. gonorrhoeae strains resistant to antibiotics used to treat this infection have begun to emerge across the globe. Thus, new treatment strategies are needed to combat this organism. Here, we utilized N. gonorrhoeae transcriptomic data sets, including those obtained from natural infection of the human genital tract, to infer the first global gene coexpression network of this pathogen. Interrogation of this network revealed genes central to the network that are likely critical for gonococcal growth, metabolism, and virulence, including genes encoding hypothetical proteins expressed during mucosal infection. In addition, network analysis revealed overlap in the response of N. gonorrhoeae to incubation with neutrophils and exposure to hydrogen peroxide stress in vitro Network analysis also identified new targets of the gonococcal global regulatory protein Fur, while examination of the network neighborhood of genes allowed us to assign additional putative categories to several proteins. Collectively, the characterization of the first gene coexpression network for N. gonorrhoeae described here has revealed new regulatory pathways and new categories for proteins and has shown how processes important to gonococcal infection in both men and women are linked. This information fills a critical gap in our understanding of virulence strategies of this obligate human pathogen and will aid in the development of new treatment strategies for gonorrhea.IMPORTANCE Neisseria gonorrhoeae is the causative agent of the sexually transmitted infection (STI) gonorrhea, a disease with high morbidity worldwide with an estimated 87 million cases annually. Current therapeutic and pharmacologic approaches to treat gonorrhea have been compromised by increased antibiotic resistance worldwide, including to the most recent FDA-approved antibiotic. New treatment strategies are urgently needed to combat this organism. In this study, we used network analysis to interrogate and define the coordination of pathways and processes in N. gonorrhoeae An analysis of the gonococcal network was also used to assign categories to genes and to expand our understanding of regulatory strategies. Network analysis provides important insights into pathogenic mechanisms of this organism that will guide the design of new strategies for disease treatment.

Keywords: Neisseria gonorrhoeae; RNA-seq; global regulatory networks; human infection; network analysis; regulatory proteins; transcriptomics.


Figures

FIG 1
FIG 1
Principal-component analysis of conditions. (A) PCA analysis was carried out to define distances between all samples. Color indicates the experimental group, with the variability explained by the first and second principle components on the x and y axes, respectively. The group Cpx contains both cpxA and cpxR mutant data as well as the WT data from this experiment. The same grouping is carried out with fur and misR data, and the wild-type strain is included in each of these experimental clusters. For female and male infection, H2O2, and PMN exposure data, the control data sets are also included in the experimental group. (B) Specific analysis of several data sets that were tightly clustered in panel A. Two experiments are included in this graph: analysis of a fur mutant strain at 1 and 3 h after the addition of iron and analysis of N. gonorrhoeae during female genital tract infection. Colors indicate specific experiments and, for fur mutant experimental conditions, circles indicate 1 h after the addition of iron and triangles indicate 3 h after the addition of iron, while squares indicate infection of female genital tract.
FIG 2
FIG 2
Network clustering of genes. (A) All transcriptomic data were examined using CLR to infer a network that links genes based on coexpression. Each gray circle represents an N. gonorrhoeae gene, and each line represents an instance of coexpression between a gene pair. Networks were viewed using Cytoscape, which attempts to cluster groups of highly linked genes together. (B) Genes in the network were grouped into 1 of 26 modules (groups of highly coexpressed genes). The 13 largest modules shown are distinguished by color. Genes that are faded are in smaller modules, while genes that are colored black were not grouped into any module. (C) The remaining 13 smaller modules shown are distinguished by color. Genes that are faded are in larger modules, and genes that are colored black were not grouped into any module.
FIG 3
FIG 3
Response of the gonococcal network to specific conditions. Genes within the network responding to specific conditions are shown. For each condition, expression data were compared between treatment (either a mutant strain or environmental perturbation) and a control (either a wild-type strain or an environmental control). Genes showing a >2-fold change in expression with an adjusted P value of <0.05 are shown as larger nodes in the network. Large yellow nodes indicate genes that were expressed at higher levels under control versus treatment conditions, and large blue nodes indicate genes that were expressed at lower levels under control versus treatment conditions. The color shading of the node indicates the strength of the response: darker nodes show a stronger response, either increased or decreased. (A) Analysis of cpxR mutant strain. (B) Analysis of fur mutant strain under iron-replete conditions. (C) Analysis of the gonococcal response 1 h after the addition of iron. (D) Analysis of infection of the male genital tract. (E) Analysis of incubation in PMNs after 6 h. (F) Analysis of response to H2O2 incubation. (G) A Venn diagram showing the number of differentially expressed genes for three oxidative stress-related conditions (hydrogen peroxide exposure, infection of the male genital tract, and incubation in PMNs) and the overlap in differentially expressed gene (DEG) number for each pair of conditions and for all three conditions.
FIG 4
FIG 4
Network position of infection-related genes. Network with pilin-related genes (green circles) and stress-related genes (red circles) highlighted.
FIG 5
FIG 5
Network neighborhood of Fur. (A) Schematic of how network neighborhood is defined. (B) The third network neighborhood of Fur in a network inferred using GENIE3. The fur gene is shown as a large red node, with known targets of Fur shown as larger green nodes and putative new targets of Fur, those that contain a Fur binding site and are within the network neighborhood, shown as much larger blue nodes.
FIG 6
FIG 6
GBA analysis of hypothetical proteins. NGO1742, encoding a hypothetical protein, within the network was extracted along with the six additional genes that it has an edge with. Red genes are those that are involved with energy metabolism. The green gene is involved in DNA metabolism, and the gray gene is an additional hypothetical.

References

    1. Rebick GW, Allen VG, Gold WL. 2013. A 34-year-old man with urethral discharge. CMAJ 185:414–415. doi: 10.1503/cmaj.121776. - DOI - PMC - PubMed
    1. Detels R, Green AM, Klausner JD, Katzenstein D, Gaydos C, Handsfield H, Pequegnat W, Mayer K, Hartwell TD, Quinn TC. 2011. The incidence and correlates of symptomatic and asymptomatic Chlamydia trachomatis and Neisseria gonorrhoeae infections in selected populations in five countries. Sex Transm Dis 38:503–509. - PMC - PubMed
    1. Edwards JL, Apicella MA. 2004. The molecular mechanisms used by Neisseria gonorrhoeae to initiate infection differ between men and women. Clin Microbiol Rev 17:965–981. doi: 10.1128/CMR.17.4.965-981.2004. - DOI - PMC - PubMed
    1. Edwards JL, Butler EK. 2011. The pathobiology of Neisseria gonorrhoeae lower female genital tract infection. Front Microbiol 2:102. doi: 10.3389/fmicb.2011.00102. - DOI - PMC - PubMed
    1. Hook EW, Holmes KK. 1985. Gonococcal infections. Ann Intern Med 102:229–243. doi: 10.7326/0003-4819-102-2-229. - DOI - PubMed