. 2020 Apr 1;80(7):1475-1485.
doi: 10.1158/0008-5472.CAN-19-2961. Epub 2020 Feb 4.

Proteomic Profiling of the ECM of Xenograft Breast Cancer Metastases in Different Organs Reveals Distinct Metastatic Niches

Affiliations

Proteomic Profiling of the ECM of Xenograft Breast Cancer Metastases in Different Organs Reveals Distinct Metastatic Niches

Jess D Hebert et al. Cancer Res. .

Abstract

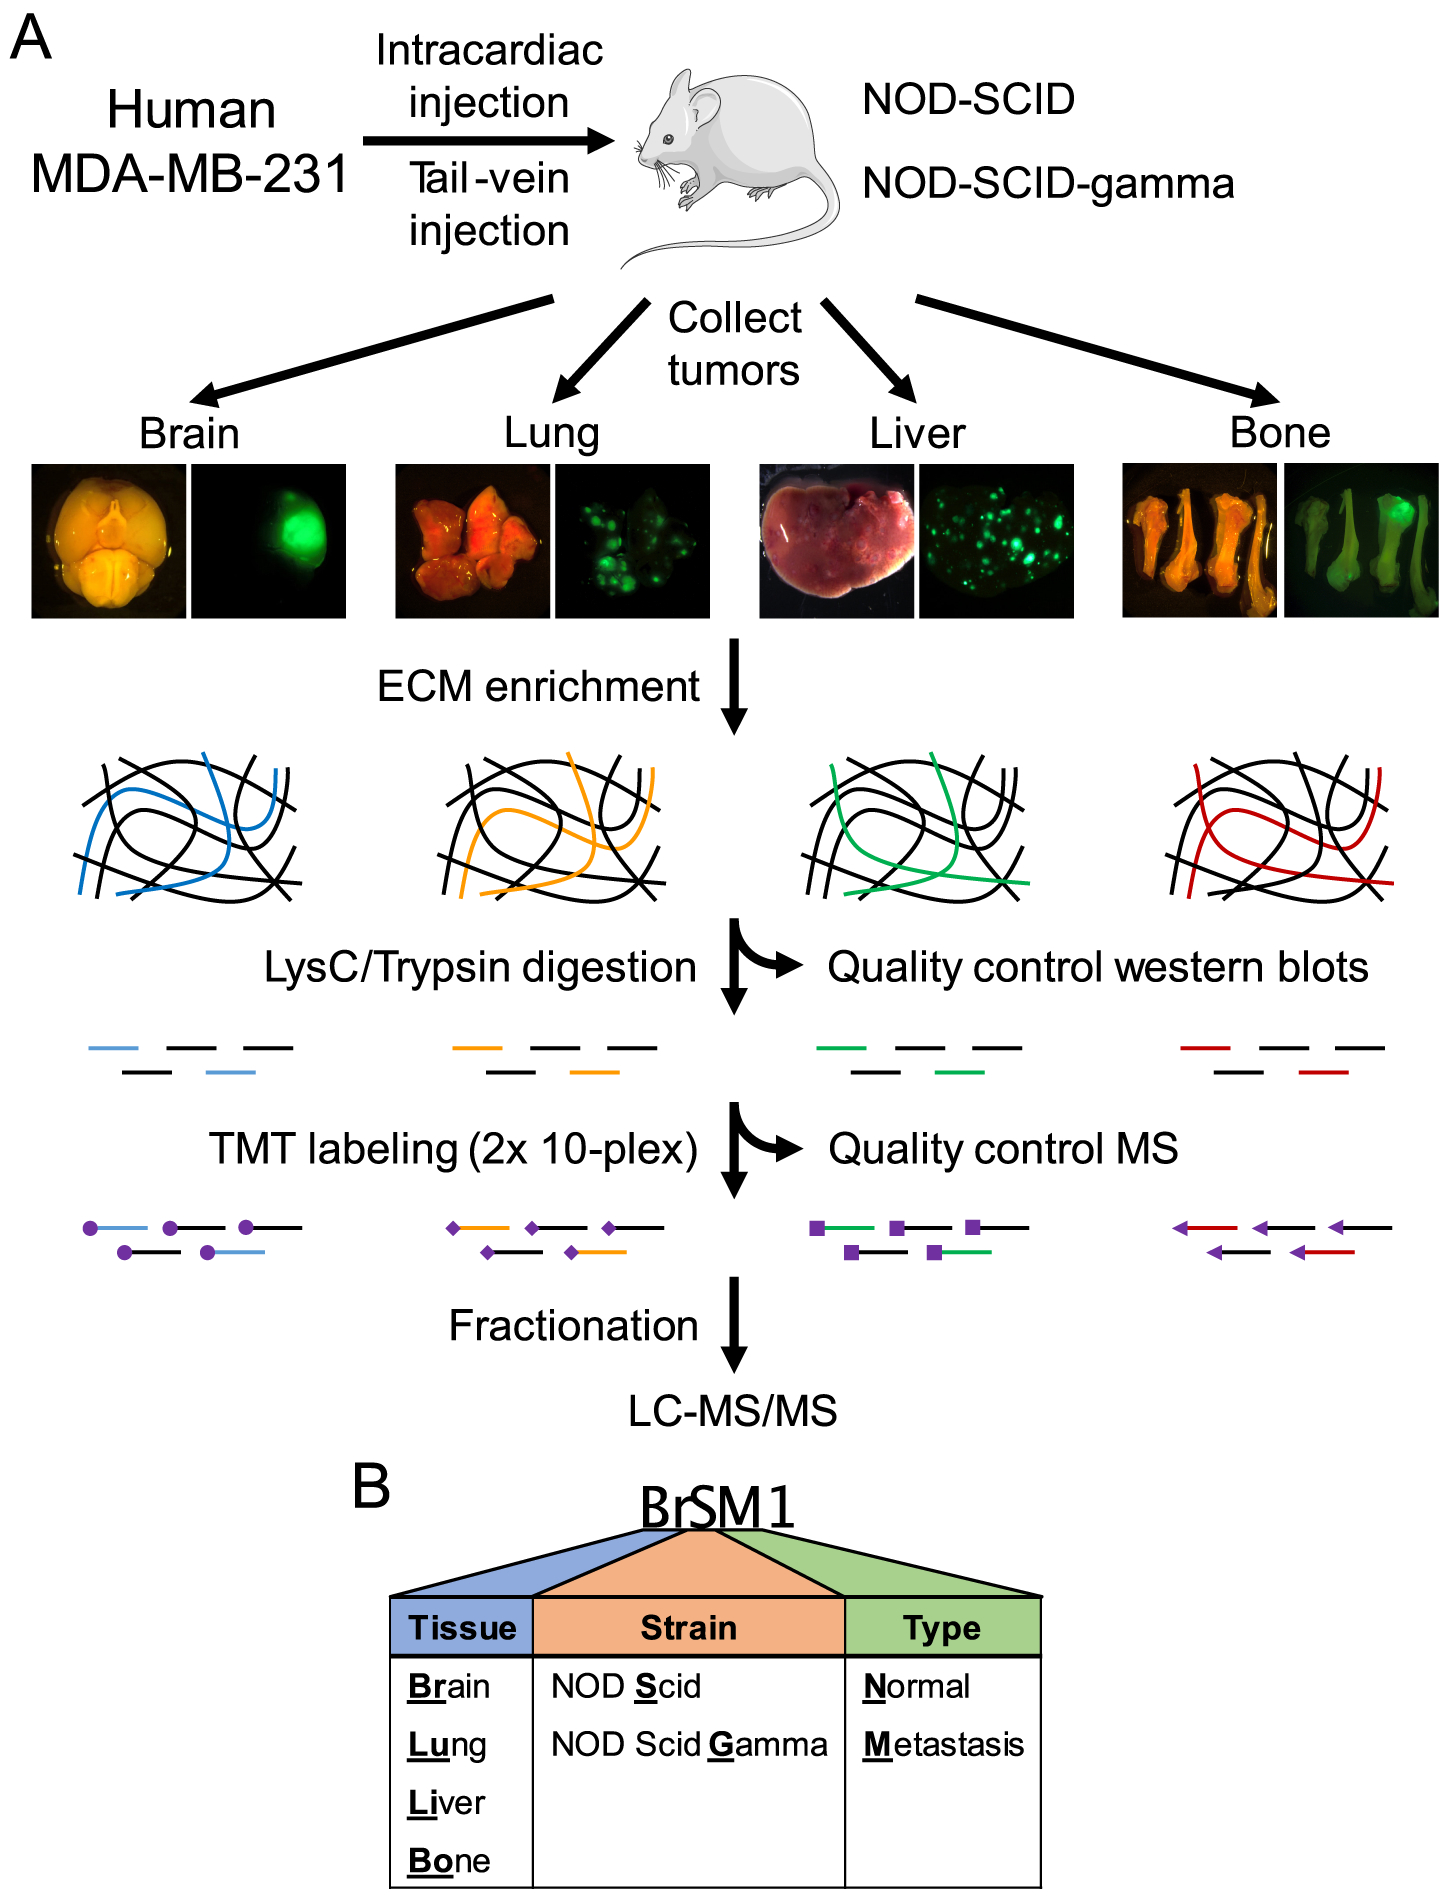
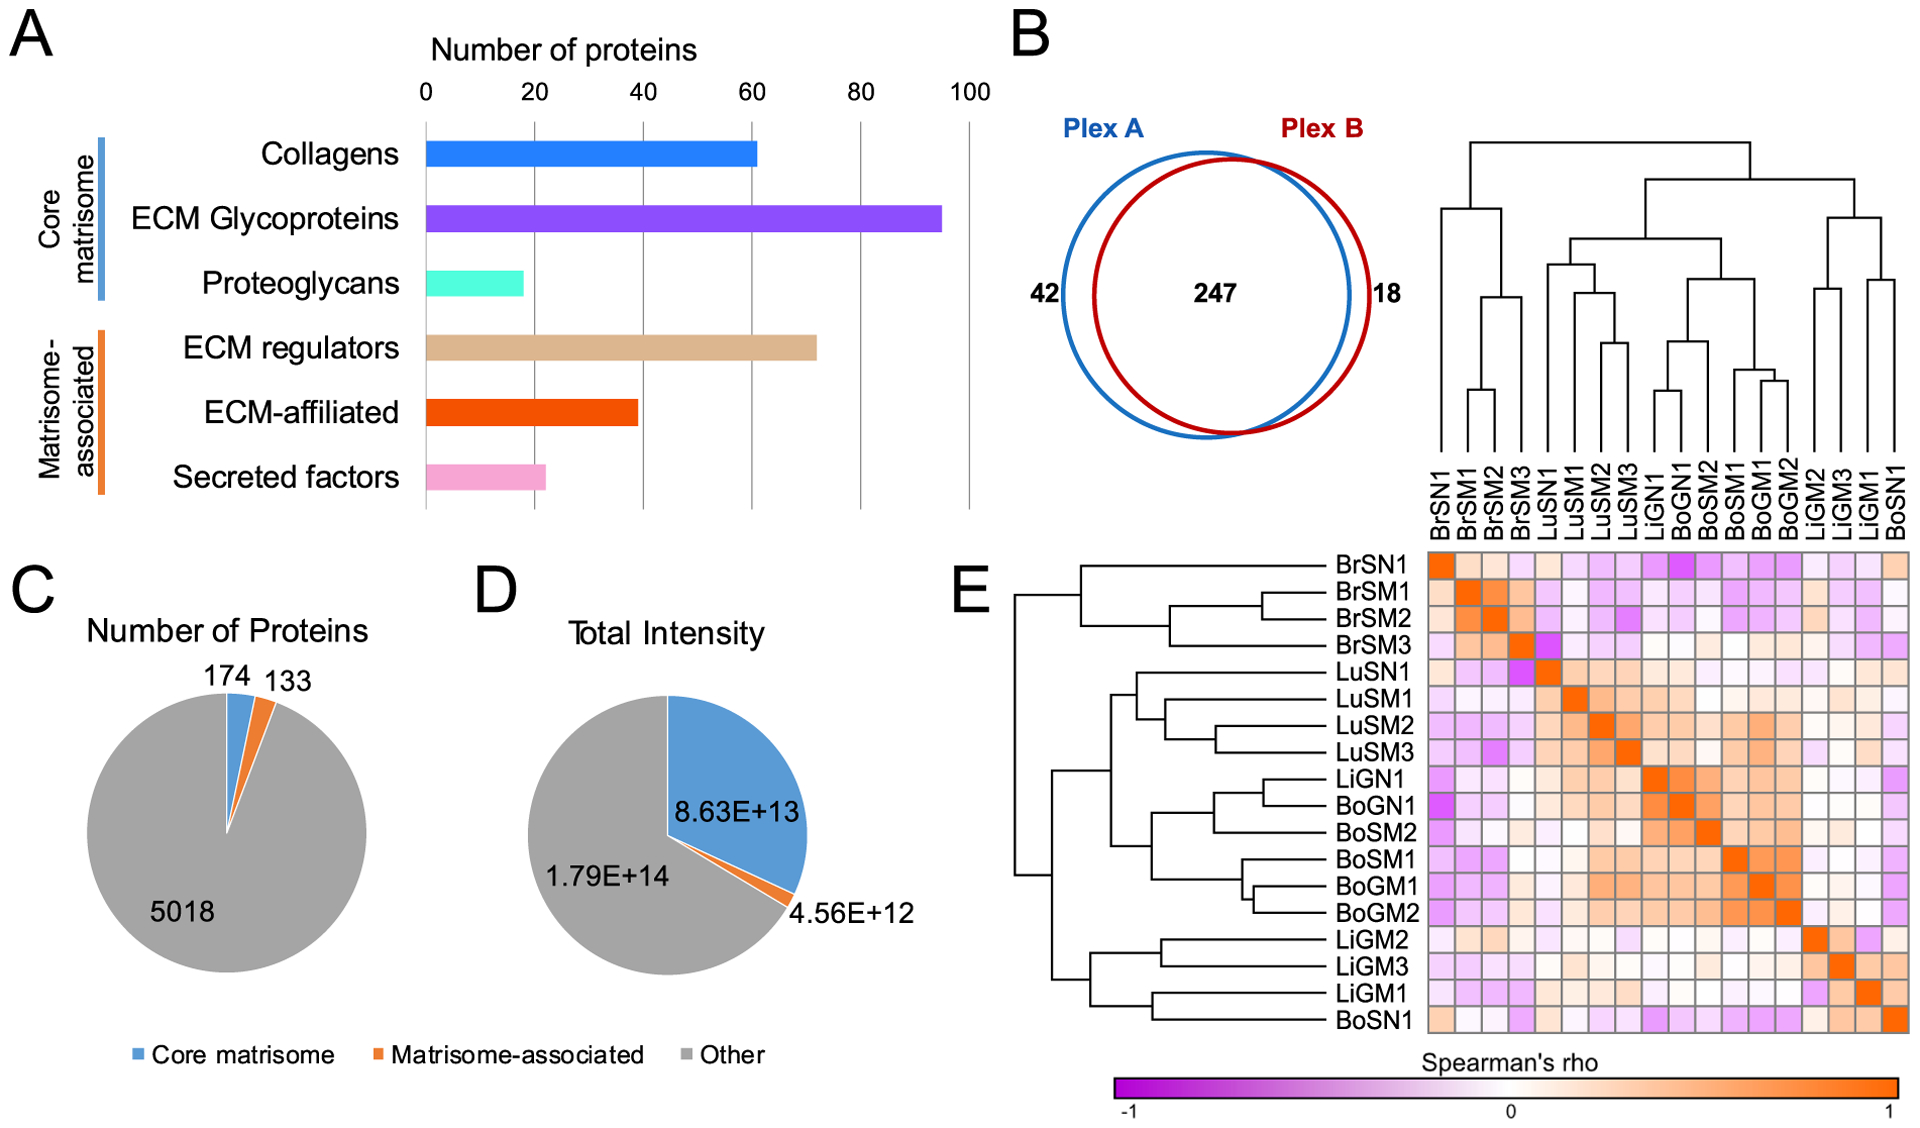
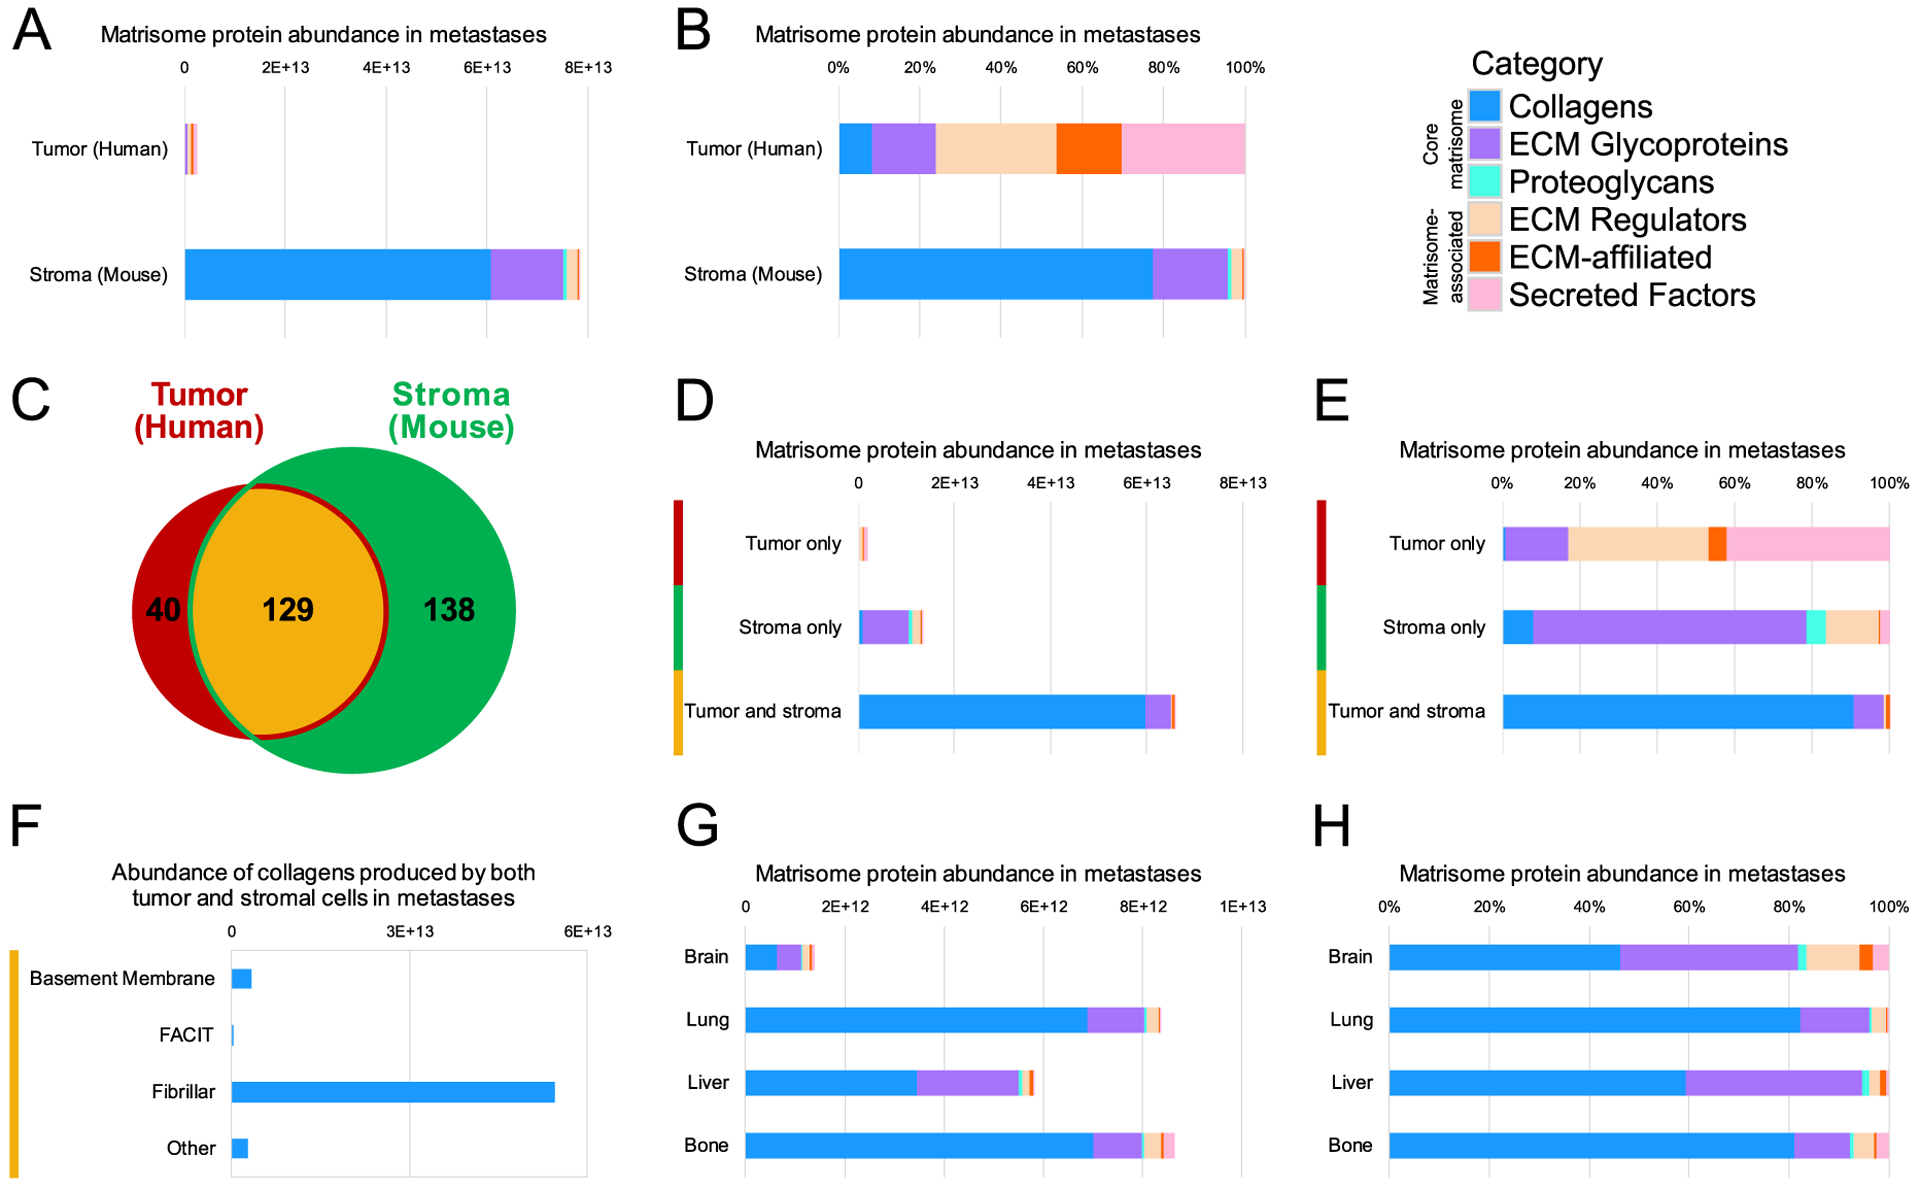
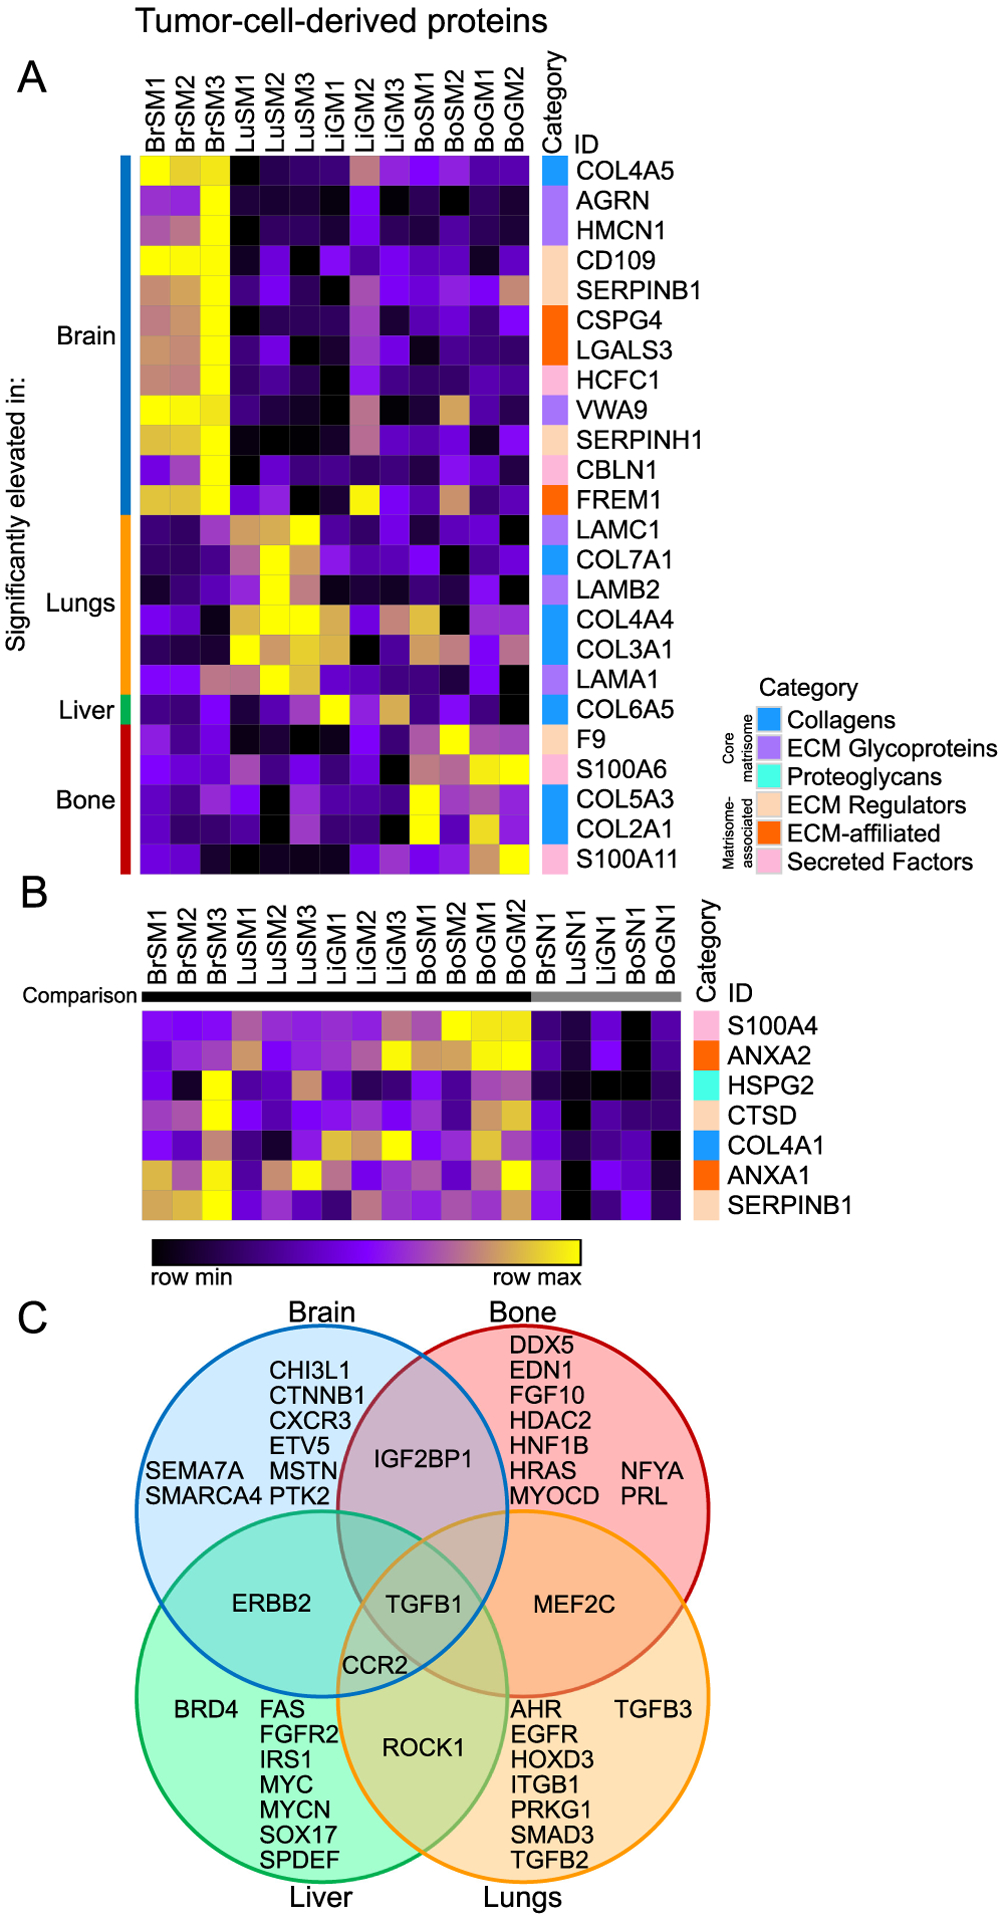
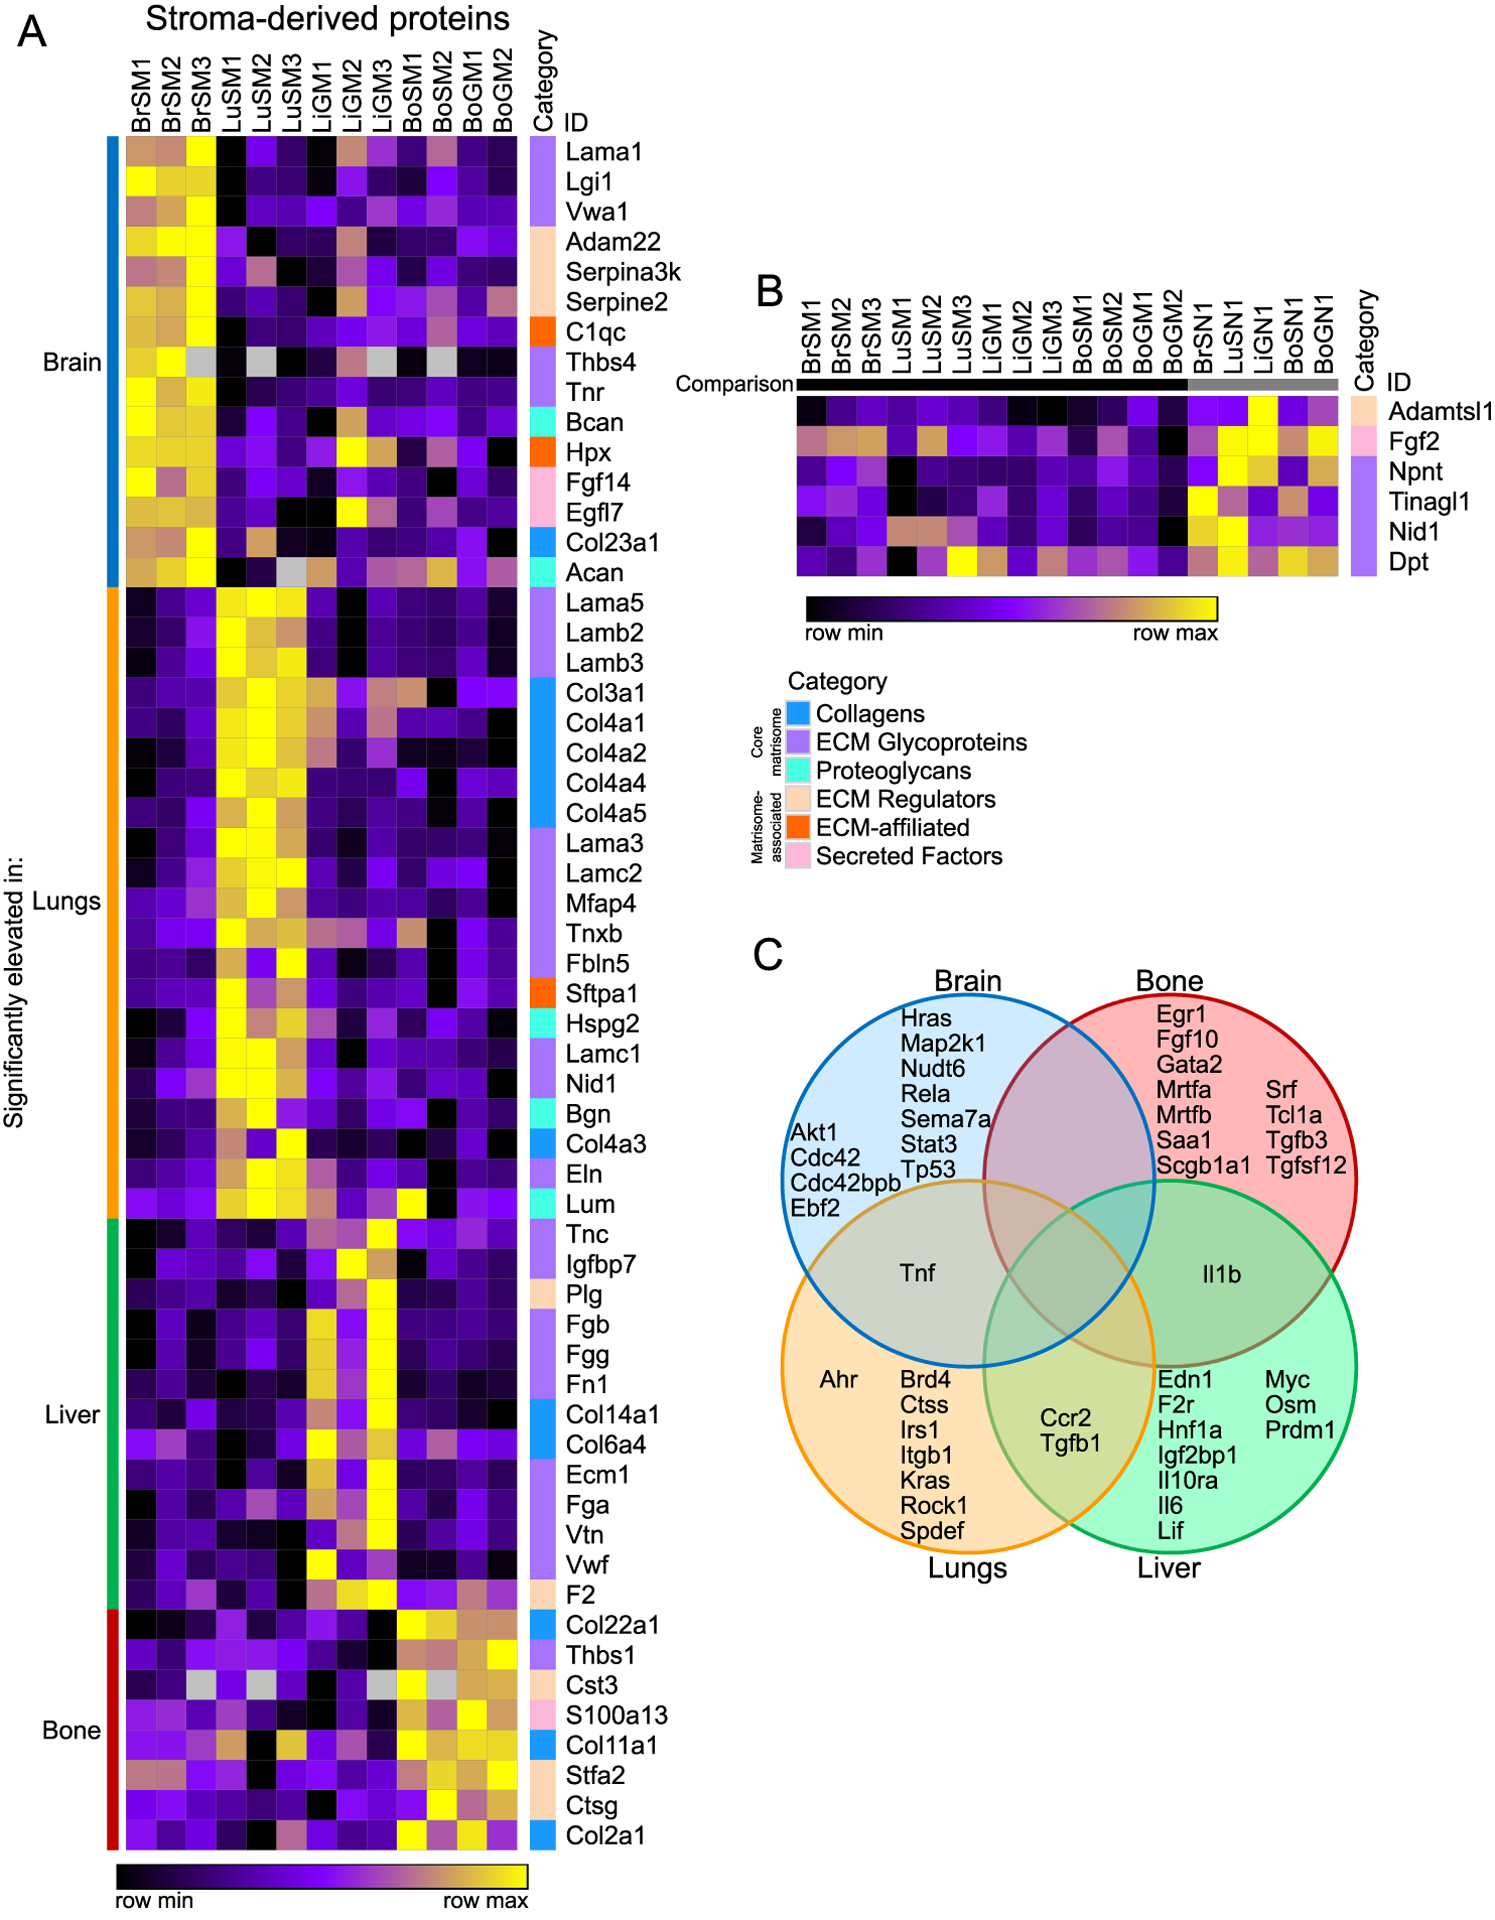
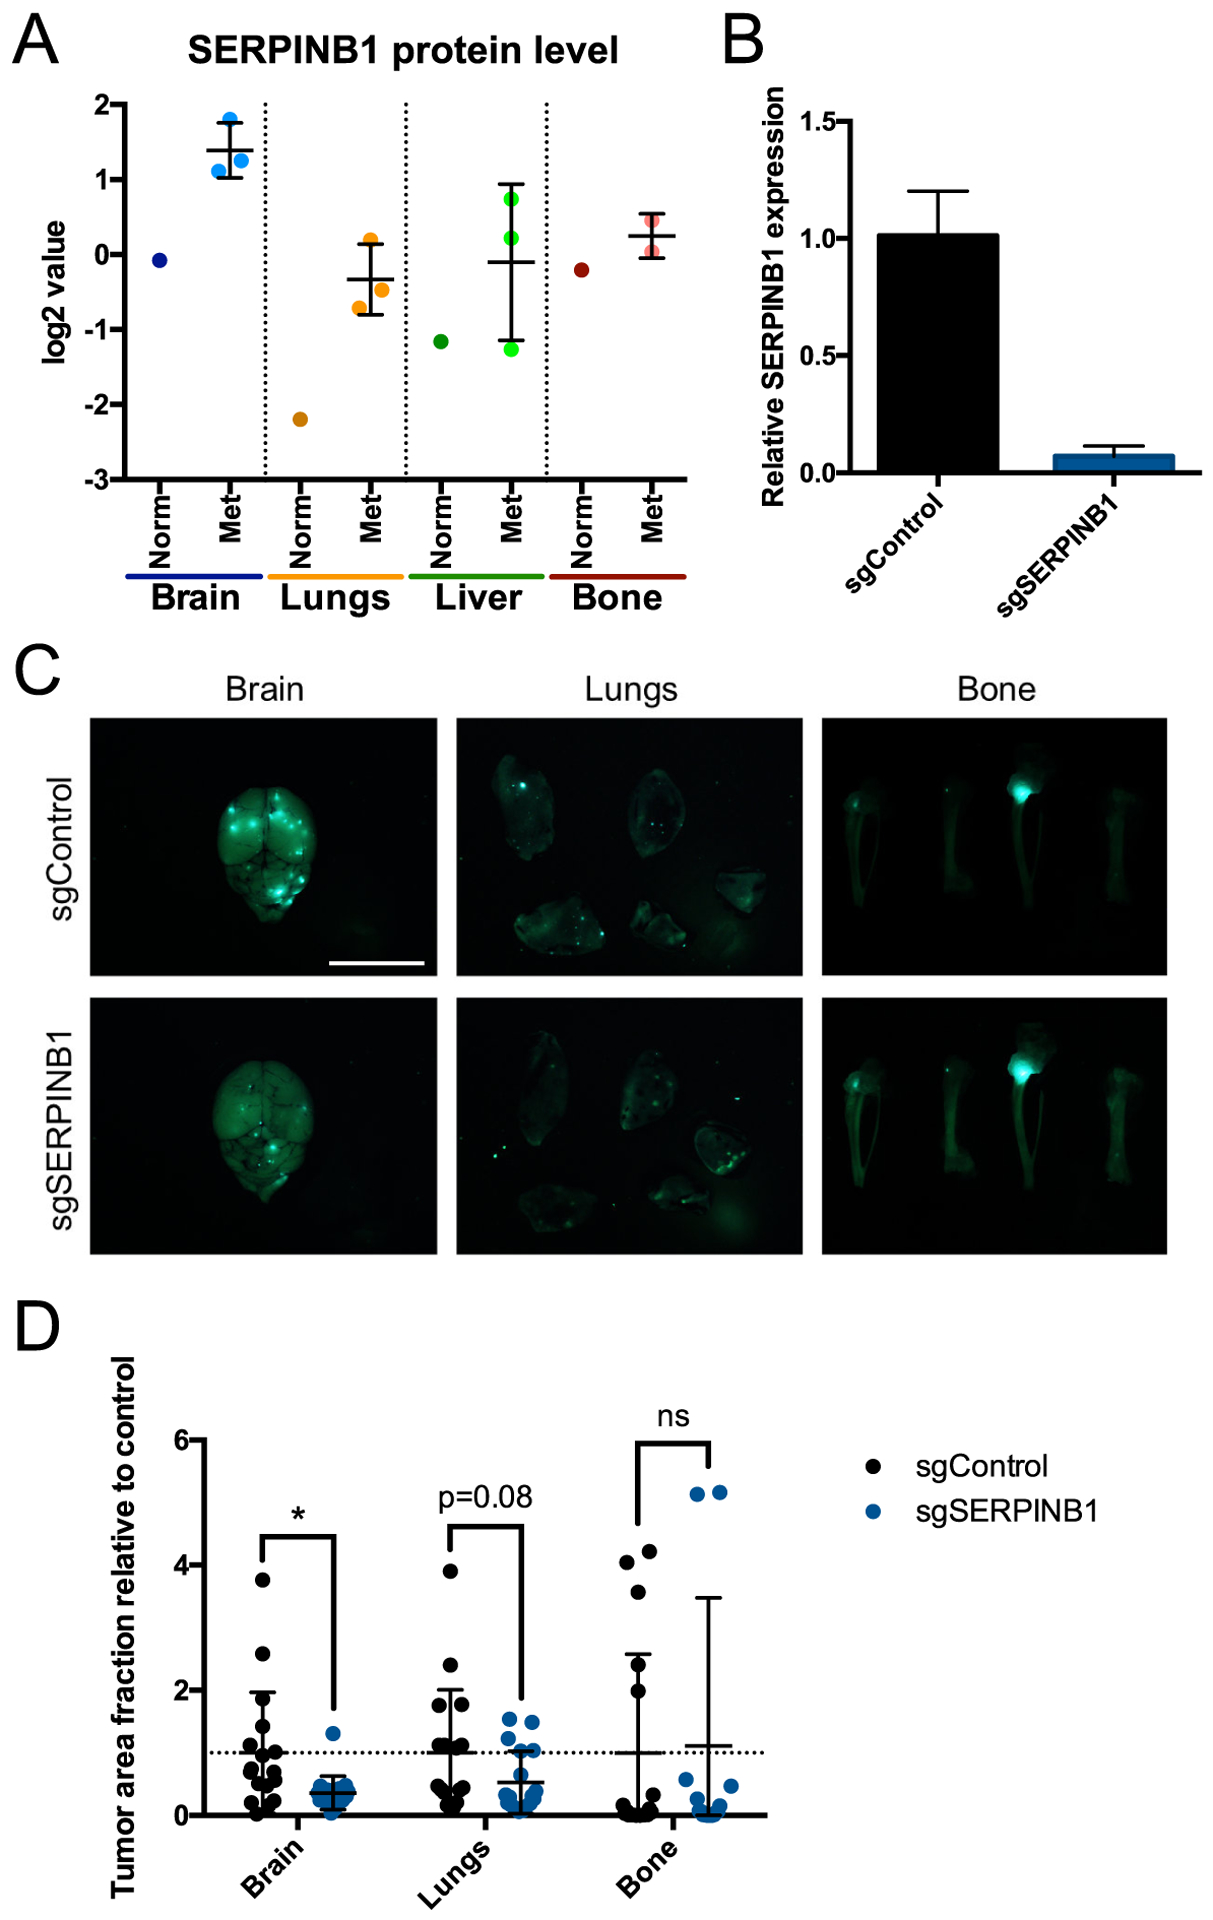
Metastasis causes most cancer-related deaths, and one poorly understood aspect of metastatic cancer is the adaptability of cells from a primary tumor to create new niches and survive in multiple, different secondary sites. We used quantitative mass spectrometry to analyze the extracellular matrix (ECM), a critical component of metastatic niches, in metastases to the brain, lungs, liver, and bone marrow, all derived from parental MDA-MB-231 triple-negative breast cancer cells. Tumor and stromal cells cooperated in forming niches; stromal cells produced predominantly core, structural ECM proteins and tumor cells produced a diverse array of ECM-associated proteins, including secreted factors and modulators of the matrix. In addition, tumor and stromal cells together created distinct niches in each tissue. Downregulation of SERPINB1, a protein elevated in brain metastases, led to a reduction in brain metastasis, suggesting that some niche-specific ECM proteins may be involved in metastatic tropism. SIGNIFICANCE: Tumor and stromal cells together create distinct ECM niches in breast cancer metastases to various tissues, providing new insight into how tumor cells adapt to survive in different tissue environments.


Conflict of interest statement

Competing interests: The authors declare no potential conflicts of interest.

Figures

Figure 1.
Figure 1.. Overview of sample collection, preparation and mass spectrometry.
(A) Experimental workflow. MDA-MB-231 cells expressing luciferase and ZsGreen were injected into the tail vein or heart of NOD/SCID or NOD/SCID/IL2Rγ-null mice. Tumor growth was monitored by IVIS bioluminescence imaging, and tumors were collected 4–12 weeks following injection. Normal control tissues were also collected from uninjected mice. Following ECM enrichment, quality-control western blots (see Supplementary Fig. S1) and proteolytic digestion, samples were divided into two 10-plex TMT series (see Supplementary Table S2). A common reference control comprising equal parts of all samples combined was used to allow comparisons between the two series. Following stage-tip fractionation, samples were run on a Q Exactive Plus mass spectrometer. (B) Sample nomenclature (see Supplementary Table S1).
Figure 2.
Figure 2.. Overview of quantitative mass spectrometry data.
(A) Numbers of proteins quantified among all samples belonging to each matrisome category. (B) Numbers of proteins quantified in each of the two TMT plexes. (C) Numbers of matrisome and non-matrisome proteins quantified among all samples. (D) Total intensity of matrisome and non-matrisome proteins quantified among all samples. (E) Spearman’s rank correlation coefficient (rho) matrix of samples, calculated using all proteins quantified.
Figure 3.
Figure 3.. Tumor-cell- and stroma-derived production of matrisome proteins.
All abundances shown were calculated by adding the fractional intensities for proteins in metastatic samples, broken down by matrisome category. (A) Total and (B) relative abundance of tumor-cell-derived (human) and stroma-derived (mouse) matrisome proteins quantified. (C) Numbers of proteins quantified in metastases that were produced only by tumor cells (human, red, left), only by stromal cells (mouse, green, right) or by both cell compartments (center, yellow). (D) Total and (E) relative abundance of matrisome proteins produced only by tumor cells, only by stromal cells, or by both cell compartments. (F) Total intensity of collagen types produced by both tumor and stromal cells in metastases: basement membrane, fibril-associated collagens with interrupted triple helices (FACIT), and other. (G) Total abundance of matrisome proteins per metastatic sample from each tissue. (H) Relative abundance of matrisome protein categories in all metastases to each tissue.
Figure 4.
Figure 4.. Tumor-cell-derived proteins specifically elevated at distinct metastatic sites.
(A) Comparison of tumor-cell-derived proteins among different metastatic sites (marker selection, see Methods). Shown are all proteins significantly elevated in each particular metastatic tissue (identified on the left) relative to all other metastatic tissues. (B) Comparison of tumor-cell-derived proteins significantly elevated across all metastatic samples in each case relative to normal tissue (on right). All proteins shown in both heatmaps are significantly different between the compared groups (signal to noise ratio, P < 0.05 and FDR < 0.1). (C) Diagram of potential upstream regulators of tumor-cell-derived proteins predicted by Ingenuity Pathway Analysis (IPA) for each tissue, with regulators predicted for multiple tissues indicated in overlapping areas.
Figure 5.
Figure 5.. Stroma-derived proteins specifically altered in metastases.
(A) Comparison of stroma-derived proteins among different metastatic sites (marker selection, see Methods). Shown are all proteins significantly elevated in each particular metastatic tissue (identified on the left) relative to all other metastatic tissues. (B) Comparison of stroma-derived proteins significantly decreased across all metastatic samples relative to all normal samples. All proteins shown in both heatmaps are significantly different between the compared groups (signal to noise ratio, P < 0.05 and FDR < 0.1). (C) Diagram of potential upstream regulators of stroma-derived proteins predicted by IPA for each tissue, with regulators predicted for multiple tissues indicated in overlapping areas.
Figure 6.
Figure 6.. Effects of SERPINB1 knockdown on metastatic tropism and growth.
(A) Quantitative mass spectrometry of SERPINB1 protein levels (log2-fold change values relative to pooled control sample) in each normal (Norm) and metastatic (Met) tissue. All bone samples shown are from NOD-SCID mice. (B) qPCR of SERPINB1 expression in MDA-MB-231 cells expressing sgRNA against mouse Timp1 (sgControl) or SERPINB1. (C) Representative images of brains, lungs, and bones 3 weeks after intracardiac injection of sgControl or sgSERPINB1 cells. Scale bar, 10 mm. (D) Fraction of tissue surface area occupied by tumors. n=18 mice per group. ns, not significant; *, P ≤ 0.05; two-tailed Student’s t-test.

References

    1. Lambert AW, Pattabiraman DR, Weinberg RA. Emerging Biological Principles of Metastasis. Cell. 2017;168:670–91. - PMC - PubMed
    1. Denkert C, Liedtke C, Tutt A, von Minckwitz G. Molecular alterations in triple-negative breast cancer—the road to new treatment strategies. The Lancet. 2017;389:2430–42. - PubMed
    1. Bianchini G, Balko JM, Mayer IA, Sanders ME, Gianni L. Triple-negative breast cancer: challenges and opportunities of a heterogeneous disease. Nature Reviews Clinical Oncology. 2016;13:674–90. - PMC - PubMed
    1. Bonotto M, Gerratana L, Poletto E, Driol P, Giangreco M, Russo S, et al. Measures of Outcome in Metastatic Breast Cancer: Insights From a Real-World Scenario. The Oncologist. 2014;19:608–15. - PMC - PubMed
    1. Place AE, Jin Huh S, Polyak K. The microenvironment in breast cancer progression: biology and implications for treatment. Breast Cancer Research. 2011;13:227. - PMC - PubMed

Publication types

MeSH terms