. 2020 Feb 17;7(1):ENEURO.0199-19.2019.
doi: 10.1523/ENEURO.0199-19.2019. Print 2020 Jan/Feb.

Synaptic Integration of Thalamic and Limbic Inputs in Rodent Gustatory Cortex

Affiliations

Synaptic Integration of Thalamic and Limbic Inputs in Rodent Gustatory Cortex

M E Stone et al. eNeuro. .

Abstract

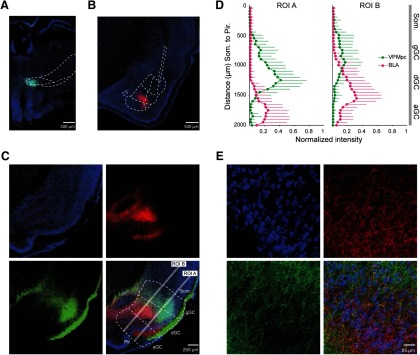
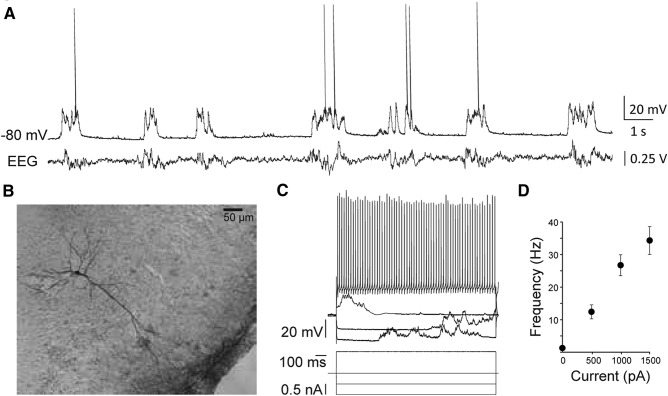
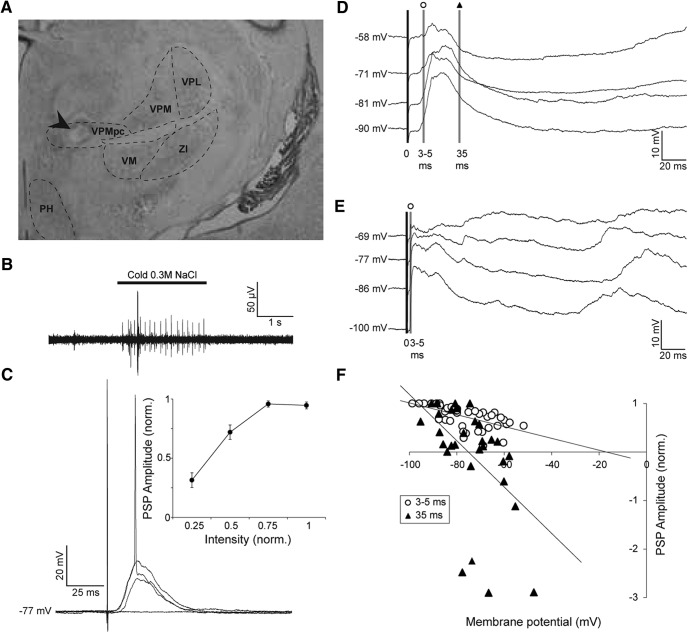
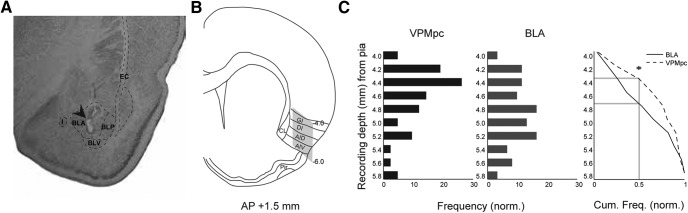
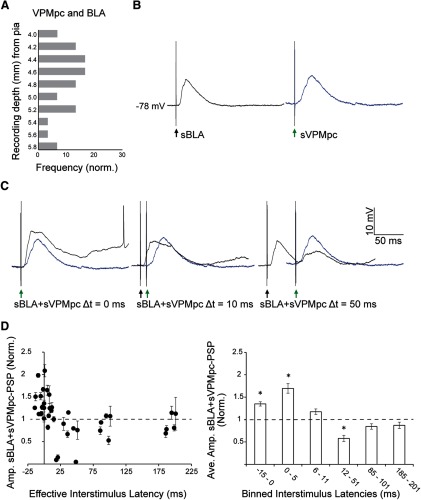
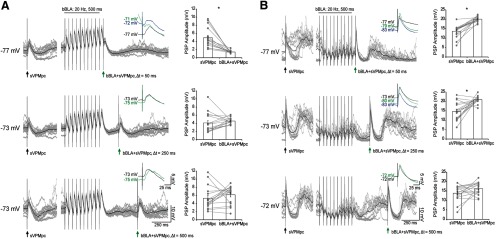
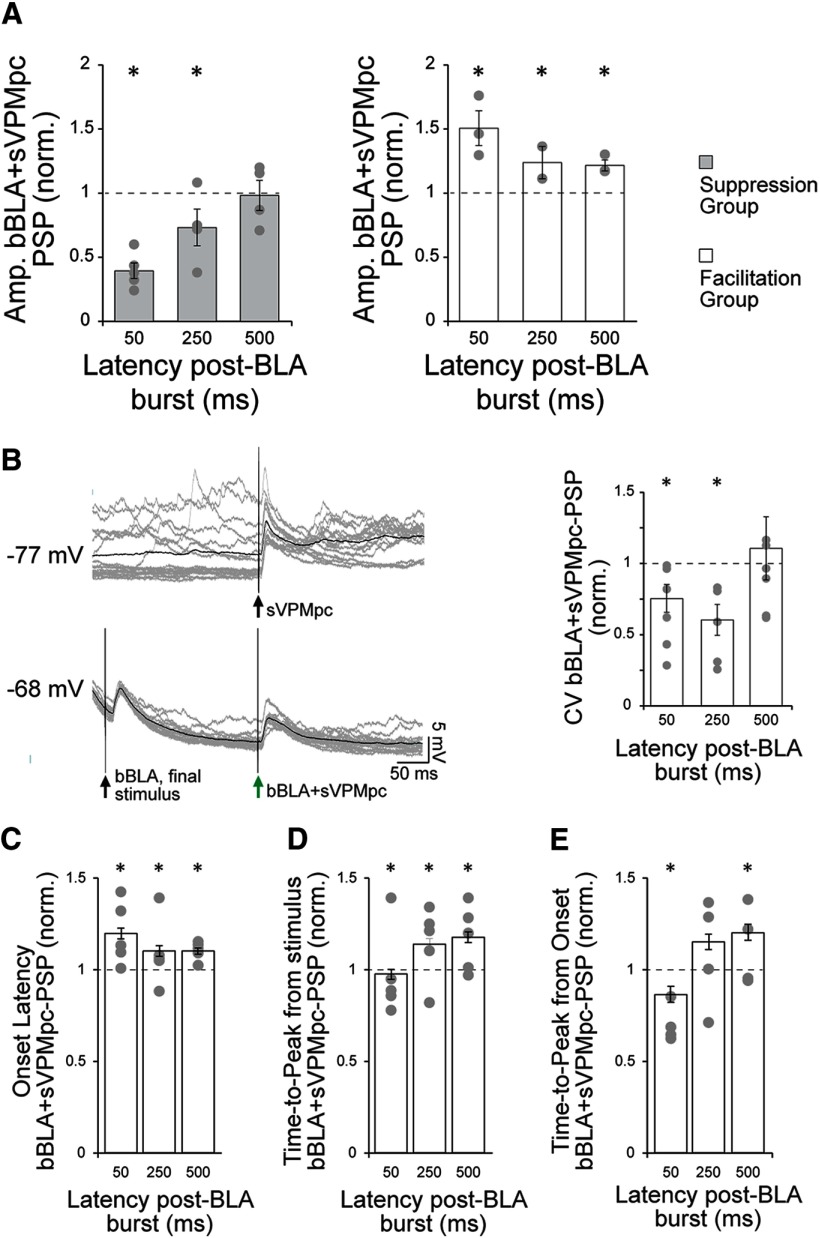
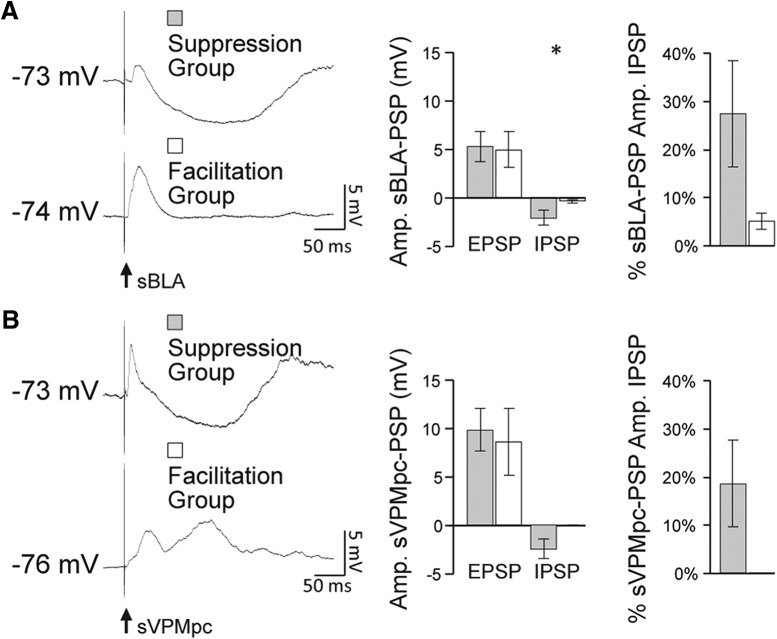
Neurons in the gustatory cortex (GC) process multiple aspects of a tasting experience, encoding not only the physiochemical identity of tastes, but also their anticipation and hedonic value. Information pertaining to these stimulus features is relayed to GC via the gustatory thalamus (VPMpc) and basolateral amygdala (BLA). It is not known whether these inputs drive separate groups of neurons, thus activating separate channels of information, or are integrated by neurons that receive both afferents. Here, we used anterograde labeling and in vivo intracellular recordings in anesthetized rats to assess the potential convergence of BLA and VPMpc inputs in GC, and to investigate the dynamics of integration of these inputs. We report substantial anatomic overlap of BLA and VPMpc axonal fields across GC, and identify a population of GC neurons receiving converging BLA and VPMpc inputs. Our data show that BLA modulates the gain of VPMpc-evoked responses in a time-dependent fashion and that this modulation is dependent on the recruitment of synaptic inhibition by both BLA and VPMpc. Our results suggest that BLA shapes cortical processing of thalamic inputs by dynamically gating the excitatory/inhibitory balance of the GC circuit.

Keywords: amygdalocortical; excitation; gustatory cortex; inhibition; integration; thalamocortical.


Figures

Figure 1.
Figure 1.
Overlap of thalamocortical and amygdalocortical axonal fields in GC. A, Representative injection site of AAV9-GFP in VPMpc. Coronal section imaged at 20× magnification showing GFP-filled neurons (green) and Hoechst counterstain (blue). B, Representative injection site of AAV9-RFP in BLA. Coronal section at 15× magnification showing RFP-filled neurons (red) and Hoechst counterstain (blue). C, Coronal section of GC at 40× magnification showing GFP-labeled axons from VPMpc (green; bottom left), RFP-labeled axons from BLA (red; top right), counterstain with fluorescent Nissl (cyan; top left), and merge (bottom right). White lines indicate 2-mm linear ROIs used to measure fluorescence intensity dorsoventrally through GC from somatosensory to Pir.; ROI A sampled superficial GC layers (2/3 and 4) while ROI B sampled deep layers (5 and 6). gGC, granular GC; dGC, dysgranular GC; aGC, agranular GC. D, Mean ± SD normalized fluorescence intensity versus DV depth measured in two ROIs, the superficial (ROI A) and deep (ROI B) cortical layers (n = 9; 3 slices from each of three rats). While VPMpc fluorescence (green) intensity was greater in the dorsal subdivisions (granular/dysgranular) and BLA fluorescence intensity (red) was greater in the ventral subdivisions (dysgranular/agranular), there was area of overlap between the two inputs. y-axis: DV distance (μm); x-axis: normalized fluorescence intensity. E, 60× magnification of a ROI in dysgranular GC from the slice shown in panel C. Labeled fibers from VPMpc (green; bottom left), BLA (red; top right), counterstaining with fluorescent Nissl (blue; top left), and merge (bottom right).
Figure 2.
Figure 2.
Intracellular recordings from pyramidal neurons in GC of urethane-anesthetized rats. A, Representative trace of spontaneous activity recorded with a sharp electrode at resting membrane potential, −80 mV, and concurrent parietal EEG recording. B, Reconstruction of a pyramidal cell filled with biocytin in dysgranular GC. C, The cell from panel A’s responses to injected hyperpolarizing and depolarizing DC current steps. D, Mean ± SEM f/I curve for n = 26 cells. Firing properties observed for each cell resembled regular spiking pyramidal neurons. y-axis: firing frequency; x-axis: injected current (pA).
Figure 3.
Figure 3.
Stimulation of the gustatory thalamus evokes time-varying PSP in GC neurons. A, Representative cresyl violet-stained coronal section showing the electrolytic lesion made by the tip of the stimulating electrode in VPMpc (arrow). VPMpc, ventroposteriomedial, parvocellular thalamus; VPM, ventroposteriomedial thalamus; VPL, ventroposteriolateral thalamus; VM, ventromedial thalamus; ZI, zona incerta; PH, posterior hypothalamus. B, Representative trace of a multi-unit response to the application of cold 0.3 M NaCl to the oral cavity as recorded by the VPMpc stimulating electrode. For each animal, the final DV coordinate of the VPMpc electrode was determined by where the greatest response to tasting solution was found. In this example, the depth was −6.5 mm from the pial surface. C, Representative synaptic response of a GC neuron to VPMpc stimulation at resting membrane potential, −77 mV. EPSP amplitude increases with intensity, resulting in an action potential at the greatest intensity. Inset, Mean ± SEM population intensity/response curve, normalized within each cell (n = 14). y-axis: normalized PSP amplitude; x-axis: normalized stimulation intensity. D, Example trace of a cell responding to VPMpc stimulation with a monosynaptic EPSP followed by multi-synaptic inhibition, unveiled by stimulating with constant intensity at multiple holding potentials (n = 5/10). Shaded lines indicate the times post-PSP onset where amplitudes were measured for determining the reversal potential of the components of the PSP: open circle, 3–5 ms post-onset; black triangle, 35 ms post-onset. E, Example trace of a cell responding to VPMpc stimulation with a monosynaptic EPSP followed by an upstate (n = 5/10). No inhibition could be unveiled by depolarizing holding potentials. Shaded line with open circle indicates amplitude was measured 3–5 ms post-PSP onset for determining reversal potential. F, Population plot of reversal potentials for early component of PSP (open circles: 3–5 ms post-onset; n = 10) and late component (black triangles: 35 ms post-onset; n = 5). Reversal potentials were calculated by linear regression, represented by the lines on the graph. y-axis: normalized PSP amplitude; x-axis: holding potential (mV).
Figure 4.
Figure 4.
DV depth profile of GC neurons receiving input from VPMpc or BLA. A, Representative cresyl violet-stained coronal section showing the electrolytic lesion made by the tip of the stimulating electrode in BLA (arrow). BLA, anterior BLA; BLP, posterior BLA; BLV, ventral BLA; I, intercalated nuclei of the amygdala; EC, external capsule. B, Stereotaxic area in which we searched for GC cells for intracellular recording. The craniotomy was centered around AP + 1.5 mm, ML – 5.0 mm from bregma. Gray shading: search area, −4 to −6 mm ventral as measured from the pial surface, sampled with our recordings. Our search area covered all subdivisions of GC. CL., claustrum; GI, granular subdivision; DI, dysgranular subdivision; AID, dorsal agranular subdivision; AIV, ventral agranular subdivision. C, Data were pooled as described in Materials and Methods, and the frequency distribution of cells responding to each stimulation type was plotted against the recording depth of the cell: VPMpc responsive (black bars; n = 42) and BLA responsive (gray bars; n = 61). Right panel, Cumulative sum of frequency comparing cells responding to BLA and VPMpc stimulation. y-axis: recording depth from pia, between −4 and −6 mm; x-axis: frequency. Asterisk indicates KS test p < 0.05.
Figure 5.
Figure 5.
Time-dependent modulation of VPMpc-PSPs by preceding BLA stimulation. A, Frequency distribution of cells responsive to both BLA and VPMpc plotted against recording depth (light gray bars; n = 30). y-axis: recording depth from pia, between −4 and −6 mm; x-axis: frequency. B, Example traces recorded at resting membrane potential, −78 mV, from a GC cell 4.4 mm ventral from the pial surface. Left, black trace, Evoked PSP to BLA stimulation alone (sBLA). Black arrow indicates BLA stimulation onset. Right, blue trace, Evoked PSP to VPMpc stimulation alone (sVPMpc). Green arrow indicates VPMpc stimulation onset. C, Evoked PSPs in the same cell for a single BLA shock followed by a single VPMpc shock (sBLA+sVPMpc) at latencies of 0, 10, and 50 ms (black traces). Superimposed blue traces reflect the evoked PSP at baseline (sVPMpc), as in panel A, to facilitate comparing PSP amplitudes. This cell exhibits the typical response pattern: enhanced PSP amplitude at short latency and shunted PSP amplitude at longer latency. D, Population data from n = 5 cells tested. Left panel, Normalized amplitudes of evoked sBLA+sVPMpc-PSP at varying interstimulus latencies. y-axis: normalized mean ± SEM PSP amplitude; x-axis: effective interstimulus latency (ms). Right panel, Effective interstimulus latency was binned and sBLA+sVPMpc-PSP amplitudes from the population of cells were averaged. y-axis: normalized mean ± SEM PSP amplitude; x-axis: binned interstimulus latency (ms). Asterisks indicate p < 0.01.
Figure 6.
Figure 6.
Two populations of GC neurons with distinct BLA modulation of VPMpc-PSPs. A, top left panel, Traces from a cell representing the group of n = 5/8 that show suppressed VPMpc-PSP amplitude following a BLA burst, recorded −4.2 mm ventral to pia. A single VPMpc stimulus (sVPMpc; black arrow) was delivered under baseline conditions; 500–1500 ms later, a 500-ms, 20-Hz BLA burst (bBLA) was delivered and then followed by a VPMpc stimulus (bBLA+sVPMpc; green arrow) at a latency of 50 ms (gray traces: 16 overlaid trials; black trace: average of 16 trials). Inset, Close-up comparison of VPMpc-PSP amplitudes evoked under baseline conditions (black trace), 50 ms after a BLA burst (green trace), and at a comparable Vm to the post-burst trace, maintained by DC current injection (blue trace). Top right panel, Raw data for peak VPMpc-PSP amplitudes (gray circles) and mean ± SEM (white rectangles) for the traces pictured. Lines connect amplitudes recorded during the same trial. Asterisks indicate p < 0.01. y-axis: PSP amplitude (mV); x-axis: sVPMpc and bBLA+sVPMpc. Middle panel, bBLA+sVPMpc latency of 250 ms. Bottom panel, bBLA+sVPMpc latency of 500 ms. B, top left panel, Traces from a cell representing the group of n = 3/8 that show increased VPMpc-PSP amplitude following a BLA burst, recorded −4.6 mm ventral to pia. A single VPMpc stimulus (sVPMpc; black arrow) was delivered under baseline conditions; 500–1500 ms later, a 500-ms, 20-Hz BLA burst (bBLA) was delivered and then followed by a VPMpc stimulus (bBLA+sVPMpc; green arrow) at a latency of 50 ms (gray traces: 16 overlaid trials; black trace: average of 16 trials). Inset, Close-up comparison of VPMpc-PSP amplitudes evoked under baseline conditions (black trace), 50 ms after a BLA burst (green trace), and at a comparable Vm to the post-burst trace, maintained by DC current injection (blue trace). Top right panel, Raw data for peak VPMpc-PSP amplitudes (gray circles) and mean ± SEM (white rectangles) for the traces pictured. Lines connect amplitudes recorded during the same trial. Asterisks indicate p < 0.01. y-axis: PSP amplitude (mV); x-axis: sVPMpc and bBLA+sVPMpc. Middle panel, bBLA+sVPMpc latency of 250 ms. Bottom panel, bBLA+sVPMpc latency of 500 ms.
Figure 7.
Figure 7.
BLA bursts modulate VPMpc-PSP amplitude and temporal dynamics. A, For each cell and post-BLA burst latency tested, the average amplitude of the evoked VPMpc-PSP under baseline conditions (sVPMpc) was used to normalize the amplitude of the evoked post-burst PSP (bBLA+VPMpc). These normalized amplitudes were then averaged across cells with the same response pattern and plotted. Left panel, Group of n = 5/8 cells (as in Fig. 6A), where the VPMpc-PSP was depressed following a BLA burst. Each cell’s mean, normalized PSP amplitude (gray circles) and the group mean ± SEM (light gray bars) is shown for each latency tested. Asterisks indicate p < 0.01. Right panel, Group of n = 3/8 cells (as in Fig. 6B), where the VPMpc-PSP was enhanced following a BLA burst. Each cell’s mean, normalized PSP amplitude (gray circles) and the group mean ± SEM (white bars) is shown for each latency tested. Asterisks indicate p < 0.01. y-axis: normalized bBLA+sVPMpc-PSP amplitude; x-axis: post-BLA burst latency (ms). B, left panel, Representative trace from a GC cell recorded 4.8 mm ventral from the pia to VPMpc stimulation under control conditions (sVPMpc; top trace) and 250 ms following a BLA burst (bBLA+sVPMpc, bottom trace). Gray traces: 16 overlaid trials. Black trace: Average of 16 trials. Right panel, CV was calculated from the peak PSP amplitudes evoked by VPMpc stimulation at post-BLA burst latencies of 50, 250, and 500 ms and normalized to the CV calculated under baseline conditions. Each cell’s mean, normalized CV (n = 8; gray circles) and group mean ±SEM (white bars) are shown. Asterisks indicate p < 0.05. y-axis: normalized CV for bBLA+sVPMpc-PSP; x-axis: post-BLA burst latency (ms). C, VPMpc-PSP onset latency was measured under baseline conditions (sVPMpc) and following a BLA burst (bBLA+sVPMpc) at latencies of 50, 250, and 500 ms. The PSP onset latency was significantly increased at each post-burst interval as compared with baseline, with the strongest effect at 50 ms. Asterisks indicate p < 0.05. y-axis: normalized bBLA+sVPMpc-PSP onset latency; x-axis: post-BLA burst latency (ms). D, VPMpc-PSP time-to-peak was measured from stimulus onset under baseline conditions (sVPMpc) and following a BLA burst (bBLA+sVPMpc) at latencies of 50, 250, and 500 ms. The PSP time-to-peak was significantly smaller at a post-burst latency of 50 ms and larger at 250- and 500-ms latencies. Asterisks indicate p < 0.05. y-axis: normalized bBLA+sVPMpc-PSP time-to-peak from stimulus onset; x-axis: post-BLA burst latency (ms). E, VPMpc-PSP time-to-peak was measured from PSP onset under baseline conditions (sVPMpc) and following a BLA burst (bBLA+sVPMpc) at latencies of 50, 250, and 500 ms. The PSP time-to-peak was significantly smaller at a post-burst latency of 50 ms and larger at 500-ms latency. Asterisks indicate p < 0.05. y-axis: normalized bBLA+sVPMpc-PSP time-to-peak from PSP onset; x-axis: post-BLA burst latency (ms).
Figure 8.
Figure 8.
Local recruitment of inhibition determines the sign of BLA modulation of VPMpc. A, left panel, Example traces for comparison of the size of the excitatory and inhibitory components of the sBLA-PSP measured at Vm for a cell from the suppression group (e.g., top trace) and from the facilitation group (e.g., bottom trace). Black arrow indicates BLA stimulus onset. Middle panel, Average ± SEM of the EPSP and IPSP amplitudes measured in the suppression group (gray bars) and the facilitation group (white bars) when BLA was stimulated at rest. Asterisks indicate p < 0.05. y-axis: sBLA-PSP amplitude (mV). Right panel, % contribution of the IPSP amplitude to total response height for the suppression group (gray bar) and the facilitation group (white bar). B, left panel, Example traces for comparison of the size of the excitatory and inhibitory components of the sVPMpc-PSP measured at Vm for a cell from the suppression group (e.g., top trace) and from the facilitation group (e.g., bottom trace). These cells are the same as in A. Black arrow indicates VPMpc stimulus onset. Middle panel, Average ± SEM of the EPSP and IPSP amplitudes measured in the suppression group (gray bars) and the facilitation group (white bars) when VPMpc was stimulated at rest. y-axis: sVPMpc-PSP amplitude (mV). Right panel, % contribution of the IPSP amplitude to total response height for the suppression group (gray bar) and the facilitation group (white bar).

Similar articles

Cited by

References

    1. Allen GV, Saper CB, Hurley KM, Cechetto DF (1991) Organization of visceral and limbic connections in the insular cortex of the rat. J Comp Neurol 311:1–16. 10.1002/cne.903110102 - DOI - PubMed
    1. Aschauer DF, Kreuz S, Rumpel S (2013) Analysis of transduction efficiency, tropism and axonal transport of AAV serotypes 1, 2, 5, 6, 8 and 9 in the mouse brain. PLoS One 8:e76310. 10.1371/journal.pone.0076310 - DOI - PMC - PubMed
    1. Calhoon GG, O'Donnell P (2013) Closing the gate in the limbic striatum: Prefrontal suppression of hippocampal and thalamic inputs. Neuron 78:181–190. 10.1016/j.neuron.2013.01.032 - DOI - PMC - PubMed
    1. Escobar ML, Bermúdez-Rattoni F (2000) Long-term potentiation in the insular cortex enhances conditioned taste aversion retention. Brain Res 852:208–212. 10.1016/s0006-8993(99)02134-4 - DOI - PubMed
    1. Escobar ML, Alcocer I, Bermúdez-Rattoni F (2002) In vivo effects of intracortical administration of NMDA and metabotropic glutamate receptors antagonists on neocortical long-term potentiation and conditioned taste aversion. Behav Brain Res 129:101–106. 10.1016/s0166-4328(01)00329-1 - DOI - PubMed

Publication types

LinkOut - more resources