. 2020 Feb 4;13(617):eaax8620.
doi: 10.1126/scisignal.aax8620.

Probing the mutational landscape of regulators of G protein signaling proteins in cancer

Affiliations

Probing the mutational landscape of regulators of G protein signaling proteins in cancer

Vincent DiGiacomo et al. Sci Signal. .

Abstract

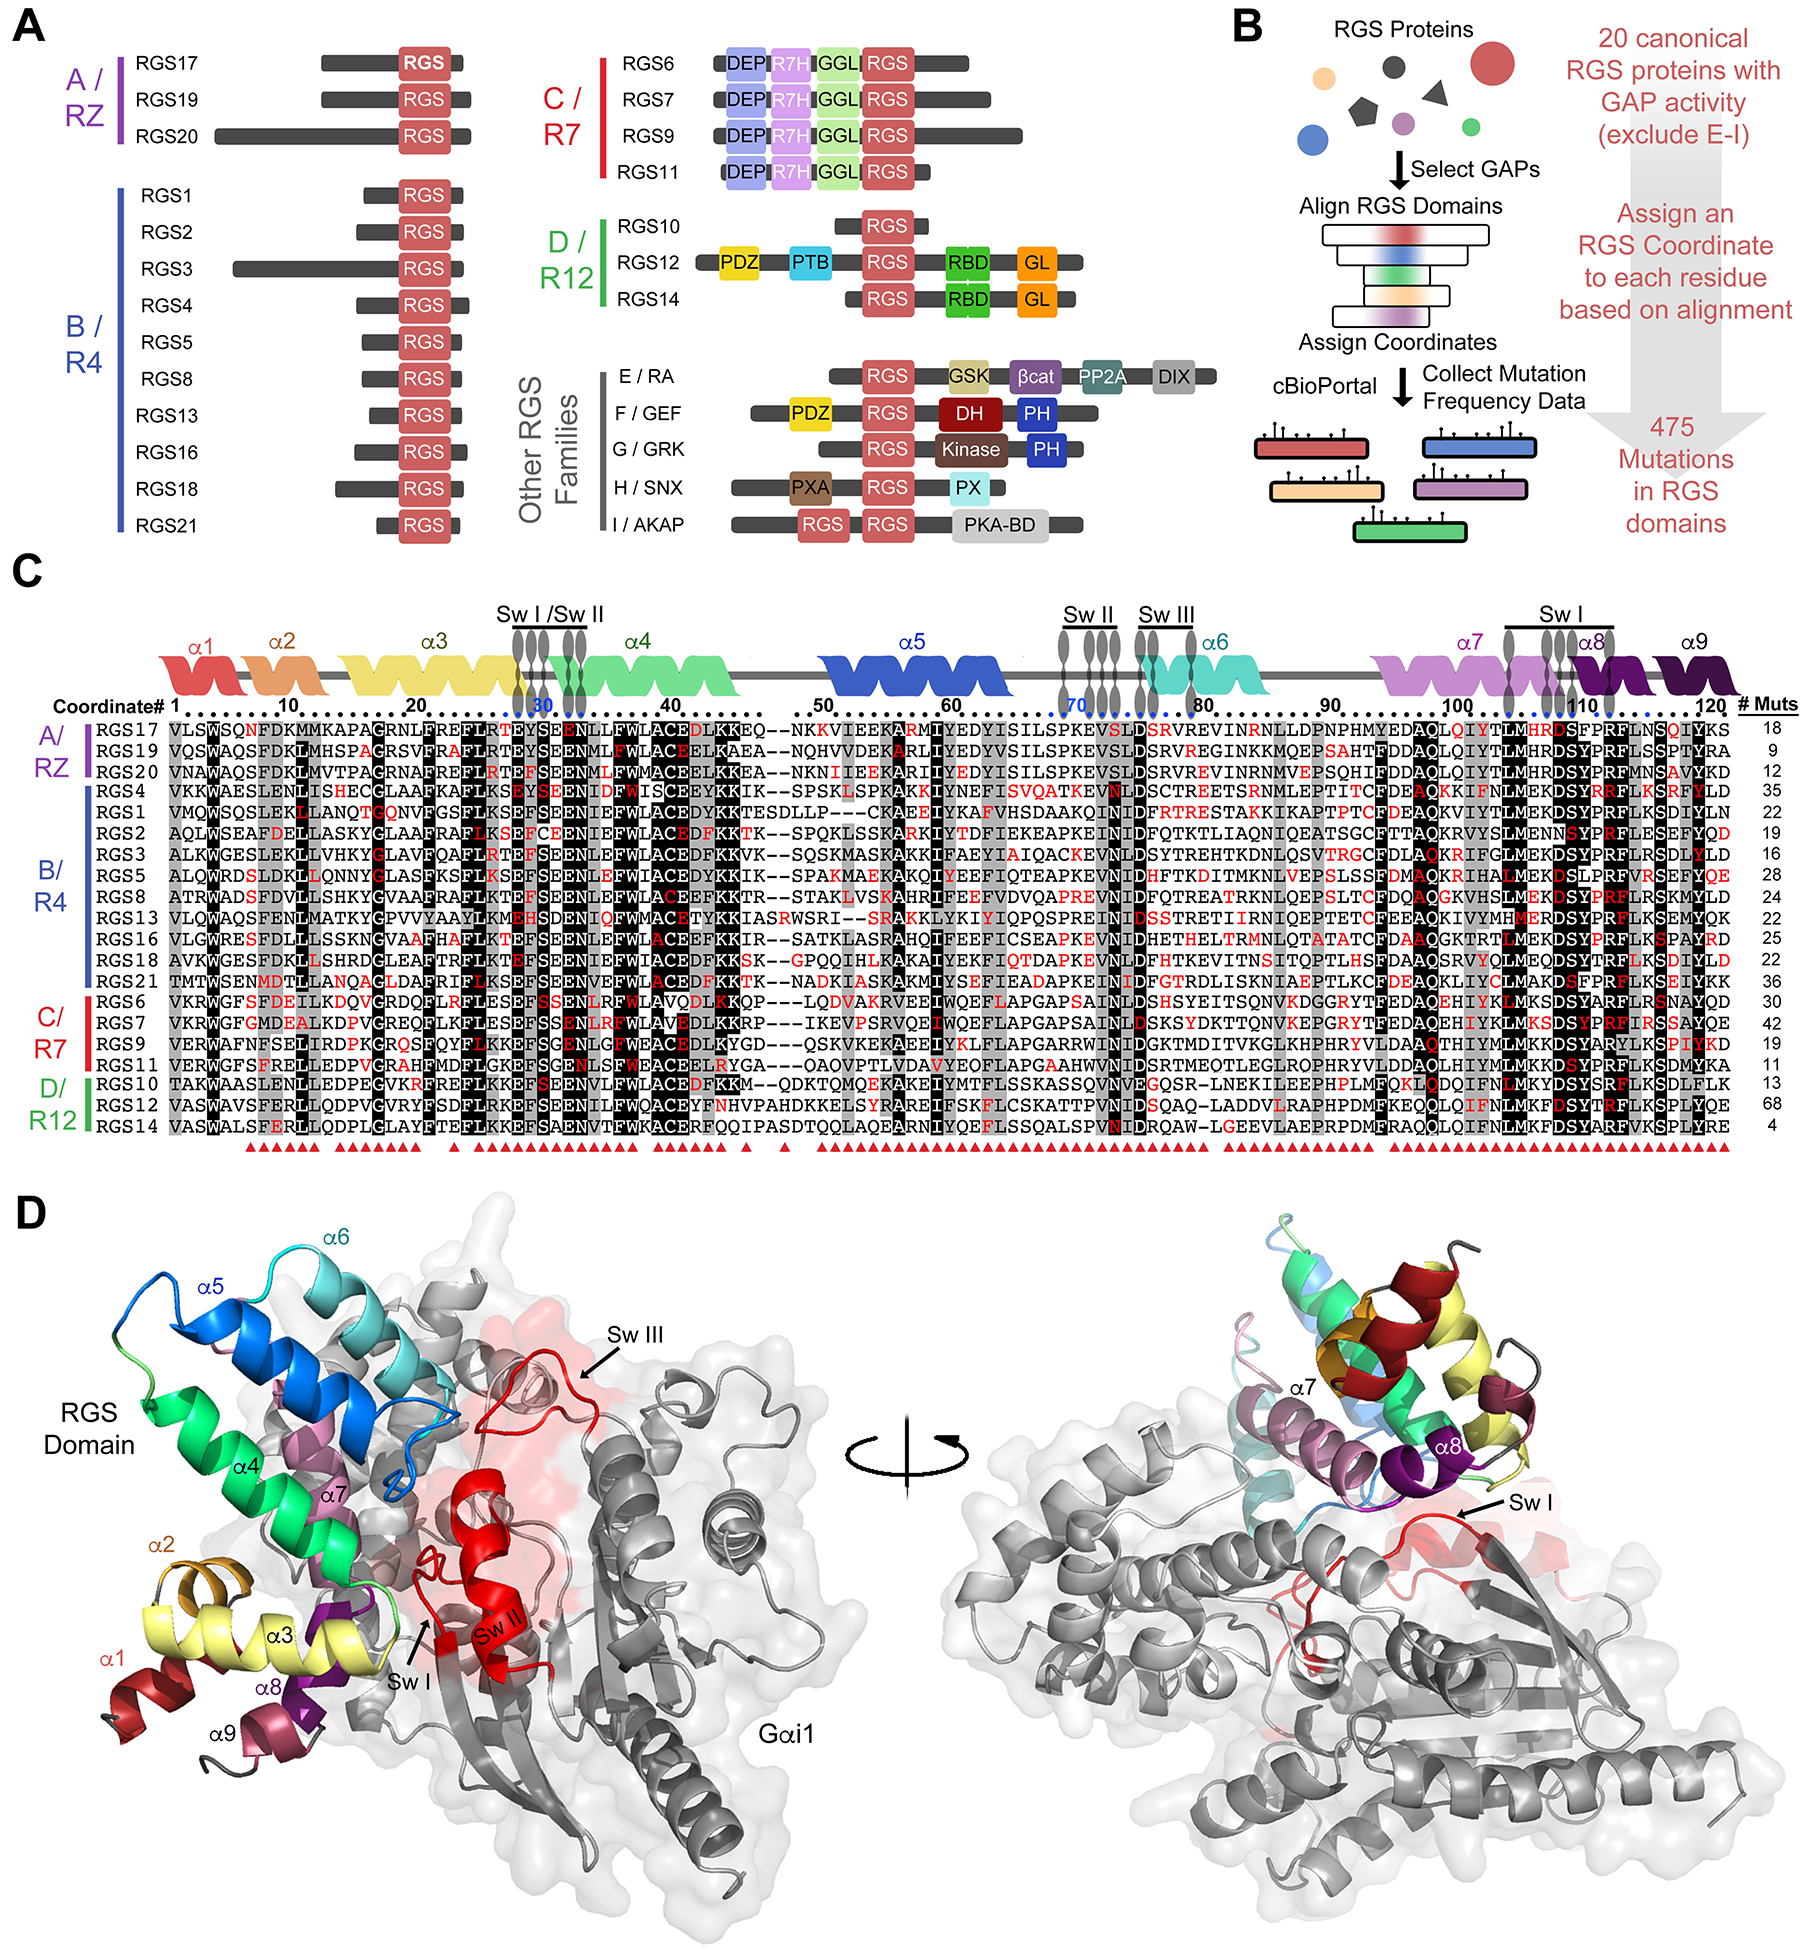
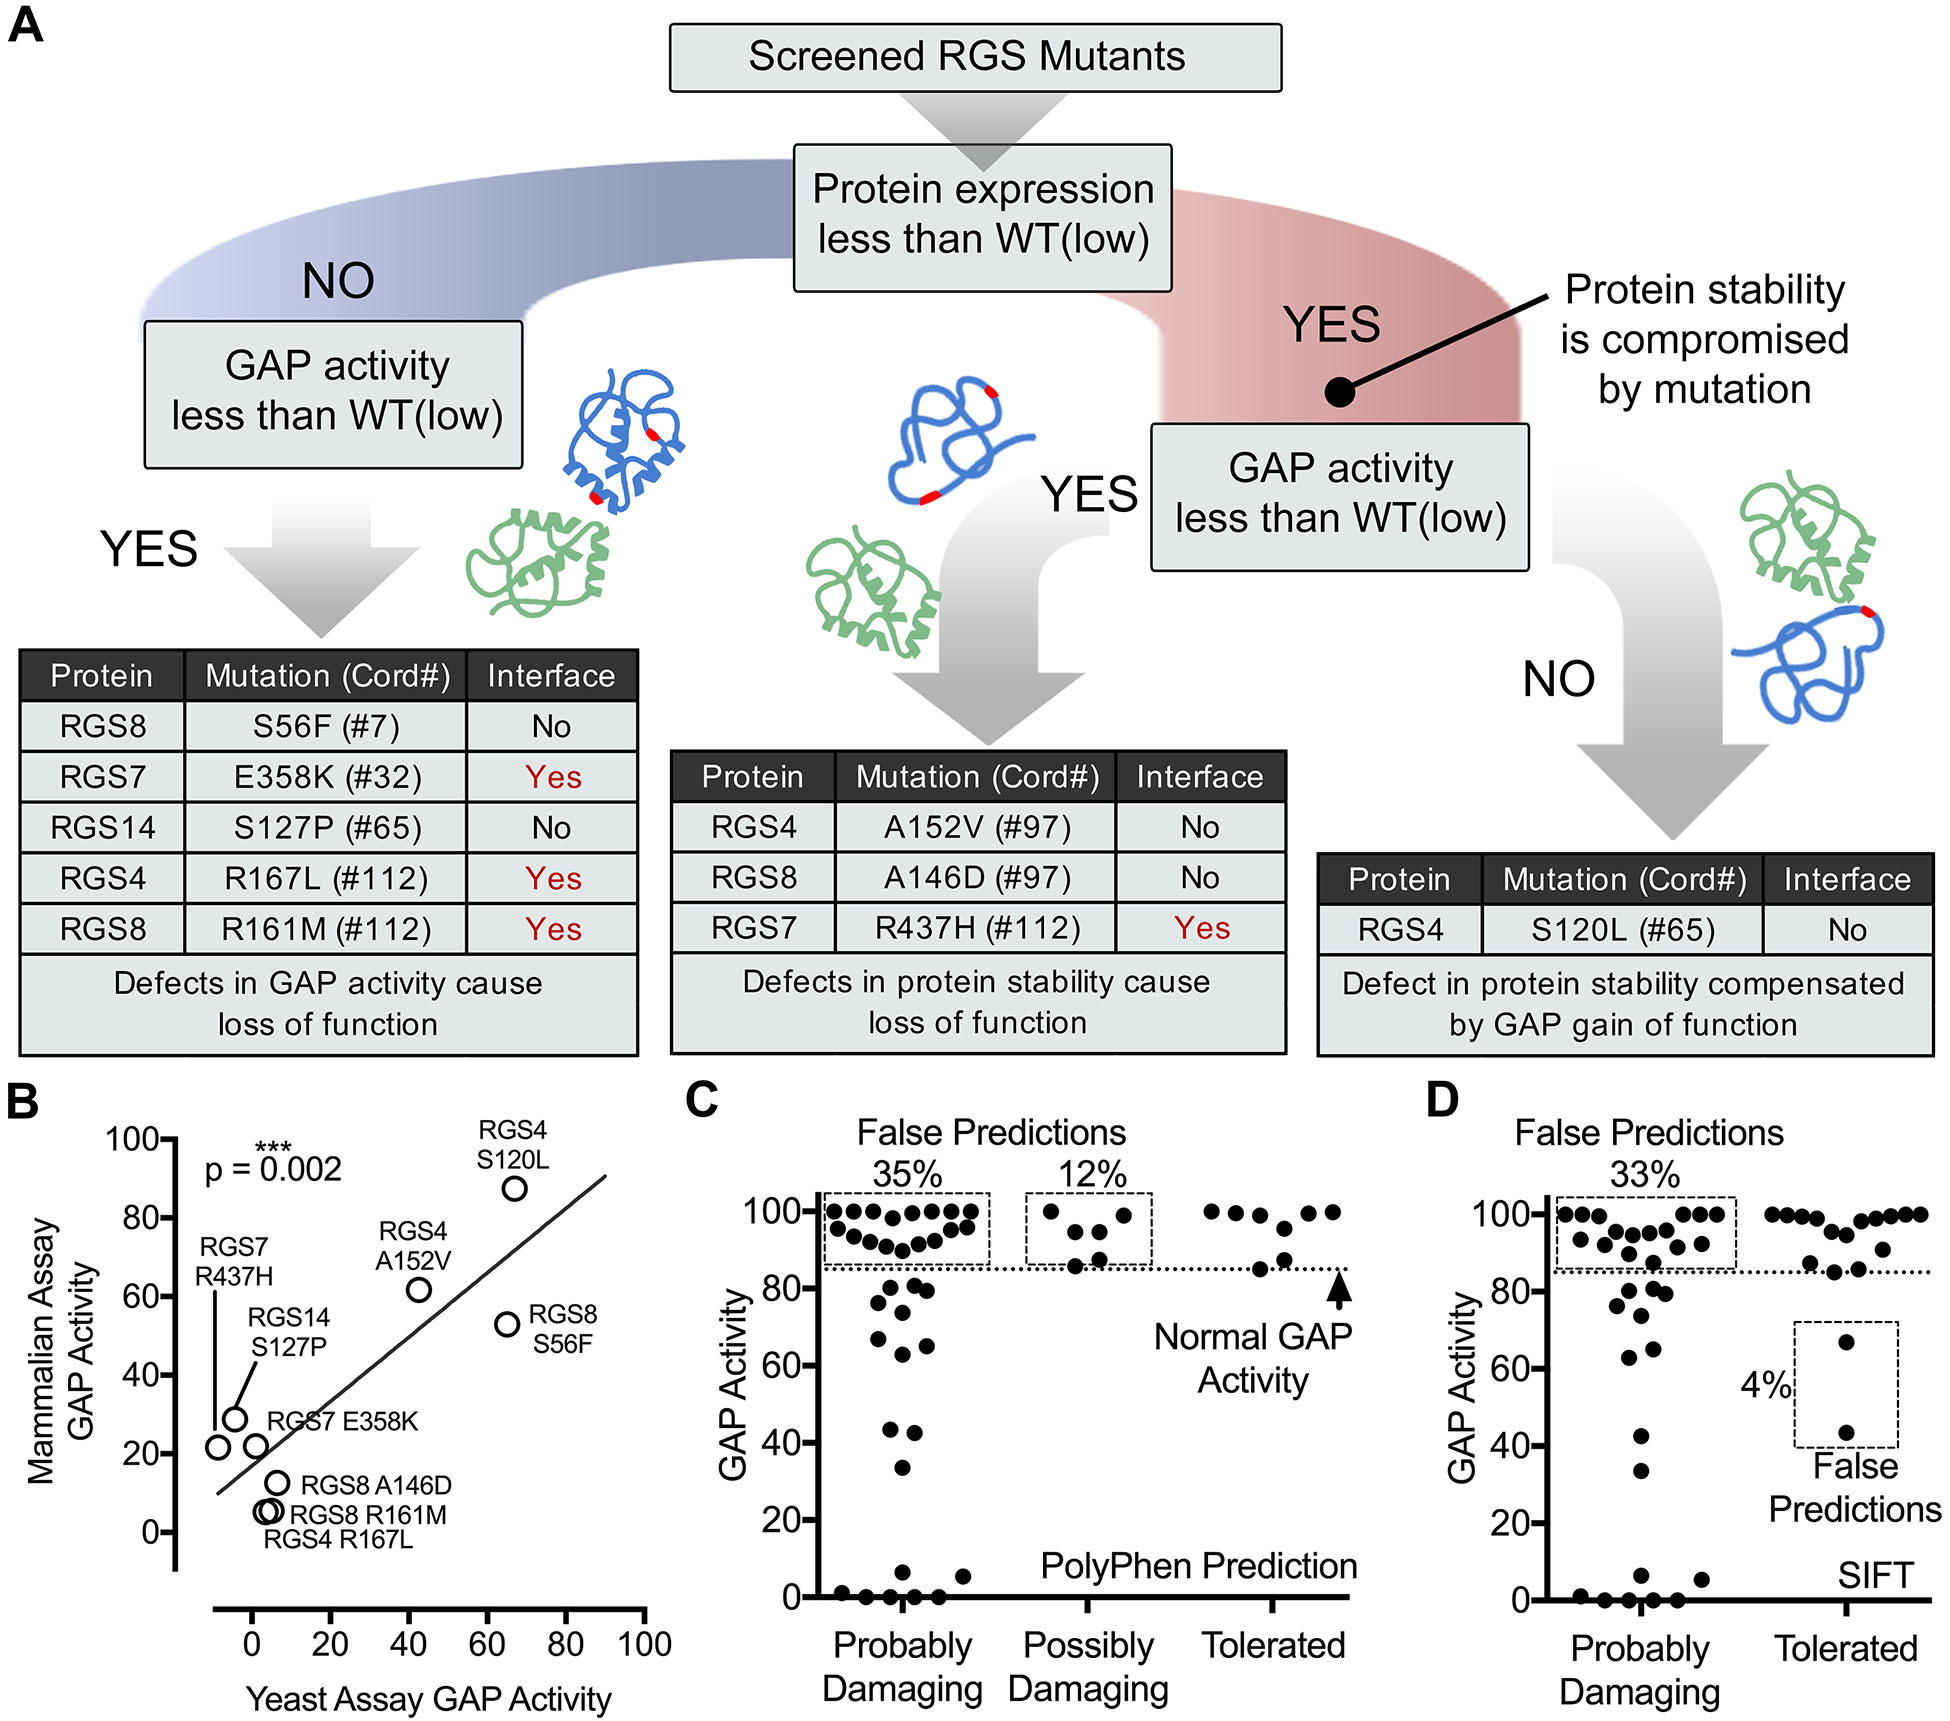
The advent of deep-sequencing techniques has revealed that mutations in G protein-coupled receptor (GPCR) signaling pathways in cancer are more prominent than was previously appreciated. An emergent theme is that cancer-associated mutations tend to cause enhanced GPCR pathway activation to favor oncogenicity. Regulators of G protein signaling (RGS) proteins are critical modulators of GPCR signaling that dampen the activity of heterotrimeric G proteins through their GTPase-accelerating protein (GAP) activity, which is conferred by a conserved domain dubbed the "RGS-box." Here, we developed an experimental pipeline to systematically assess the mutational landscape of RGS GAPs in cancer. A pan-cancer bioinformatics analysis of the 20 RGS domains with GAP activity revealed hundreds of low-frequency mutations spread throughout the conserved RGS domain structure with a slight enrichment at positions that interface with G proteins. We empirically tested multiple mutations representing all RGS GAP subfamilies and sampling both G protein interface and noninterface positions with a scalable, yeast-based assay. Last, a subset of mutants was validated using G protein activity biosensors in mammalian cells. Our findings reveal that a sizable fraction of RGS protein mutations leads to a loss of function through various mechanisms, including disruption of the G protein-binding interface, loss of protein stability, or allosteric effects on G protein coupling. Moreover, our results also validate a scalable pipeline for the rapid characterization of cancer-associated mutations in RGS proteins.


Conflict of interest statement

Competing interests: The authors declare that they have no competing interests.

Figures

Fig. 1.
Fig. 1.. The cancer mutational landscape of canonical RGS-box domains with GAP activity.
(A) Canonical RGS proteins with GAP activity toward Gi/o, Gq/11, or both are classified into four families (A/RZ, B/R4, C/R7, and D/R12), all of which contain a conserved RGS domain (red box). RGS-like domains are found in other proteins without GAP activity toward Gi/o, Gq/11, or both, which constitute other RGS protein families (E/RA, F/GEF, G/GRK, H/SNX, and I/AKAP). The approximate sizes of the proteins and the locations of domains are shown to reflect the diversity among the different families and individual proteins. (B) Workflow for the mining of cancer genomic data and comparative analysis of cancer-associated mutations found in the RGS domain of canonical GAPs. (C) Alignment of the RGS domains of all the 20 canonical RGS GAPs in humans and the amino acid positions mutated in cancer. Each position in the alignment is assigned a coordinate number (#) relative to the first residue of the RGS-box domain of RGS4 (numbers above the alignment) to facilitate the comparison of sequence and mutation prevalence at any given position across multiple RGS proteins. The secondary structure elements of RGS4 are indicated above the sequence by colored helices, and the positions that make contact with each one of the three switch regions (Sw I, Sw II, and Sw III) of Gαi1 are indicated by blue dots. Amino acids found to be mutated in the cBioPortal database are indicated in red. Conservation of identical residues in ≥50% of the sequences is indicated by black shading, whereas conservation of similar residues is indicated by gray shading. Red arrowheads beneath the alignment indicate that a given RGS protein coordinate is mutated at least once. (D) Three-dimensional (3D) rendering of the structure of Gαi1 (in gray with the switch regions in red) in complex with RGS4 [color-coded as in the secondary structure diagram above the sequences shown in (C)]. PDB: 1AGR.
Fig. 2.
Fig. 2.. Bioinformatics analysis of cancer-associated mutations in the RGS-box domain.
(A) Classification of cancer-associated mutations found in all 20 RGS-box domains by mutation type (total number and percentage). (B) Position-based frequency of mutations in the RGS domain. The number of mutations found for each alignment-based RGS-box domain coordinate position across all 20 RGS proteins was integrated and presented as a “lollipop plot.” (C) Localization of frequent missense mutations in the 3D structure of the RGS domain. Left: Structure of a representative RGS domain (RGS4, gray) bound to active Gαi1 (green). Middle and right: The integrated mutation frequency at a given RGS protein coordinate is color-coded (bottom bar of middle panel) mapped onto the representative RGS protein structure (right). (D) RGS protein amino acid positions at the G protein interface (within 5Å of Gα) are more frequently mutated than are non-interface positions. The indicated P value was determined with the Mann-Whitney U test. (E and F) At least 60% of RGS domain missense mutations are predicted to disrupt protein function according to PolyPhen (E) and SIFT (F). Results are presented as scatter plots of the scores for each cancer-associated RGS protein missense mutation (left) and the percentage of mutation in each category of the prediction (right; tolerated/ possibly damaging/ probably damaging). (G) RGS protein amino acids at the G protein interface (“I”) are more frequently predicted to disrupt protein function than those at non-interface positions (“N.I”) according to PolyPhen (left) and SIFT (right) disruption categories. The color code used is the same as that in (E). The indicated P values were determined by the χ2 test for PolyPhen and by Fisher’s exact test for SIFT.
Fig. 3.
Fig. 3.. Systematic assessment of cancer-associated RGS protein mutations on GAP activity using a scalable yeast-based assay.
(A) Criteria for selecting a representative set of 49 cancer-associated mutations in RGS domains to screen for potential disruptive effects. (B) Diagram of the yeast-based β-galactosidase (β-gal) assay used to assess the function of mutant RGS proteins in inhibiting human G protein signaling. AGS1 stimulates the G protein–dependent activation of the Fus1 promoter in yeast lacking pheromone-responsive GPCRs through Gβγ. This activation response is suppressed by the GAP activity of RGS proteins, which accelerate the deactivation of human Gαi3. (C) Representative readout of the β-gal assay described in (B). Inhibition of AGS1-dependent G protein activation by a WT or mutant RGS protein was determined with a fluorogenic β-galactosidase substrate in a 96-well format. (D) Effects of different RGS8 mutants on G protein activation in yeast. β-gal activity (normalized to the percentage of maximal activation, “AGS1 only”) was used to calculate the relative GAP activity using the inset equation. Data are means ± SEM of six experiments. **P < 0.01 and ***P < 0.001 as compared to “AGS1 only” (black asterisks) or to “AGS1 + RGS8 WT” (red asterisks) by one-way ANOVA with Bonferroni multiple-comparisons test. (E) Effects of the selected 49 RGS protein cancer-associated mutations on GAP activity in the yeast-based G protein activity assay. Relative GAP activity was determined relative to the respective RGS WT protein for each mutant as described for (D). Background is shaded yellow, orange, and red, respectively, to indicate mild (75 to 50% of WT), moderate (50 to 25% of WT), and severe (25 to 0% of WT) reductions in GAP activity. Results are means ± SEM of at least six experiments. (F) Percentage of screened mutations that severely, moderately, or mildly affected GAP function as described for (E) when considered in aggregate (“All mutants”) or when stratified as “Interface” (within 5Å of Gα) or “Non-interface” positions.
Fig. 4.
Fig. 4.. Selection of RGS protein mutants for validation in mammalian cells using a BRET-based G protein activity biosensor.
(A) Left: Selection of a representative set of 9 RGS-box cancer-associated mutations from the 49 that were assessed in yeast. Criteria for selection (shown in the table) included sampling mutations with various degrees of defective GAP activity in yeast, as well as position within and outside the G protein interface, among others. Right: The protein structure depicts the positions of the selected mutations (colored yellow or red according to the increasing frequency of mutation at that coordinate) are shown relative to the Gα interface (green). (B) Description of the assay to assess RGS protein GAP activity in mammalian cells using a BRET-based biosensor. Agonist-induced GPCR activation leads to the dissociation of Venus-tagged Gβγ from Gα, which in turn binds to the c-terminal domain of GRK3 fused to nanoluciferase (Nluc) resulting in increased BRET. Subsequent addition of a GPCR antagonist causes a decline of the BRET signal upon G protein inactivation, which can be accelerated by the GAP activity of an RGS protein. Comparison of the acceleration of the deactivation rate in the presence of WT or mutant RGS proteins was used to determine their relative GAP activities.
Fig. 5.
Fig. 5.. Representative cancer-associated mutations show different degrees of GAP activity disruption across multiple RGS proteins.
(A to P) The effects of RGS protein mutations on Gi signaling deactivation rates and relative RGS protein abundances were assessed for full-length RGS4 (A to D), RGS8 (E to H), RGS7 (I to L), and RGS14 (M to P). HEK293T cells were transfected with plasmids encoding the components of the BRET system and the GPCR α2-AR in the presence or absence (no GAP) of the indicated RGS proteins. For all RGS protein–expressing plasmids, 1.0 μg of DNA was used per transfection, except for the condition labeled WT(low), in which case, the cells were transfected with 0.5 μg of the appropriate plasmid. Cells were treated with 1 μM brimonidine at 30 s and 50 μM yohimbine at 90 s during BRET measurements. Data in (A), (E), (I), and (M) show traces of normalized BRET responses after the addition of antagonist (yohimbine). Data in (B), (F), (J), and (N) are scatter plots of the quantification of the deactivation rates (koff) for the indicated conditions. Results are means ± SEM of four experiments.*P < 0.05, **P < 0.01, ***P < 0.001. Red and gray asterisks indicate statistical significance with respect to the WT and WT(low) conditions, respectively, as determined by one-way ANOVA with Bonferroni multiple-comparisons test. Data in (C), (G), (K), and (O) are Western blots from two or three independent experiments. (D, H, L, and P) Structural models of the RGS domain indicating the position of the mutated residues (colored yellow or red according to the increasing frequency of mutation at that coordinate). (Q) Summary of the relative GAP activity of all of the examined mutants with respect to each corresponding WT RGS protein. Each mutant is clustered by its RGS protein coordinate (X-axis) designating its position in the representative RGS protein structure (as shown in Fig. 1). Background is shaded yellow, orange, and red, respectively, to indicate mild (75 to 50% of WT), moderate (50 to 25% of WT), and severe (25 to 0% of WT) reductions in GAP activity. Data are means ± SEM of four experiments. For quantification of Western blotting data, see table S2.
Fig. 6.
Fig. 6.. RGS protein cancer-associated mutations have similar effects on GAP activity toward Gαi and Gαq.
(A to H) The effects of RGS protein mutations on the deactivation rates of Gi signaling and RGS protein abundances were assessed for full-length RGS4 (A to D) and RGS8 (E to H). HEK293T cells were transfected with plasmids encoding the components of the BRET system and the GPCR M3R in the presence or absence (no GAP) of the indicated RGS proteins. For all RGS protein–expressing plasmids, 1.0 μg of DNA was used per transfection, except for the condition labeled WT(low), in which case, the cells were transfected with 0.5 μg of the appropriate plasmid.. Cells were treated with 100 μM carbachol at 30 s and 100 μM atropine at 90 s during BRET measurements. Data in (A) and (E) show traces of normalized BRET responses after the addition of antagonist (atropine). Data in (B) and (F) are scatter plots of the quantification of the deactivation rates (koff) for the indicated conditions. Data are means ± SEM of four experiments. *P < 0.05, **P < 0.01, ***P < 0.001. Red and gray asterisks indicate statistical significance with respect to the WT and WT(low) conditions, respectively, as assessed by one-way ANOVA with Bonferroni multiple-comparisons test. Data in (C) and (G) are representative Western blots from two experiments. (D and H) Structural models of the RGS domain indicating the position of the mutated residues (colored yellow or red according to the increasing frequency of mutation at that coordinate). (I) Summary of the relative GAP activity of all of the examined mutants with respect to each corresponding WT RGS proteins for both Gi and Gq signaling. Each mutant is clustered by its RGS protein coordinate (X-axis). Background is shaded yellow, orange, and red, respectively, to indicate mild (75 to 50% of WT), moderate (50 to 25% of WT), and severe (25 to 0% of WT) reductions in GAP activity. Data are means ± SEM of four experiments. (J) Correlation plot comparing the relative GAP activity on Gi and Gq signaling by each RGS protein mutant. The indicated P value was calculated from Pearson correlation.
Fig. 7.
Fig. 7.. Integrative analysis of RGS protein mutations reveals multiple loss-of-function mechanisms, correlation among assays, and false bioinformatics-based predictions.
(A) Summary of GAP-activity and protein abundance effects for the nine representative RGS protein mutations analyzed in mammalian cells. A putative cause of loss of function is given based on an assessment of the results presented earlier. (B) The effects of mutations on RGS GAP activity in the mammalian cell BRET assay correlates well with the effect on the GAP activity in the yeast-based assay. The indicated P value was calculated from Pearson correlation. (C and D) Comparisons of experimentally determined RGS GAP activities and bioinformatics-based predictions of the damaging effects of cancer-associated missense mutations. The GAP activity of 49 RGS domain mutations derived from the yeast-based assay is plotted for each of the damaging/tolerated categories of both PolyPhen (C) and SIFT (D) predictions. The percentage of false predictions (dotted boxes) is given where the functional screening and predictive methods do not agree.

Similar articles

Cited by

References

    1. Marx J, Nobel Prizes. Medicine: a signal award for discovering G proteins. Science (New York, N.Y 266, 368–369 (October 21, 1994). - PubMed
    1. Gilman AG, G proteins: transducers of receptor-generated signals. Annual review of biochemistry 56, 615–649 (1987). - PubMed
    1. Weis WI, Kobilka BK, The Molecular Basis of G Protein-Coupled Receptor Activation. Annual review of biochemistry 87, 897–919 (June 20, 2018). - PMC - PubMed
    1. Sriram K, Insel PA, G Protein-Coupled Receptors as Targets for Approved Drugs: How Many Targets and How Many Drugs? Mol Pharmacol 93, 251–258 (April, 2018). - PMC - PubMed
    1. Hopkins AL, Groom CR, The druggable genome. Nature reviews. Drug discovery 1, 727–730 (September, 2002). - PubMed

Publication types

MeSH terms

Substances