Comparative Study
. 2020 Feb 4;11(1):693.
doi: 10.1038/s41467-020-14422-w.

Abundance and diversity of resistomes differ between healthy human oral cavities and gut

Affiliations
Comparative Study

Abundance and diversity of resistomes differ between healthy human oral cavities and gut

Victoria R Carr et al. Nat Commun. .

Abstract

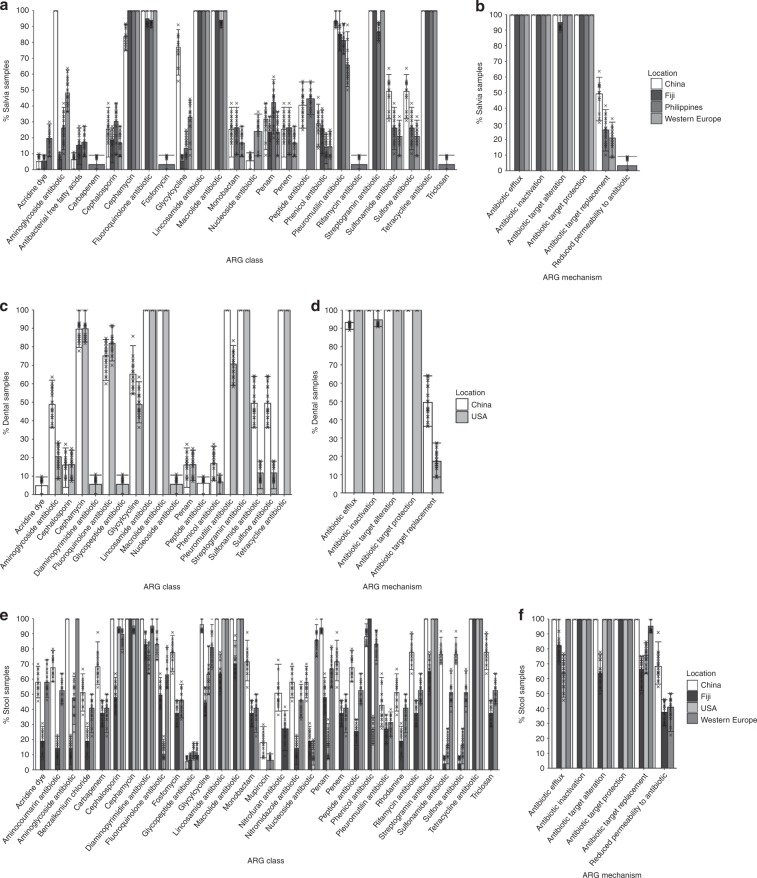
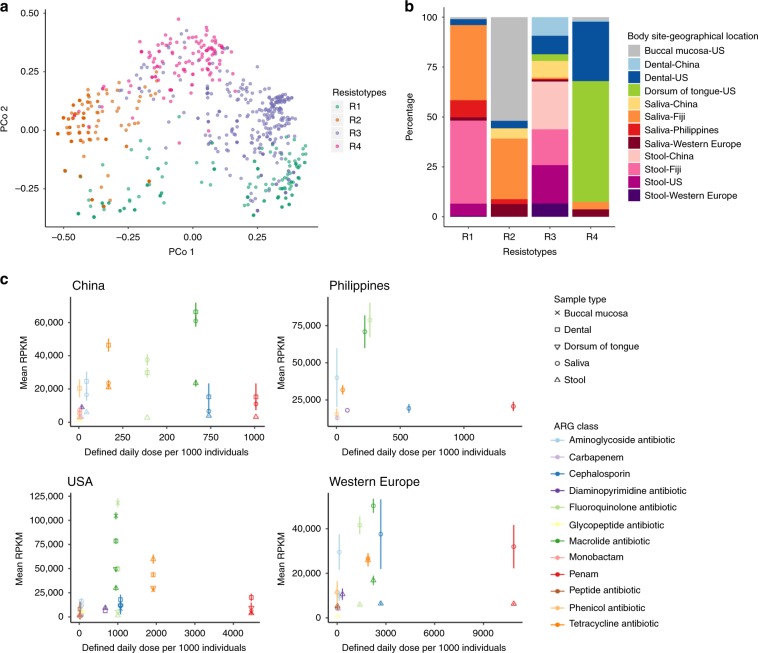
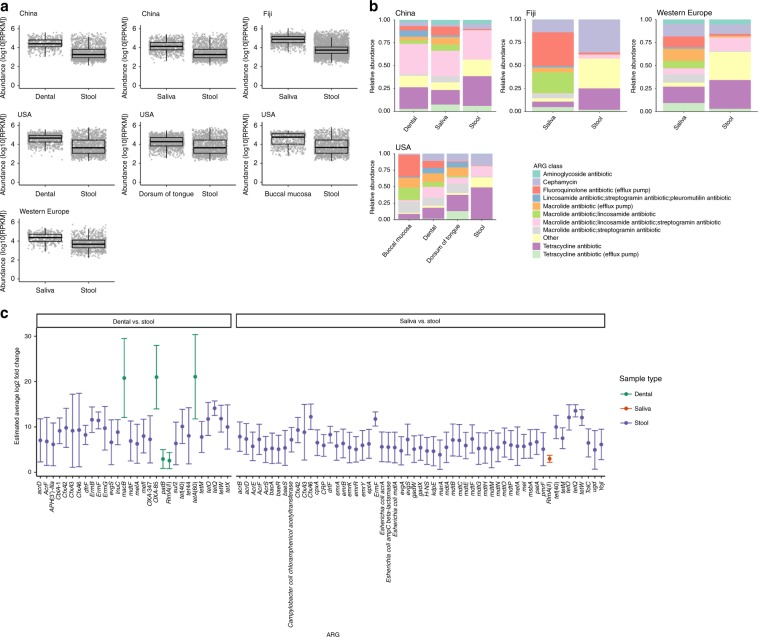
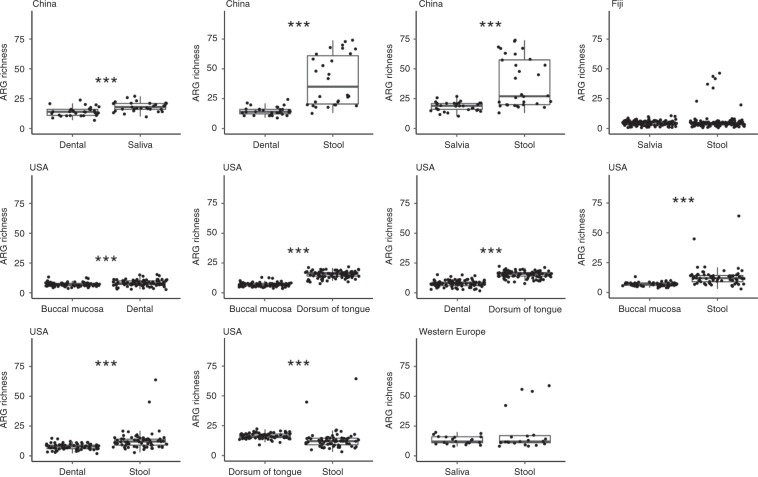
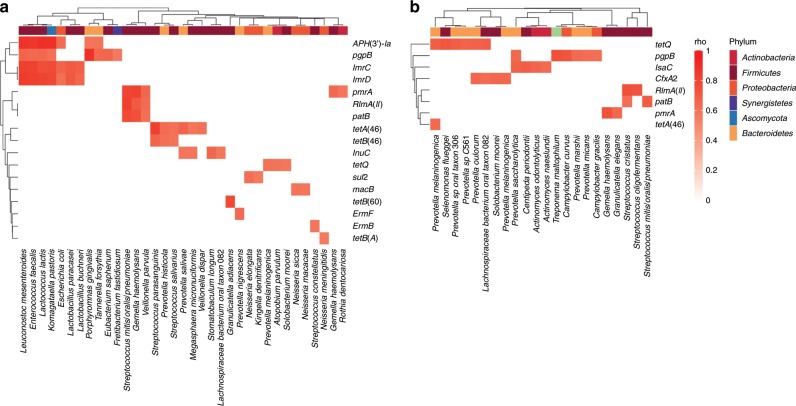
The global threat of antimicrobial resistance has driven the use of high-throughput sequencing techniques to monitor the profile of resistance genes, known as the resistome, in microbial populations. The human oral cavity contains a poorly explored reservoir of these genes. Here we analyse and compare the resistome profiles of 788 oral cavities worldwide with paired stool metagenomes. We find country and body site-specific differences in the prevalence of antimicrobial resistance genes, classes and mechanisms in oral and stool samples. Within individuals, the highest abundances of antimicrobial resistance genes are found in the oral cavity, but the oral cavity contains a lower diversity of resistance genes compared to the gut. Additionally, co-occurrence analysis shows contrasting ARG-species associations between saliva and stool samples. Maintenance and persistence of antimicrobial resistance is likely to vary across different body sites. Thus, we highlight the importance of characterising the resistome across body sites to uncover the antimicrobial resistance potential in the human body.


Conflict of interest statement

The authors declare no competing interests.

Figures

Fig. 1
Fig. 1. Percentage of individuals that contain ARG classes and ARG mechanisms.
Percentage of saliva samples that contain a an ARG class and b an ARG mechanism, of individuals from China (n = 18), Fiji (n = 18), the Philippines (n = 18) and Western Europe (n = 18). Percentage of dental plaque samples that contain c an ARG class and d an ARG mechanism, of individuals from China (n = 18) and the USA (n = 18). Percentage of stool samples that contain, e an ARG class and f an ARG mechanism, of individuals from China (n = 18), Fiji (n = 18), the USA (n = 18) and Western Europe (n = 18). The height of bars are the means and the error bars are 95% confidence intervals (CIs) of percentages extracted from bootstrapping samples 20 times shown by points. Source data are provided in the Source Data file.
Fig. 2
Fig. 2. Clustering of ARG incidence profiles into distinct groups, and comparing ARG abundance to antibiotic use.
a Principal Coordinates Analysis of the incidence (presence/absence) of ARGs for all samples where each sample is represented by a point. Samples are labelled as Resistotype clusters, evaluated from hierarchical clustering of binary distance between ARG incidence profiles. The number of clusters was selected with the highest silhouette width using silhouette analysis. Samples from individuals from China (dental plaque: n = 29, saliva: n = 33, stool: n = 72), Fiji (saliva: n = 129, stool: n = 136), the Philippines (saliva: n = 22), the USA (buccal mucosa: n = 86, dental plaque: n = 80, dorsum of tongue: n = 91, stool: n = 70) and Western Europe (saliva: n = 21, stool: n = 21). b Percentage of resistotypes that contain samples from a body site and geographical location. c Mean and standard error (error bars) of reads per kilobase of read per million (RPKM) of ARGs for each ARG class against the defined daily doses per 1000 individuals in 2015 from China, the Philippines, Western Europe (France and Germany) and the USA. (Fiji antibiotic use data unavailable.) Mean RPKM calculated from individuals from China (dental plaque: n = 32, saliva: n = 33, stool: n = 72), Philippines (saliva: n = 23), USA (buccal mucosa: n = 87, dental plaque: n = 90, dorsum of tongue: n = 91, stool: n = 70) and Western Europe (saliva: n = 21, stool: n = 21). Source data are provided in the Source Data file.
Fig. 3
Fig. 3. Comparing ARG abundance between the oral cavity and gut.
a Absolute abundance in log10 of reads per kilobase of read per million (RPKM) of ARGs for paired samples of individuals from China (stool and dental plaque: n = 30, stool and saliva: n = 31), Fiji (saliva and stool: n = 132), the USA (stool and dental plaque: n = 68, stool and dorsum of tongue: n = 69, stool and buccal mucosa: n = 64) and Western Europe (saliva and stool: n = 21). Centre line is median, box limits are upper and lower quartiles, whiskers are 1.5× interquartile ranges and points beyond whiskers are outliers. b Relative abundance of reads labelled by the top ten most abundant ARG classes across all geographical locations or other classes for each body site of individuals from China (dental plaque: n = 32, saliva: n = 33, stool: n = 72), Fiji (saliva: n = 136, stool: n = 137), the USA (buccal mucosa: n = 87, dental plaque: n = 90, dorsum of tongue: n = 91, stool: n = 70) and Western Europe (saliva: n = 21, stool: n = 21). c Estimated average log2 fold change of ARGs between paired dental plaque and stool, and saliva and stool samples using random effects meta-analysis across study cohorts (p-value < 0.05). Error bars are 95% confidence intervals from meta-analysis. ARGs selected for meta-analysis where adjusted p-value < 0.05 from differential abundance analysis between paired samples of individuals from China (stool and dental plaque: n = 30, stool and saliva: n = 31), Fiji (saliva and stool: n = 132), the USA (stool and dental plaque: n = 68) and Western Europe (saliva and stool: n = 21). Source data are provided in the Source Data file.
Fig. 4
Fig. 4. Comparing ARG richness between paired body sites.
ARG richness is defined as the number of unique ARGs for paired samples of individual from China (dental plaque and saliva: n = 31, stool and dental plaque: n = 30, stool and saliva: n = 31), Fiji (saliva and stool: n = 132), the USA (buccal mucosa and dental plaque: n = 78, buccal mucosa and dorsum of tongue: n = 86, dental plaque and dorsum of tongue: n = 89, stool and buccal mucosa: n = 64, stool and dental plaque: n = 68, stool and dorsum of tongue: n = 69) and Western Europe (saliva and stool: n = 21) with Mann–Whitney, paired, two-sided t test (p-value < 0.05 as *< 0.01 as **< 0.005 as ***). Centre line is median, box limits are upper and lower quartiles, whiskers are 1.5× interquartile ranges and points beyond whiskers are outliers. Source data are provided in the Source Data file.
Fig. 5
Fig. 5. Spearman’s correlation of ARG and species abundance from saliva samples.
Each heatmap represents correlations of individuals from a China (n = 31) and b Philippines (n = 23). Rows and columns are clustered by hierarchical clustering of Euclidean distance. Columns are coloured by phylum. P-values are adjusted by Benjamini–Hochberg multiple test correction. Rho shown only where adjusted p-value < 0.05. Source data are provided in the Source Data file.

Similar articles

Cited by

References

    1. World Health Organisation. Antimicrobial Resistance: Global Report on Surveillance. (WHO Press, World Health Organisation, Geneva, 2014). https://eur03.safelinks.protection.outlook.com.
    1. Rose G, et al. Antibiotic resistance potential of the healthy preterm infant gut microbiome. PeerJ. 2017;5:e2928. doi: 10.7717/peerj.2928. - DOI - PMC - PubMed
    1. Feng Jie, Li Bing, Jiang Xiaotao, Yang Ying, Wells George F., Zhang Tong, Li Xiaoyan. Antibiotic resistome in a large-scale healthy human gut microbiota deciphered by metagenomic and network analyses. Environmental Microbiology. 2017;20(1):355–368. doi: 10.1111/1462-2920.14009. - DOI - PubMed
    1. Forslund K, et al. Country-specific antibiotic use practices impact the human gut resistome. Genome Res. 2013;23:1163–1169. doi: 10.1101/gr.155465.113. - DOI - PMC - PubMed
    1. Rahman SF, Olm MR, Morowitz MJ, Banfield JF. Machine learning leveraging genomes from metagenomes identifies influential antibiotic resistance genes in the infant gut microbiome. mSystems. 2018;3:e00123–17. doi: 10.1128/mSystems.00123-17. - DOI - PMC - PubMed

Publication types