. 2020 Feb 4;11(1):696.
doi: 10.1038/s41467-020-14334-9.

Tracking regional brain growth up to age 13 in children born term and very preterm

Affiliations

Tracking regional brain growth up to age 13 in children born term and very preterm

Deanne K Thompson et al. Nat Commun. .

Abstract

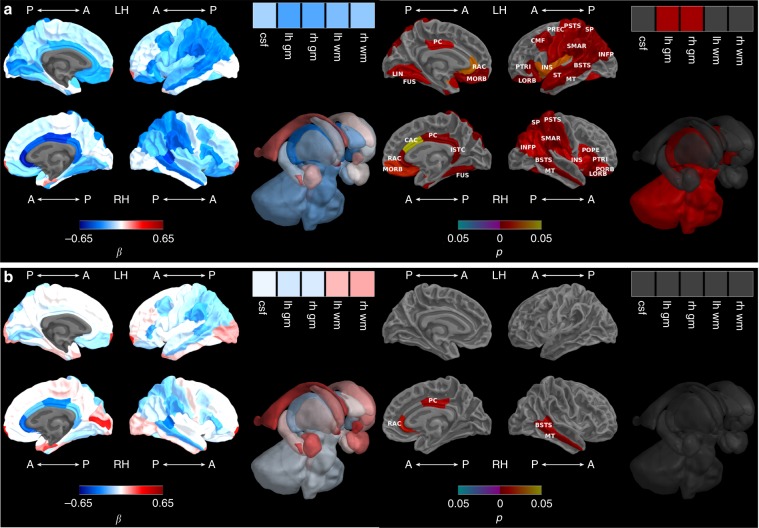
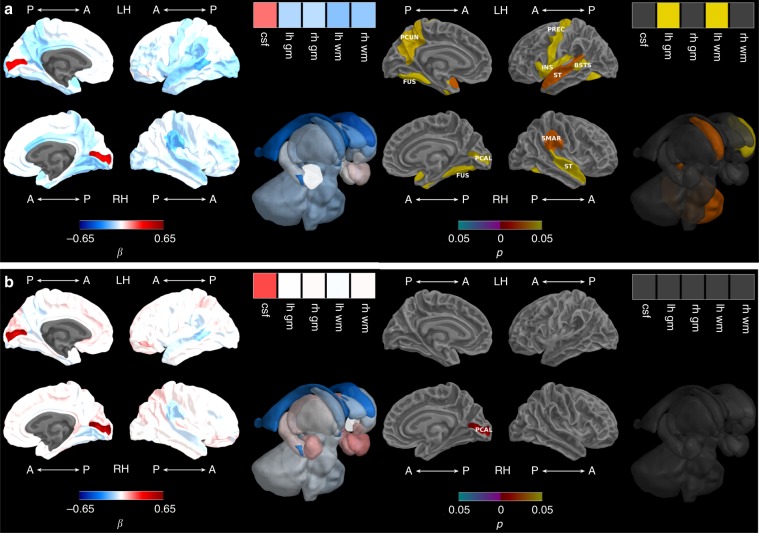
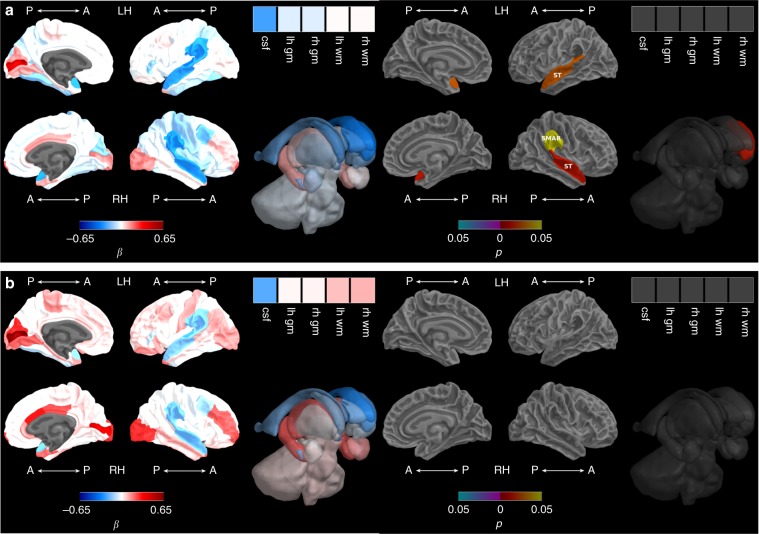
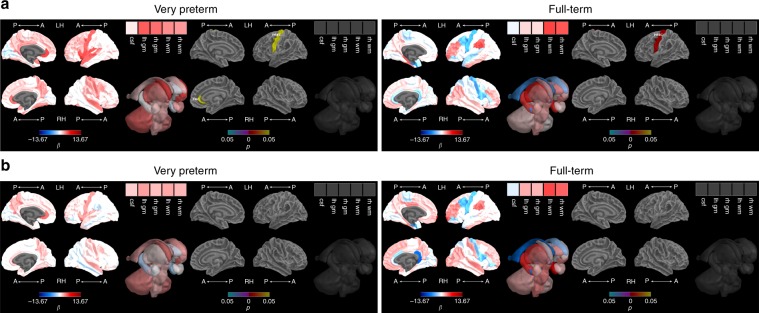
Serial regional brain growth from the newborn period to adolescence has not been described. Here, we measured regional brain growth in 216 very preterm (VP) and 45 full-term (FT) children. Brain MRI was performed at term-equivalent age, 7 and 13 years in 82 regions. Brain volumes increased between term-equivalent and 7 years, with faster growth in the FT than VP group. Perinatal brain abnormality was associated with less increase in brain volume between term-equivalent and 7 years in the VP group. Between 7 and 13 years, volumes were relatively stable, with some subcortical and cortical regions increasing while others reduced. Notably, VP infants continued to lag, with overall brain size generally less than that of FT peers at 13 years. Parieto-frontal growth, mainly between 7 and 13 years in FT children, was associated with higher intelligence at 13 years. This study improves understanding of typical and atypical regional brain growth.


Conflict of interest statement

The authors declare no competing interests.

Figures

Fig. 1
Fig. 1. Very preterm versus full-term brain growth from term-equivalent to 7 years.
a Before and b after adjusting for total brain tissue volume. Note: Group-by-time regression coefficients from linear mixed effects models (β) in blue refer to negative associations (slower growth in the very preterm compared with the full-term group) and in red refer to positive associations (faster growth in the very preterm compared with the full-term group), with darker coloured regression coefficients indicating stronger associations; Interaction p values are false discovery rate corrected and darker coloured p values indicate stronger significance; Boxes in the top right corner of the figures represent global brain volumes. A = anterior, P = posterior, LH = left hemisphere, RH = right hemisphere, csf = cerebrospinal fluid, gm = grey matter, wm = white matter, BSTS = banks of superior temporal sulcus, CAC = caudal anterior cingulate, CMF = caudal middle frontal, FUS = fusiform, INFP = inferior parietal, INS = insula, ISTC = isthmus cingulate, LORB = lateral orbitofrontal, LIN = lingual, MORB = medial orbitofrontal, MT = middle temporal, POPE = pars opercularis, PORB = pars orbitalis, PTRI = pars triangularis, PSTS = postcentral, PC = posterior cingulate, PREC = precentral, RAC = rostral anterior cingulate, SP = superior parietal, ST = superior temporal, SMAR = supramarginal.
Fig. 2
Fig. 2. Brain abnormality and brain growth from term-equivalent to 7 years.
a Before and b after adjusting for total brain volume. Note: Brain abnormality-by-time regression coefficients from linear mixed effects models (β) in blue refer to negative associations (slower growth in children with brain abnormality compared with children with no or mild brain abnormality) and in red refer to positive associations (faster growth in children with brain abnormality compared with children with no or mild brain abnormality), with darker coloured regression coefficients indicating stronger associations; Interaction p values are false discovery rate corrected and darker coloured p values indicate stronger significance; Boxes in the top right corner of the figures represent global brain volumes. A = anterior, P = posterior, LH = left hemisphere, RH = right hemisphere, csf = cerebrospinal fluid, gm = grey matter, wm = white matter, BSTS = banks of superior temporal sulcus, FUS = fusiform, INS = insula, PCAL = pericalcarine, PCUN = precuneus, PREC = precentral, ST = superior temporal, SMAR = supramarginal.
Fig. 3
Fig. 3. Growth restriction and brain growth from term-equivalent to 7 years.
a Before and b after adjusting for total brain volume. Note: Small for gestational age-by-time regression coefficients from linear mixed effects models (β) in blue refer to negative associations (slower growth in children born small compared with appropriate for gestational age) and in red refer to positive associations (faster growth in children born small compared with appropriate for gestational age), with darker coloured regression coefficients indicating stronger associations; Interaction p values are false discovery rate corrected and darker coloured p values indicate stronger significance; Boxes in the top right corner of the figures represent global brain volumes. A = anterior, P = posterior, LH = left hemisphere, RH = right hemisphere, csf = cerebrospinal fluid, gm = grey matter, wm = white matter, ST = superior temporal, SMAR = supramarginal.
Fig. 4
Fig. 4. Intelligence and brain growth from term-equivalent to 7 years.
a Adjusting for sex and age at IQ assessment and b additionally adjusting for total brain volume growth and social risk. Note: IQ-by-time regression coefficients from linear regression models (β) in blue refer to negative associations (slower growth associated with higher IQ scores) and in red refer to positive associations (faster growth associated with higher IQ scores), with darker coloured regression coefficients indicating stronger associations; p values are false discovery rate corrected and darker coloured p values indicate stronger significance; Boxes in the top right corner of the figures represent global brain volumes. A = anterior, P = posterior, LH = left hemisphere, RH = right hemisphere, csf = cerebrospinal fluid, gm = grey matter, wm = white matter, PREC = precentral, RAC = rostral anterior cingulate.
Fig. 5
Fig. 5. Intelligence and brain growth from 7 to 13 years.
a Adjusting for sex and age at IQ assessment and b additionally adjusting for total brain volume growth and social risk. Note: IQ-by-time regression coefficients from linear regression models (β) in blue refer to negative associations (slower growth associated with higher IQ scores) and in red refer to positive associations (faster growth associated with higher IQ scores), with darker coloured regression coefficients indicating stronger significance; p values are false discovery rate corrected and darker coloured p values indicate stronger associations; Boxes in the top right corner of the figures represent global brain volumes. A = anterior, P = posterior, LH = left hemisphere, RH = right hemisphere, csf = cerebrospinal fluid, gm = grey matter, wm = white matter, CMF = caudal middle frontal, INFP = inferior parietal, INS = insula, ISTC = isthmus cingulate, MORB = medial orbitofrontal, POPE = pars opercularis, PTRI = pars triangularis, PSTS = postcentral, PREC = precentral, SF = superior frontal, SP = superior parietal, SMAR = supramarginal.

References

    1. Knickmeyer RC, et al. A structural MRI study of human brain development from birth to 2 years. J. Neurosci. 2008;28:12176–12182. doi: 10.1523/JNEUROSCI.3479-08.2008. - DOI - PMC - PubMed
    1. Giedd JN, Rapoport JL. Structural MRI of pediatric brain development: what have we learned and where are we going? Neuron. 2010;67:728–734. doi: 10.1016/j.neuron.2010.08.040. - DOI - PMC - PubMed
    1. Chi JG, Dooling EC, Gilles FH. Gyral development of the human brain. Ann. Neurol. 1977;1:86–93. doi: 10.1002/ana.410010109. - DOI - PubMed
    1. Lenroot RK, et al. Sexual dimorphism of brain developmental trajectories during childhood and adolescence. Neuroimage. 2007;36:1065–1073. doi: 10.1016/j.neuroimage.2007.03.053. - DOI - PMC - PubMed
    1. Huttenlocher PR, Dabholkar AS. Regional differences in synaptogenesis in human cerebral cortex. J. Comp. Neurol. 1997;387:167–178. doi: 10.1002/(SICI)1096-9861(19971020)387:2<167::AID-CNE1>3.0.CO;2-Z. - DOI - PubMed

Publication types