. 2020 Feb 4;11(1):698.
doi: 10.1038/s41467-020-14433-7.

Nitric oxide orchestrates metabolic rewiring in M1 macrophages by targeting aconitase 2 and pyruvate dehydrogenase

Affiliations

Nitric oxide orchestrates metabolic rewiring in M1 macrophages by targeting aconitase 2 and pyruvate dehydrogenase

Erika M Palmieri et al. Nat Commun. .

Abstract

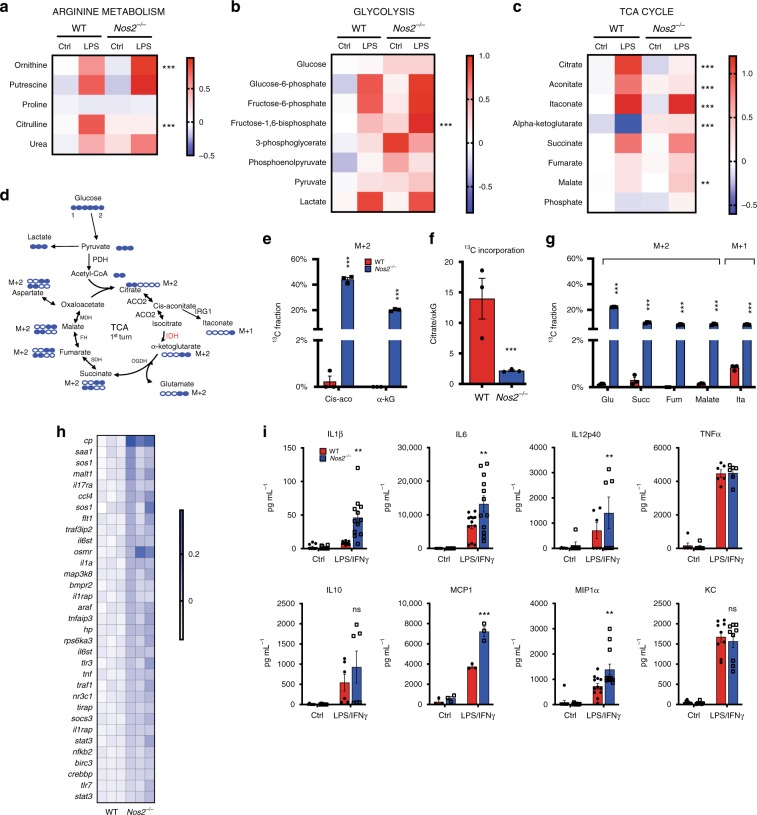
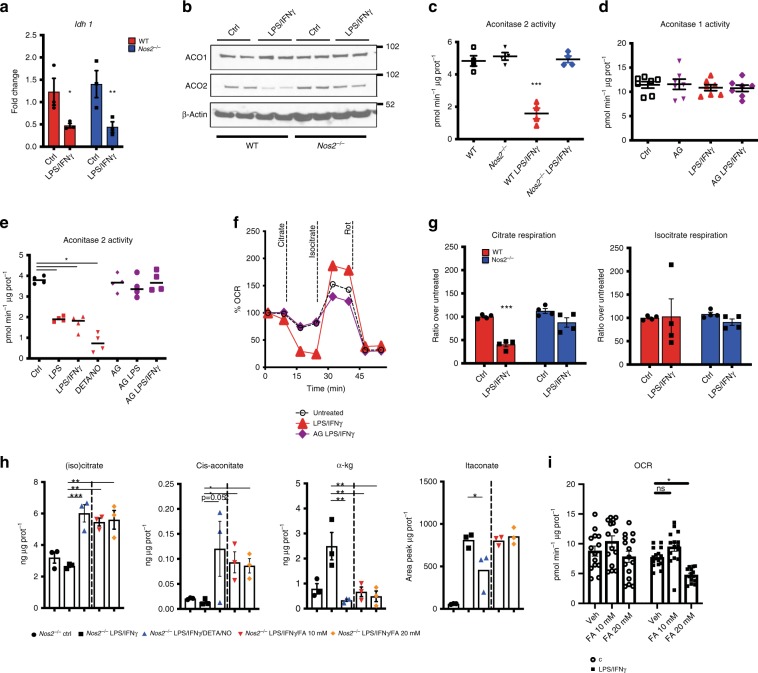
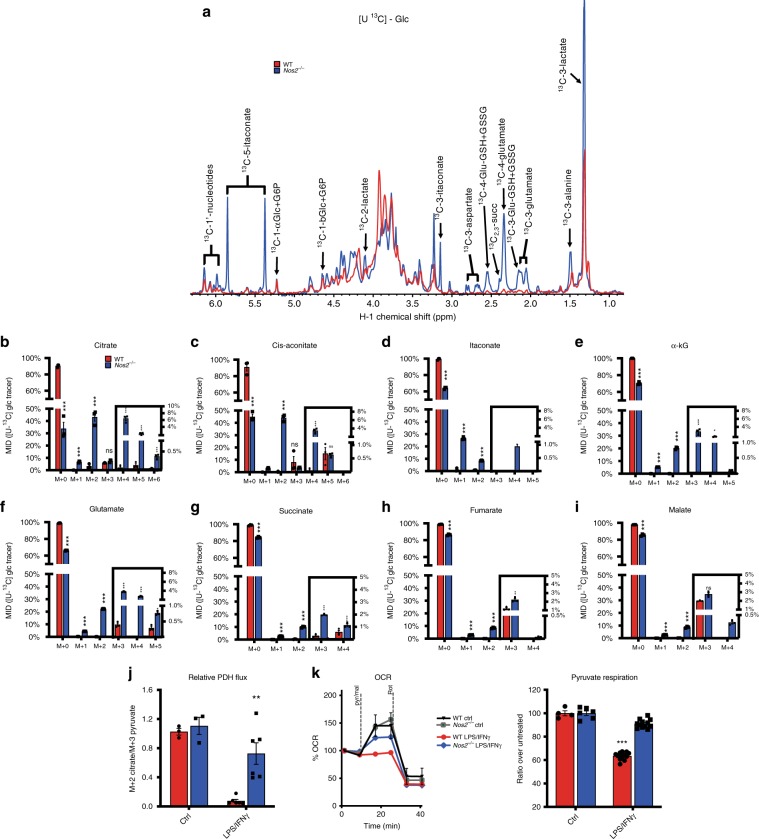
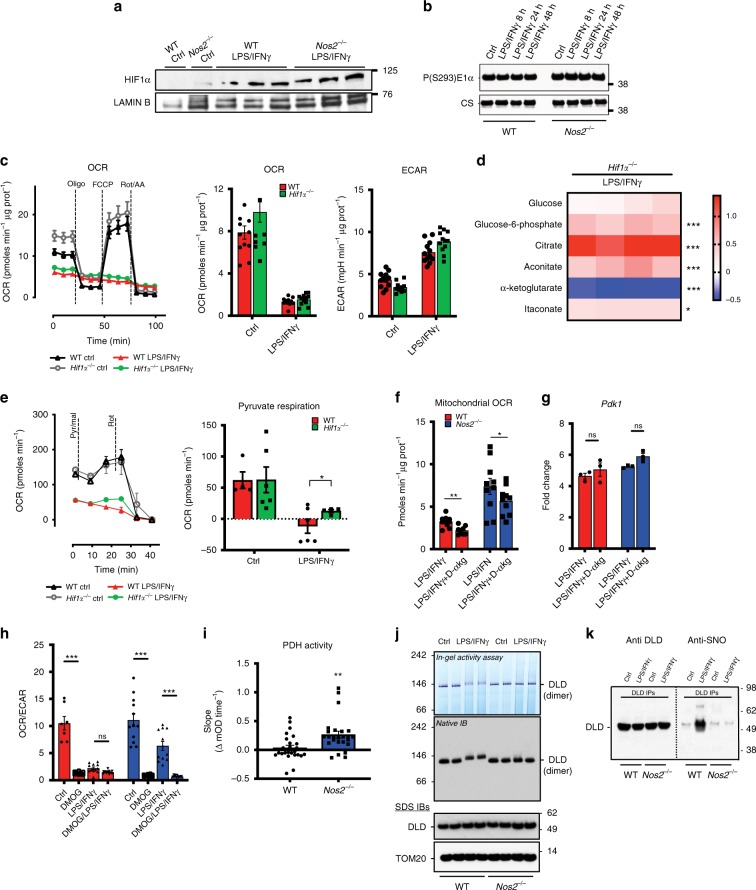
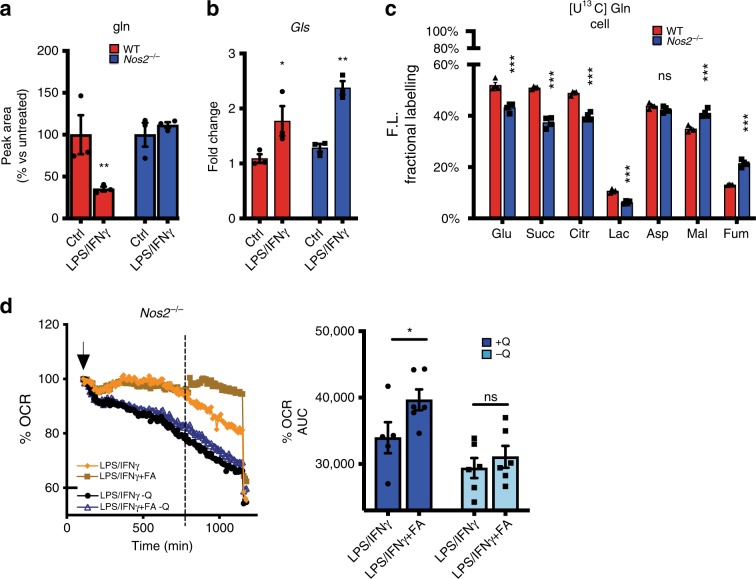
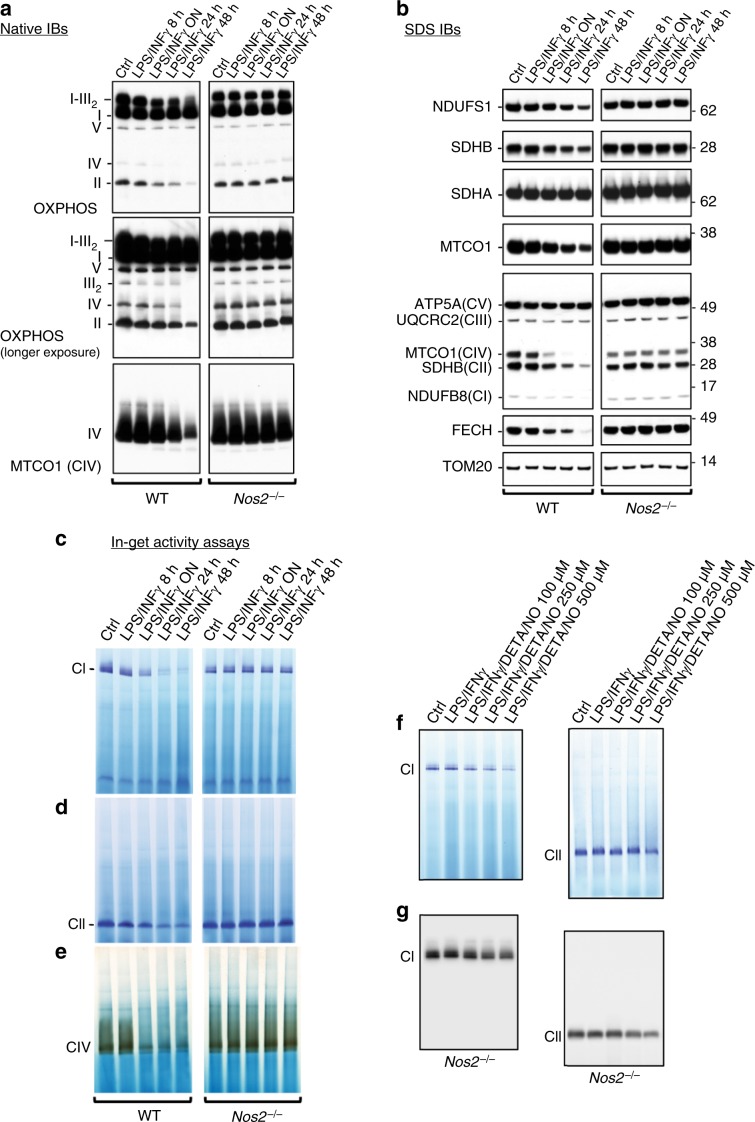
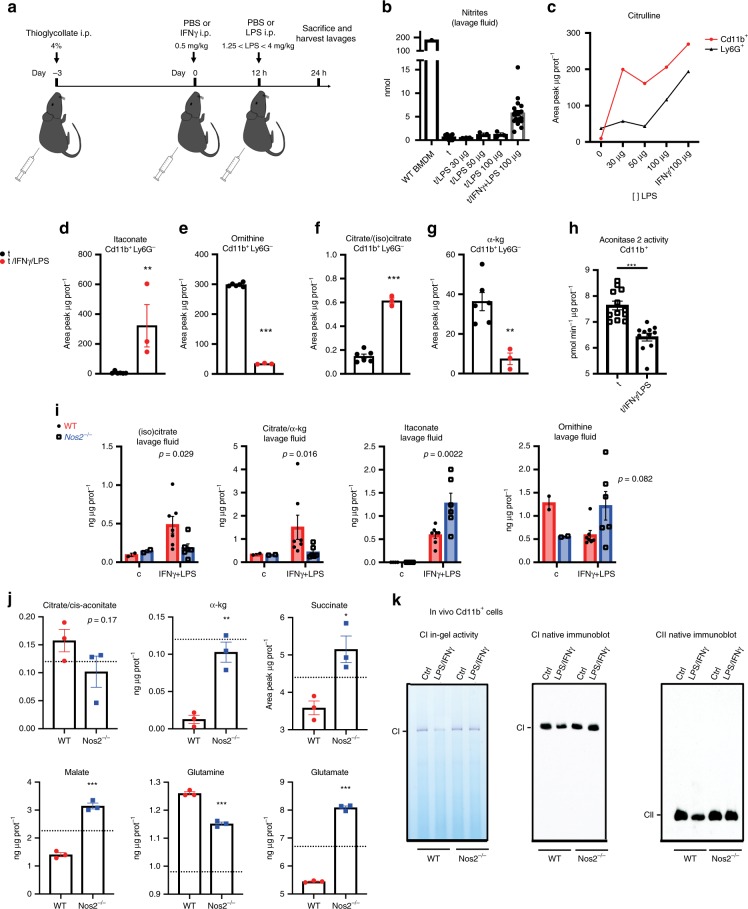
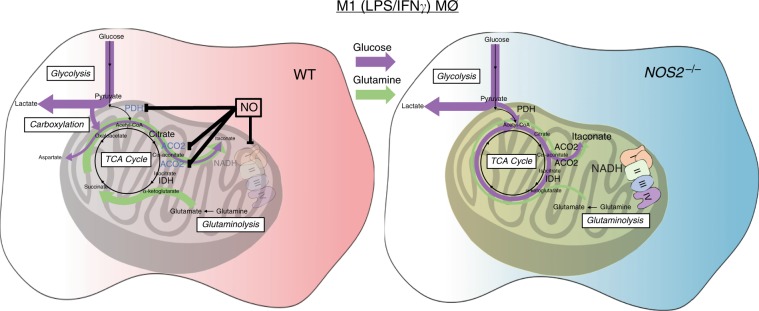
Profound metabolic changes are characteristic of macrophages during classical activation and have been implicated in this phenotype. Here we demonstrate that nitric oxide (NO) produced by murine macrophages is responsible for TCA cycle alterations and citrate accumulation associated with polarization. 13C tracing and mitochondrial respiration experiments map NO-mediated suppression of metabolism to mitochondrial aconitase (ACO2). Moreover, we find that inflammatory macrophages reroute pyruvate away from pyruvate dehydrogenase (PDH) in an NO-dependent and hypoxia-inducible factor 1α (Hif1α)-independent manner, thereby promoting glutamine-based anaplerosis. Ultimately, NO accumulation leads to suppression and loss of mitochondrial electron transport chain (ETC) complexes. Our data reveal that macrophages metabolic rewiring, in vitro and in vivo, is dependent on NO targeting specific pathways, resulting in reduced production of inflammatory mediators. Our findings require modification to current models of macrophage biology and demonstrate that reprogramming of metabolism should be considered a result rather than a mediator of inflammatory polarization.


Conflict of interest statement

The authors declare no competing interests.

Figures

Fig. 1
Fig. 1. Nos2−/− macrophages show intact metabolism and inflammatory machinery.
Heat-maps of the log10 ratio from the average peak areas from Gas Chromatography-Mass Spectrometry (GC-MS) analysis of metabolites associated with the arginine metabolism (a), glycolysis (b), and citric acid cycle (c) from bone marrow-derived macrophages (BMDMs) from wild-type (WT) and Nos2/ mice activated with LPS for 24 h compared to unstimulated (ctrl). d Schematic illustration of atom transitions in central metabolism using uniformly labeled 13C-glucose ([U-13C]) (labeled carbons are indicated in blue) as tracer for determination of mass isotopologue distributions (MID) to infer relative intracellular fluxes through oxidation of pyruvate. PDH pyruvate dehydrogenase, ACO2 aconitase 2, IDH isocitrate dehydrogenase, OGDH oxoglutarate dehydrogenase, SDH succinate dehydrogenase, FH fumarate hydratase, MDH malate dehydrogenase. eg WT and Nos2/ BMDMs were activated with LPS + IFNγ and cultured with labeled tracer. Bars show evaluation of the [U-13C] glucose-derived carbon incorporation (percentage) into m + 2 isotopologues of the indicated TCA intermediates. e Percentage of 13C in m + 2 isotopologues of cis-aconitate (cis-aco) and α-ketoglutarate (α-kG). f Bar graph depicting the ratio between citrate and α-kG for 13C fraction of the total metabolite level. g m + 2 isotopologues of glutamate (glu), succinate (succ), fumarate, malate and in m + 1 itaconate (ita) in activated WT and Nos2/ BMDMs. Data in ac (n = 5 biological replicates per group) and eg (n = 6) were analyzed by two-way ANOVA (interaction < 0.0001) (Sidak’s post-tests). h Expression profile of selected inflammatory genes from microarray analysis (see Table1) shown as heatmap of log2 fold changes of LPS + IFNγ-stimulated Nos2/ BMDMs compared to WT (n = 3). I The concentration of IL1β, IL6, IL12p40, TNFα, IL10, MCP1, MIP1α, and KC secreted into the culture media when BMDMs were stimulated for 24 h. Data are pooled from three experiments (n = 7–8) and were analyzed by two-way ANOVA with Sidak’s post-tests. All error bars display mean ± SEM. Source data are provided as a Source Data file.
Fig. 2
Fig. 2. The TCA Break is due to NO targeting of mitochondrial aconitase.
a WT and Nos2/ BMDMs were stimulated for 8 h and mRNA was extracted from total cell lysates and analyzed by qPCR for Idh1 (n = 6) (two-way ANOVA, Sidak’s post-tests; p-values = 0.033, 0.0093). b Whole-cell lysates of macrophages derived from two independent WT and Nos2/ mice were analyzed by western blot for cytosolic and mitochondrial aconitase (ACO 1-2). β-actin was used as loading control. c, d Aconitase 2 and total aconitase (aconitase 1) enzymatic activities in WT vs. Nos2/ BMDMs stimulated over night (O.N.). Where indicated cells were treated with NOS2 inhibitor Aminoguanidine (AG) 1 h prior to stimulation (n = 6). e Damaging effect of endogenously produced or exogenously provided NO (DETA/NO) on activity of aconitase 2 (n = 3). f Representative Seahorse analysis of oxygen consumption rates (OCR) in permeabilized WT and AG-pretreated BMDMs stimulated O.N. Citrate, tartronate, ADP and PMP were co-injected (first event marker). Isocitrate was injected at the second event marker and rotenone (rot) was injected lastly. g Quantifications (percentage relative to ctrl cells) of exogenous citrate and isocitrate-dependent state 3 OCR in WT vs. Nos2/ (n = 6). Data were analyzed by one-way (ce) or two-way ANOVA (f, g), (p < 0.0001) with Tukey’s post-tests. h Nos2/ BMDMs were stimulated with LPS + IFNγ in the presence of either DETA/NO (500 μM) or FA. Metabolites were quantified by ESI-LC/MS-MS and are reported as normalized total ng or peak area. Data (n = 6) were analyzed by one-way ANOVA with Dunnett’s post-tests. i Bar graphs showing quantified, protein normalized, basal OCR from stress tests of Nos2−/− macrophages treated with vehicle or FA 1 h prior to O.N. stimulation. Data (n = 3) were analyzed by two-way ANOVA with Sidak’s post-tests. All error bars display mean ± SEM. Source data are provided as a Source Data file.
Fig. 3
Fig. 3. Absence of NO promotes pyruvate oxidation via PDH.
a Polar extracts from WT and Nos2−/− BMDMs cultured with [U-13C] glucose were analyzed by 1D 1H{13C}_HSQC NMR. Spectral comparisons of stimulated cells are superimposed and show labeled TCA-derived metabolites in WT (red) vs. Nos2−/− (blue). Spectra are representative of two experiments (n = 6). bi MID from GC-MS analysis of citrate, cis-aconitate, itaconate, α-kG, glutamate, succinate, fumarate, and malate. m + 0 to m + 6 reveal the contribution of glucose-labeled metabolites when TCA cycle can run multiple turns. Data (n = 6) were analyzed by two-way ANOVA (interaction < 0.0001) (Sidak’s post-tests). j, k show flux through PDH. J Ratio of m + 2 citrate/m + 3 pyruvate indicating relative oxidation through PDH. Bar graphs represent pooled data (n = 6) and were analyzed by two-way ANOVA (interaction p = 0.0075) with Tukey’s post-tests. k Representative Seahorse analysis of permeabilized BMDMs where state 3-OCR was elicited by a mixture of pyruvate and malate to measure PDH flux. Bar graphs show quantified respiration in O.N. activated WT and Nos2/ BMDM (n = 9) as percentage of OCR relative to untreated. Data (n = 6) were analyzed by two-way ANOVA (interaction < 0.0001) (Sidak’s post-tests). All error bars display mean ± SEM. Source data are provided as a Source Data file.
Fig. 4
Fig. 4. Decreased carbon flux through PDH is Hif1α independent.
a Immunoblot (IB) for HIF1α protein of three independent nuclear extracts from WT and Nos2−/− BMDMs stimulated for 24 h. Lamin B was used as loading control (n = 6). b IB for PDH-Phospho-Ser293 in mitochondrial extracts; citrate synthase (CS) was used as loading control (n = 6). c O.N.-treated WT and Hif1α−/− BMDMs were seeded in Seahorse XF96 cell culture plates and sequential treated with oligomycin (Oligo), FCCP, and rotenone plus antimycin A (Rot/AA). Basal OCR and extracellular acidification rate (ECAR) are quantified (n = 3). Data were not significant by two-way ANOVA with Sidak’s post-tests (p-values = 0.59, 0.1675). d Heat-maps from GC-MS analysis of metabolites of glycolysis and TCA cycle from Hif1α/ BMDMs. Data show log10 ratio from the average peak areas of stimulated cells compared to unstimulated. Data (n = 4) were analyzed by two-way ANOVA (interaction < 0.0001) (Sidak’s post-tests). e Representative Seahorse analysis of pyruvate/malate respiration in WT and Hif1α/ BMDMs. Bar graphs show quantified OCR (n = 3) (two-way ANOVA, interaction p = 0.036, Sidak’s post-tests). f Protein normalized basal OCR from stress tests of WT and Nos2−/− macrophages treated with Dimethyl α-KG (D-αkG) 1 h prior to O.N. stimulation. Data were analyzed by Student’s t-test (n = 3). g BMDMs as in f and stimulated for 8 h. mRNA from total cell lysates was analyzed by qPCR for Pdk1. Data (n = 6) were not significant by two-way ANOVA (interaction p = 0.74) (Sidak’s post-tests). h Basal OCR/ECAR in WT and Nos2−/− BMDMs stimulated O.N. and pretreated with DMOG. Data (n = 3) were analyzed by two-way ANOVA (interaction < 0.0001) (Sidak’s post-tests). i Enzymatic activity of PDH in total cell lysates from WT and Nos2/ BMDMs after O.N. activation. Data (n = 6) were analyzed by unpaired t-test with Welch’s correction (p = 0.0038). j PDH-E3 (DLD) in-gel activity assay and IB on native gels of mitochondrial fractions from macrophages from two independent WT and Nos2/ mice. k Mitochondrial fractions from control and LPS + IFNγ stimulated WT and Nos2/ BMDMs were used as inputs to immunoprecipitate DLD. Anti DLD and Anti-CysSNO IBs were performed. All error bars display mean ± SEM. Source data are provided as a Source Data file.
Fig. 5
Fig. 5. LPS/IFNγ increase glutamine utilization in NO-dependent manner.
a Extracellular glutamine levels were quantified by GC-MS in O.N. stimulated WT vs. Nos2/. Data (n = 9) were normalized to the absolute peak area of the metabolite in WT control and were analyzed by two-way ANOVA (interaction p = 0.0037) (Sidak’s post-tests). b RNA as in 2a were analyzed for Gls expression (two-way ANOVA with Sidak’s post-tests, p-values = 0.0114, 0.0024). c Fractional contribution of 13C-labeling from [U-13C] Glutamine in metabolites of the TCA in activated WT vs. Nos2/ BMDMs Data (n = 4) were analyzed by two-way ANOVA (interaction < 0.0001) (Sidak’s post-tests). d OCR in Nos2/ BMDMs after addition of LPS + IFNγ (at the arrow indicated) in the presence or absence of glutamine (Q). Bar graphs showing quantification of OCR after addition of FA compared to vehicle (dotted line). Data (n = 3) were analyzed by two-way ANOVA (interaction p = 0.0192) (Sidak’s post-tests). All error bars display mean ± SEM. Source data are provided as a Source Data file.
Fig. 6
Fig. 6. NO inhibits mitochondrial ETC complexes and promotes their loss.
a Native IBs were performed to assess assembly of complexes I–V (CI–V) in BMDMs after activation with LPS + IFNγ for indicated times. Total OXPHOS IB was performed to detect the CI subunit NDUFB8, the CII subunit SDHB, the CIII-Core protein 2 (UQCRC2), the CIV subunit I (MTCO1, also detected by IB with specific antibody) and the CV alpha subunit (ATP5A). b SDS IBs including the CI subunit NDUFS1, the CII subunit SDHA, and the Fe-S protein ferrochelatase (FECH). Levels of TOM20 were used as mitochondrial matrix marker for loading controls. IBs were performed on samples described in a. (ad, n = 4 biological replicates). c CI, d CII, and e CIV in-gel activity assays were performed in activated WT and Nos2/ cells at reported time points. f CI and CII in-gel activities in Nos2/ BMDMs stimulated with LPS + IFNγ in the presence of increasing concentration of DETA/NO (100, 250 and 500 μM) (g) SDS IBs for CI (NDUFS1) and CII (SDHA) performed on samples described in f.
Fig. 7
Fig. 7. NO directs metabolic reprogramming in vivo.
a Mice were injected i.p. with thioglycolate and challenged after 3 days with injections of IFNγ or PBS i.p. 12 h later, mice were administered LPS i.p. and euthanized in the subsequent 12 h. Peritoneal lavage fluid was harvested and cells isolated: both processed for metabolic studies. b Nitrite levels were quantified by Griess reaction performed on concentrated lavage fluid in comparison with 2 × 106 LPS/IFNγ stimulated BMDM-derived culture media. Results are shown as total nmol. (n > 3 for each group). c Mice were challenged as in a and either Ly6G + or Cd11B + cells were isolated from peritoneal lavage and subjected to metabolite extraction and subsequent ESI-LC/MS-MS analysis. Normalized peak area of citrulline is shown. dg Quantified metabolites in Cd11b + Ly6G- isolated from WT mice challenged for Shwartzman reaction (n = 6) (“t” represents mice injected with thioglycolate alone). h Aconitase 2 activity in total CD11b+ cells from mice undergoing Shwartzman reaction (n = 3). Data were analyzed by Student’s t-test. i WT and Nos2−/− mice were challenged as in a and peritoneal lavage was concentrated, extracted and analyzed by ESI-LC/MS-MS analysis. Absolute amounts as ng/total μg protein in lavage fluid are shown. Data were analyzed by two-way ANOVA with Sidak’s post-tests (n = 8). Shown p-values indicate WT vs. Nos2−/− comparisons in IFNγ + LPS condition. j Quantified metabolites in Cd11b+Ly6G isolated from challenged WT and Nos2−/− mice. The dotted line represents the average level of metabolite in thioglycolate alone-group. Data were analyzed by Student’s t-test (n = 3). k CI in gel activity and SDS IBs for CI (NDUFS1) and CII (SDHA) in total CD11b+ cells from challenged WT vs. Nos2/ mice (n = 2). Source data are provided as a Source Data file.
Fig. 8
Fig. 8. NO orchestrates metabolic reprogramming in M1 macrophages.
Macrophage activation in the presence of Nitric Oxide (NO) results in multiple metabolic rewirings. Aconitase 2 is inhibited and entrance of carbon into TCA cycle via pyruvate dehydrogenase is halted. In turn, compensatory carboxylation and glutaminolysis are enhanced, leading to citrate accumulation and limited itaconate. Because of the breaks, the lack of NADH and reduced substrates leads to inactive mitochondrial complexes. In Nos2/ BMDMs glycolytic flux is maintained and carbon passage through PDH and ACO2 is intact. In this scenario, production of itaconate is increased and mitochondrial complexes display full functional activity. The arrows represent the general direction of the metabolic flow in the system with the specific contribution of glucose (purple) and glutamine (green). PDH pyruvate dehydrogenase, ACO2 mitochondrial aconitase, IDH isocitrate dehydrogenase, LPS lipopolysaccharide, IFNγ interferon γ.

Similar articles

Cited by

References

    1. Ip WKE, Hoshi N, Shouval DS, Snapper S, Medzhitov R. Anti-inflammatory effect of IL-10 mediated by metabolic reprogramming of macrophages. Science (N. Y., N. Y.) 2017;356:513–519. doi: 10.1126/science.aal3535. - DOI - PMC - PubMed
    1. O’Neill LA, Pearce EJ. Immunometabolism governs dendritic cell and macrophage function. J. Exp. Med. 2016;213:15–23. doi: 10.1084/jem.20151570. - DOI - PMC - PubMed
    1. Baseler WA, et al. Autocrine IL-10 functions as a rheostat for M1 macrophage glycolytic commitment by tuning nitric oxide production. Redox Biol. 2016;10:12–23. doi: 10.1016/j.redox.2016.09.005. - DOI - PMC - PubMed
    1. Tannahill GM, et al. Succinate is an inflammatory signal that induces IL-1β through HIF-1α. Nature. 2013;496:238–242. doi: 10.1038/nature11986. - DOI - PMC - PubMed
    1. Freemerman AJ, et al. Myeloid Slc2a1-deficient murine model revealed macrophage activation and metabolic phenotype are fueled by GLUT1. J. Immunol. 2019;202:1265–1286. doi: 10.4049/jimmunol.1800002. - DOI - PMC - PubMed

Publication types

MeSH terms