

Nexus of grazing management with plant and soil properties in northern China grasslands
- PMID: 32019931
- PMCID: PMC7000820
- DOI: 10.1038/s41597-020-0375-0
Nexus of grazing management with plant and soil properties in northern China grasslands
Abstract
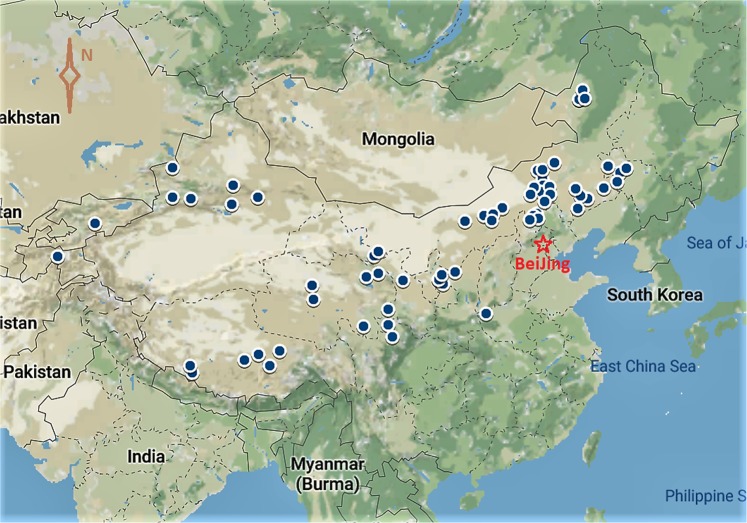
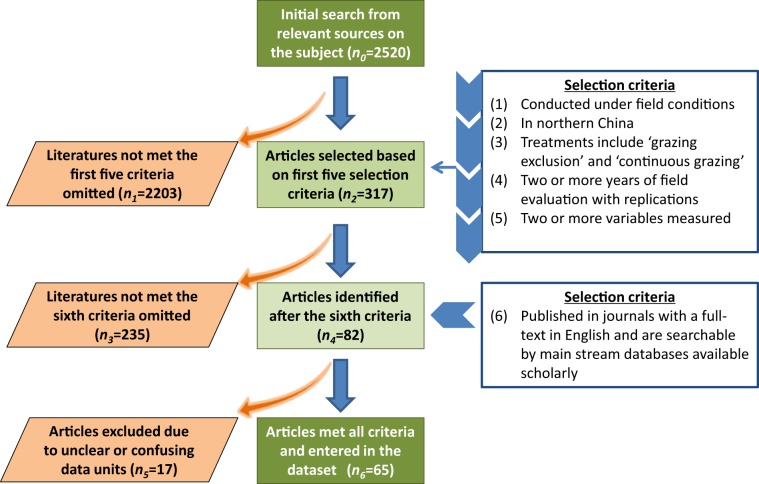
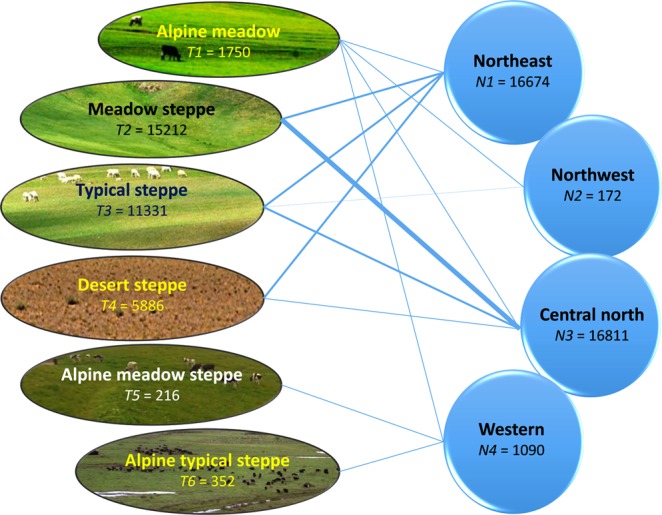
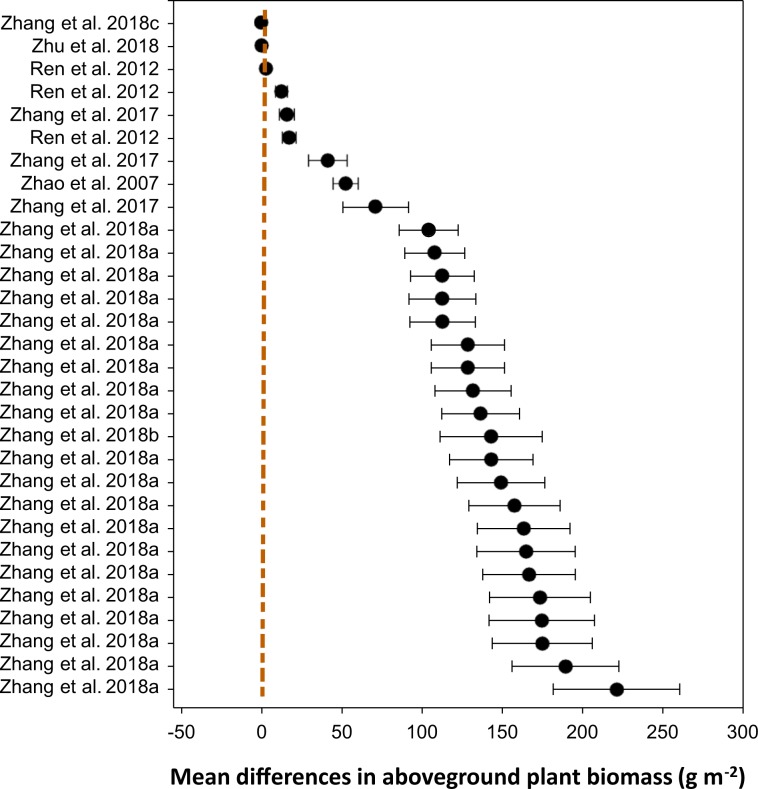
Grasslands provide habitats for living organisms and livelihoods for ~800 million people globally. Many grasslands in developing countries are severely degraded. Some measures have been taken to curb the trend of degradation for decades. It is important to determine how decade-long rejuvenation efforts affected grassland ecosystems. We identified 65 data-rich studies based on six criteria, from >2500 relevant publications, and generated a dataset with 997 rows and 12 variables. The dataset covers different grazing intensities (grazing exclusion, light, moderate, and heavy grazing) and their impacts on plant traits (vegetation coverage, aboveground and root biomass, and plant diversity) and soil physiochemical properties (bulk density, moisture content, organic C, total and available N, total and available P, C:N ratio, and pH). The dataset could be used to (i) quantify the effectiveness of rejuvenation processes by determining the impact on plant community and soil properties, (ii) perform comprehensive analyses to elucidate large-picture effects of grazing management and rejuvenation, and (iii) analyze the impact of grass-climate-soil-human interactions on grassland ecosystem sustainability.
Conflict of interest statement
The authors declare no competing interests.
Figures


Similar articles
-
Grazing exclusion is more effective for vegetation restoration and nutrient transfer in the heavily degraded desert steppe.BMC Plant Biol. 2024 May 17;24(1):408. doi: 10.1186/s12870-024-05127-z. BMC Plant Biol. 2024. PMID: 38755583 Free PMC article.
-
Long-term grazing effects on vegetation characteristics and soil properties in a semiarid grassland, northern China.Environ Monit Assess. 2017 May;189(5):216. doi: 10.1007/s10661-017-5947-x. Epub 2017 Apr 14. Environ Monit Assess. 2017. PMID: 28411318
-
Changes in arthropod family richness, activity-density, biomass and body-size differed along a grazing intensity gradient: Modulation of plant traits and soil moisture conditions.J Environ Manage. 2025 Feb;374:124133. doi: 10.1016/j.jenvman.2025.124133. Epub 2025 Jan 17. J Environ Manage. 2025. PMID: 39826363
-
A synthesis of the effect of grazing exclusion on carbon dynamics in grasslands in China.Glob Chang Biol. 2016 Apr;22(4):1385-93. doi: 10.1111/gcb.13133. Epub 2016 Jan 6. Glob Chang Biol. 2016. PMID: 26485056 Review.
-
Resilience and restoration of tropical and subtropical grasslands, savannas, and grassy woodlands.Biol Rev Camb Philos Soc. 2019 Apr;94(2):590-609. doi: 10.1111/brv.12470. Epub 2018 Sep 24. Biol Rev Camb Philos Soc. 2019. PMID: 30251329 Review.
Cited by
-
Non-utilization Is Not the Best Way to Manage Lowland Meadows in Hulun Buir.Front Plant Sci. 2021 Jul 16;12:704511. doi: 10.3389/fpls.2021.704511. eCollection 2021. Front Plant Sci. 2021. PMID: 34335668 Free PMC article.
References
-
- Soussana JF, Lüscher A. Temperate grasslands and global atmospheric change: A review. Grass Forage Sci. 2007;62:127–134. doi: 10.1111/j.1365-2494.2007.00577.x. - DOI
-
- Galli A, et al. Integrating ecological, carbon and water footprint into a “footprint family” of indicators: definition and role in tracking human pressure on the planet. Ecol. Indic. 2012;16:100–112. doi: 10.1016/j.ecolind.2011.06.017. - DOI
-
- Odriozola I, García-Baquero G, Laskurain NA, Aldezabal A. Livestock grazing modifies the effect of environmental factors on soil temperature and water content in a temperate grassland. Geoderma. 2014;235–236:347–354. doi: 10.1016/j.geoderma.2014.08.002. - DOI
-
- Statistics Division of Food and Agriculture Organization of the United Nations (FAOSTAT). FAO Statistical Yearbooks - World food and agriculture. Food and Agriculture Organization of the (United Nations, 2015).
-
- National Bureau of Statistics of Central Government of China. China Statistical Yearbook 2018. (China Academic Journals Electronic Publishing House, 2018).
Publication types
MeSH terms
Substances
Grants and funding
LinkOut - more resources
Full Text Sources
