. 2020 Feb 4;11(1):684.
doi: 10.1038/s41467-020-14508-5.

TbD1 deletion as a driver of the evolutionary success of modern epidemic Mycobacterium tuberculosis lineages

Affiliations

TbD1 deletion as a driver of the evolutionary success of modern epidemic Mycobacterium tuberculosis lineages

Daria Bottai et al. Nat Commun. .

Abstract

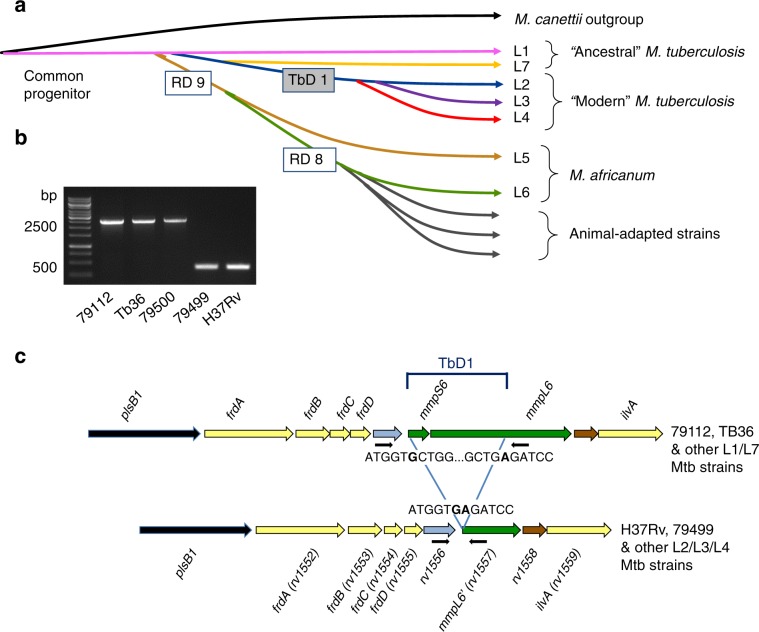
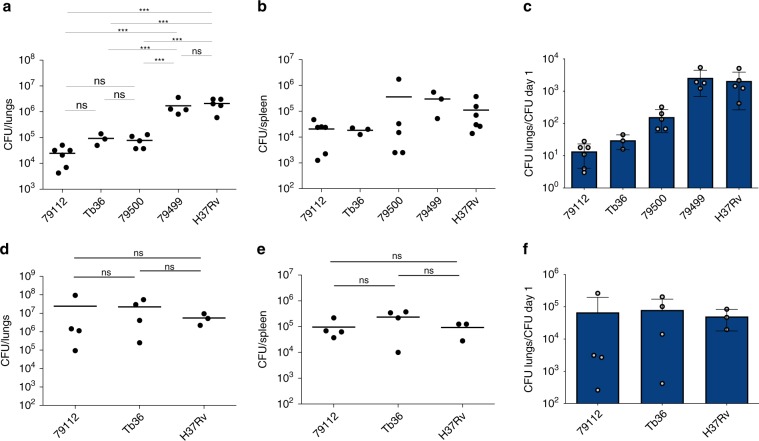
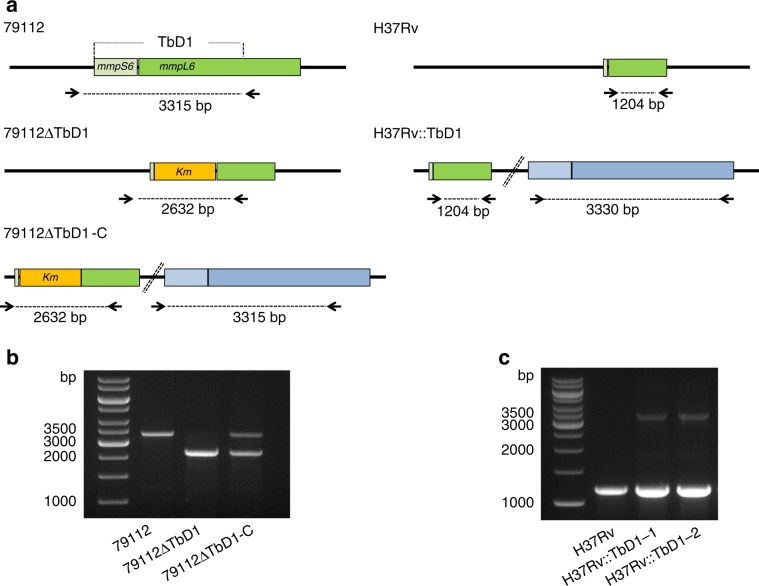
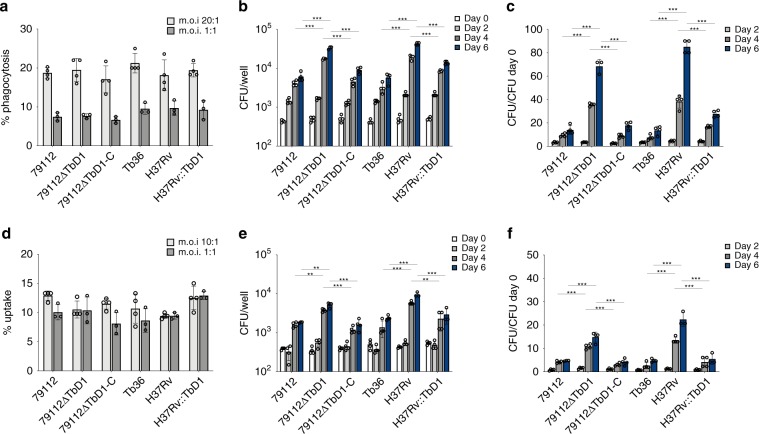
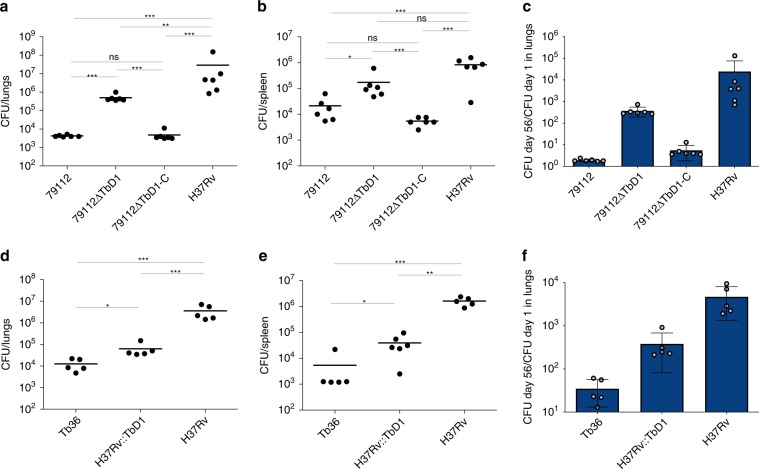
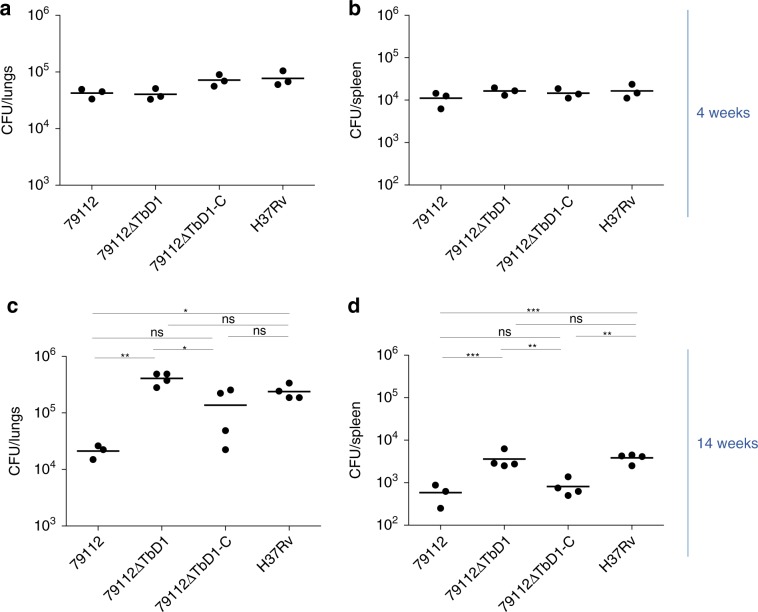
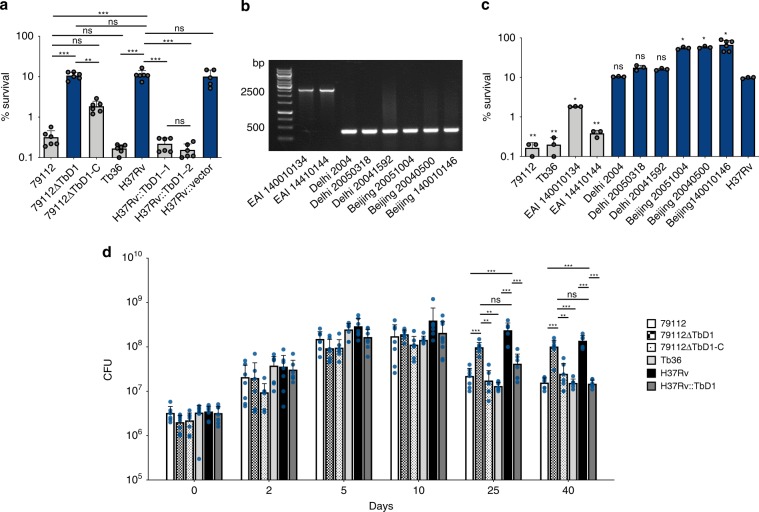
Mycobacterium tuberculosis (Mtb) strains are classified into different phylogenetic lineages (L), three of which (L2/L3/L4) emerged from a common progenitor after the loss of the MmpS6/MmpL6-encoding Mtb-specific deletion 1 region (TbD1). These TbD1-deleted "modern" lineages are responsible for globally-spread tuberculosis epidemics, whereas TbD1-intact "ancestral" lineages tend to be restricted to specific geographical areas, such as South India and South East Asia (L1) or East Africa (L7). By constructing and characterizing a panel of recombinant TbD1-knock-in and knock-out strains and comparison with clinical isolates, here we show that deletion of TbD1 confers to Mtb a significant increase in resistance to oxidative stress and hypoxia, which correlates with enhanced virulence in selected cellular, guinea pig and C3HeB/FeJ mouse infection models, the latter two mirroring in part the development of hypoxic granulomas in human disease progression. Our results suggest that loss of TbD1 at the origin of the L2/L3/L4 Mtb lineages was a key driver for their global epidemic spread and outstanding evolutionary success.


Conflict of interest statement

The authors declare no competing interests.

Figures

Fig. 1
Fig. 1. The TbD1 locus in ancestral and modern Mtb strains.
a Evolutionary scheme of the Mycobacterium tuberculosis complex following reference, showing some key large sequence polymorphisms, including the deletion of the TbD1 region, which indicates the common evolutionary origin of the lineage L2, L3 and L4 strains. b Amplification profiles on genomic DNAs from the different “Indian” strains, demonstrating the presence of a 2459-bp fragment (corresponding to an intact TbD1 locus) in 79112, Tb36 and 79500 strains and a 349-bp fragment resulting from the TbD1-deletion, in 79499 and H37Rv strains. Primers specific for the TbD1-flanking regions used in PCR reactions are depicted as black arrows in panel c. c Schematic representation of gene organization at the TbD1 locus and flanking genes in ancestral and modern Mtb strains. The sequence of the junction regions of the TbD1 locus in 79112 and H37Rv strains, as determined by genome sequencing, is also depicted.
Fig. 2
Fig. 2. Virulence profiles of selected Indian Mtb WT strains in different in vivo models.
ac In vivo growth profiles of TbD1-intact and ΔTbD1 Mtb strains in the guinea pig infection model. Guinea pigs were aerosol-challenged with different Indian strains or the laboratory reference strain H37Rv. Eight weeks after infection, the bacterial load in lungs (a) and spleen (b) was determined. Statistical differences in CFU values obtained in organs from animals infected with different Mtb strains were determined by the univariate analysis of variance test followed by Sidak post-hoc test (***P < 0.001; ns: not significant). c CFU ratio (CFU at day 56/CFU at day 1) obtained in lungs of animals infected with Mtb Indian strains and the H37Rv control strain. df. Virulence potential of ancestral Mtb strains (79112, Tb36) in the mouse model in comparison with H37Rv. Groups of four C57BL/6 mice were aerosol infected with different Mtb strains, to obtain an infection dose of 100–500 CFU/lungs. Four weeks after infection, the bacterial load in lungs (d) and spleen (e) of Mtb-infected animals was determined. Statistical significance of differences in CFU numbers was determined by one-way Anova test followed by Bonferroni post hoc test (ns: not significant). f CFU ratio (CFU at day 30/CFU at day 1) obtained in lungs of animals infected with TbD1-positive strains and the H37Rv control strain. The figure depicts single data points, mean, and standard deviation of CFU numbers or CFU ratio values obtained in representative guinea pig (ac) and mouse (df) infection experiments.
Fig. 3
Fig. 3. Deletion and integration of the TbD1 locus in the 79119 and H37Rv genetic backgrounds, respectively.
a Schematic representation of the genomic organization of the TbD1 locus in the 79112∆TbD1 mutant and complemented strain (79112∆TbD1-C). The schematic representation of the genomic organization of recombinant H37Rv strains, harboring an intact TbD1 locus is also depicted. Arrows indicate primers used in PCR reactions. b, c Amplification profiles obtained in PCR reactions performed on genomic DNAs from different Mtb strains by using primer pairs, specific for TbD1 flanking region. The 2632 bp-fragment obtained in 79112∆TbD1, or the 2632-bp and 3315-bp amplification products detected in 79112∆TbD1-C confirmed the TbD1 deletion and its replacement by a kanamycin resistance gene in the 79112∆TbD1 mutant, the correct TbD1 deletion/re-integration in the 79112∆TbD1-C complemented derivative strain, respectively (b). Similarly, the 1204-bp product obtained in H37Rv, or the 1204-bp and 3330-bp fragments observed in H37Rv::TbD1 clones correspond to the TbD1-deleted locus originally present in WT H37Rv and to the full-size TbD1 region (mmpS6/mmpL6) integrated into the genome, respectively (c).
Fig. 4
Fig. 4. Intracellular growth profiles of TbD1 WT and mutant strains in THP-1 and A549 human cell lines.
ac Comparative analysis of the percentage of phagocytosis (a) and growth (b, c) of TbD1-intact and ΔTbD1 WT and mutant strains in human THP-1 cells. df Comparative analysis of the percentage of uptake (d) and growth (ef) of TbD1-intact and ΔTbD1 WT and mutant strains in human A549 cells. For determination of the percentage of uptake, THP-1 cells were infected at m.o.i 20:1 and 1:1 (cells: bacteria), while A549 cells were infected at m.o.i 10:1 and 1:1 (cells: bacteria). The comparison of growth kinetics of different TbD1-intact and ΔTbD1 WT and complemented strains was undertaken at m.o.i 20:1 (cells:bacteria) for THP-1, and 10:1 (cells:bacteria) for A549. These m.o.i ensured the integrity of the infected cell monolayer over a 6-day period. In both these ex vivo models, the numbers of intracellular bacteria (CFU) were determined immediately after phagocytosis and at different time points (as indicated in panels b, e). CFU ratio values (CFU at different time points/CFU at day 0) are reported in c, f. The statistical significance of differences in CFU and CFU ratio values among the strains were determined by one-way Anova with Bonferroni post hoc test. Only the statistical significance of differences between the 79112∆TbD1 mutant and its corresponding control strains (79112 and 79112∆TbD1-C) or H37Rv and its derivative H37Rv::TbD1 and related control Tb36, at days 4 and 6 post infection are depicted in the figure (**P < 0.01; ***P < 0.001). The figure shows the single data points, mean and standard deviations of uptake percentage, CFU numbers and CFU ratio values obtained in a representative experiment performed in quadruplicate (or in triplicate for determination of uptake percentage at m.o.i 1:1).
Fig. 5
Fig. 5. Impact of TbD1 on Mtb virulence in guinea-pigs.
Guinea pigs were aerosol infected with a panel of TbD1-deleted or TbD1-complemented Mtb modified strains. Eight weeks after challenge, the bacterial load in target organs was determined. a, b CFU numbers obtained in lungs (a) and spleen (b) of guinea-pigs infected with 79112ΔTbD1 or 79112ΔTbD1-complemented strains. Animal control groups were infected with 79112 WT or H37Rv strains. c CFU ratio (CFU at day 56/CFU at day 1) obtained in lungs of animals infected with 79112-derivative strains and 79112 or H37Rv WT strains. d, e CFU numbers obtained in lungs (d) and spleens (e) of guinea-pigs infected with the H37Rv::TbD1 strain, obtained by complementation of strain H37Rv with the TbD1 locus from strain Tb36 via cosmid 2G12. As controls, guinea pigs were infected with Tb36 and H37Rv parental strains. f CFU ratios (CFU at day 56/CFU at day 1) obtained in lungs of animals infected with the H37Rv::TbD1 strain, complemented with the TbD1 region from Tb36 via cosmid 2G12. Statistical differences in CFU values obtained in organs form animals infected with different Mtb strains were determined by the univariate analysis of variance test followed by Sidak post-hoc test (*P < 0.05; **P < 0.01; ***P < 0.001; ns: not significant). The figure reports single data points, mean and standard deviation of CFU number or CFU ratio values obtained in representative experiments performed with 6 (ac) or 5 (ef) animals per group.
Fig. 6
Fig. 6. Growth kinetics of 79112 and isogenic ΔTbD1 and TbD1-complemented strains in C3HeB/FeJ mice.
C3HeB/FeJ mice were aerosol infected with the Mtb 79112∆TbD1 mutant and its corresponding TbD1-intact 79112 parental and 79112∆TbD1-C complemented strains (10–15 CFU/lungs). Mtb H37Rv was included as an additional control strain. Four (a, b) and 14 (c, d) weeks after infection, the bacterial loads in lungs (a, b) and spleens (c, d) were determined. Statistical differences in CFU values obtained in organs from mice infected with different Mtb strains were determined by one-way Anova with Bonferroni post hoc test (*P < 0.05; **P < 0.01; ns: not significant). The figure reports single data points, mean and standard deviation of CFU number or CFU ratio values obtained in a representative experiment performed with 3 (a, b) or 4 (c, d) mice per group.
Fig. 7
Fig. 7. Impact of TbD1 on Mtb sensitivity to oxidative stress and hypoxia.
a Survival percentages of WT 79112 and Tb36 ancestral TbD1-intact strains or modern Mtb H37Rv, in comparison with those of TbD1-deleted or TbD1-complemented derivative strains after 1-h exposure to 10 mM H2O2. An H37Rv strain complemented with the empty vector was included in the assay as an additional control. The susceptibility of each strain was expressed as percentage of survival relative to the time 0. The figure depicts single data points, mean and standard deviation of survival percentages obtained for each strain in six independent bacterial cultures. b, c Sensitivity profiles of a panel of Mtb clinical isolates belonging to different lineages, harboring or not an intact TbD1 locus. b Amplicons obtained by PCR analysis on genomic DNAs from different Mtb isolates, by using primers specific for the TbD1-flanking regions. c Survival percentages of clinical isolates after exposure to H2O2. Mtb 79112, Tb36 and H37Rv were also included as control strains. In a, c TbD1-intact strains are indicated by gray bars, while TbD1-deleted strains are indicated by blue bars. The graph represents single data points, mean and standard deviation of survival percentages obtained for each strain in a representative experiment performed in triplicate (6 bacterial replicates were testes for the Beijing 140010146 strain). d Growth and survival of Mtb TbD1-intact and TbD1-deleted strains in the Wayne dormancy culture system. All strains were grown in Dubos medium without glycerol, in sealed 30 ml tubes (liquid volume: air volume ratio of 2:1). After 2, 5, 10, 25, and 40 days of incubation at 37 °C the CFU numbers were determined. The panel shows the single data points, mean and standard deviation of CFU values recovered for each strain in seven independent growth/survival assays. Statistical significance of differences in survival percentages (a, c) or in CFU values (d) determined by one-way Anova with Bonferroni post hoc test (*P < 0.05; **P < 0.01; ***P < 0.001; ns: not significant) are shown. In c only the statistical significance of differences in survival percentages between different clinical isolates and the H37Rv reference strains is depicted.

Similar articles

Cited by

References

    1. WHO. Global tuberculosis report 2018. Geneva: World Health Organisation; 2019.
    1. Brosch R, et al. A new evolutionary scenario for the Mycobacterium tuberculosis complex. Proc. Natl Acad. Sci. USA. 2002;99:3684–3689. doi: 10.1073/pnas.052548299. - DOI - PMC - PubMed
    1. Supply P, et al. Genomic analysis of smooth tubercle bacilli provides insights into ancestry and pathoadaptation of Mycobacterium tuberculosis. Nat. Genet. 2013;45:172–179. doi: 10.1038/ng.2517. - DOI - PMC - PubMed
    1. Boritsch EC, et al. pks5-recombination-mediated surface remodelling in Mycobacterium tuberculosis emergence. Nat. Microbiol. 2016;1:15019. doi: 10.1038/nmicrobiol.2015.19. - DOI - PubMed
    1. Comas I, et al. Out-of-Africa migration and Neolithic coexpansion of Mycobacterium tuberculosis with modern humans. Nat. Genet. 2013;45:1176–1182. doi: 10.1038/ng.2744. - DOI - PMC - PubMed

Publication types