. 2020 Feb 4;10(1):1816.
doi: 10.1038/s41598-020-58766-1.

M3C: Monte Carlo reference-based consensus clustering

Affiliations

M3C: Monte Carlo reference-based consensus clustering

Christopher R John et al. Sci Rep. .

Abstract

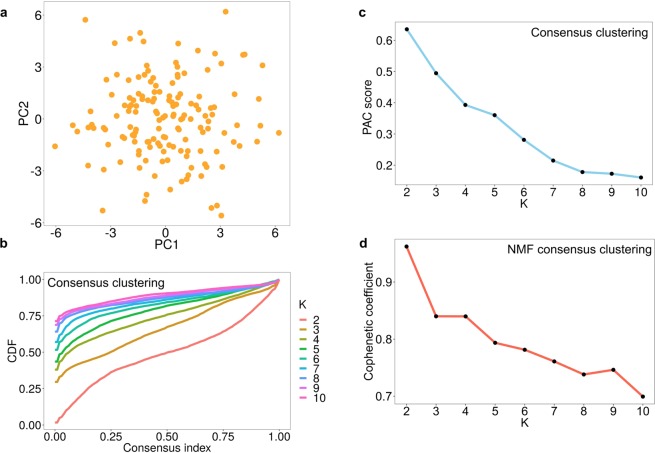
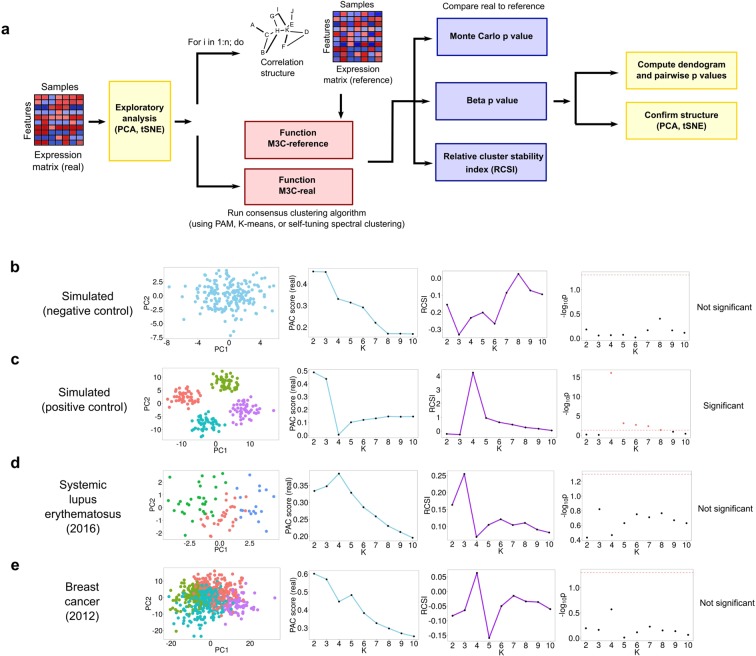
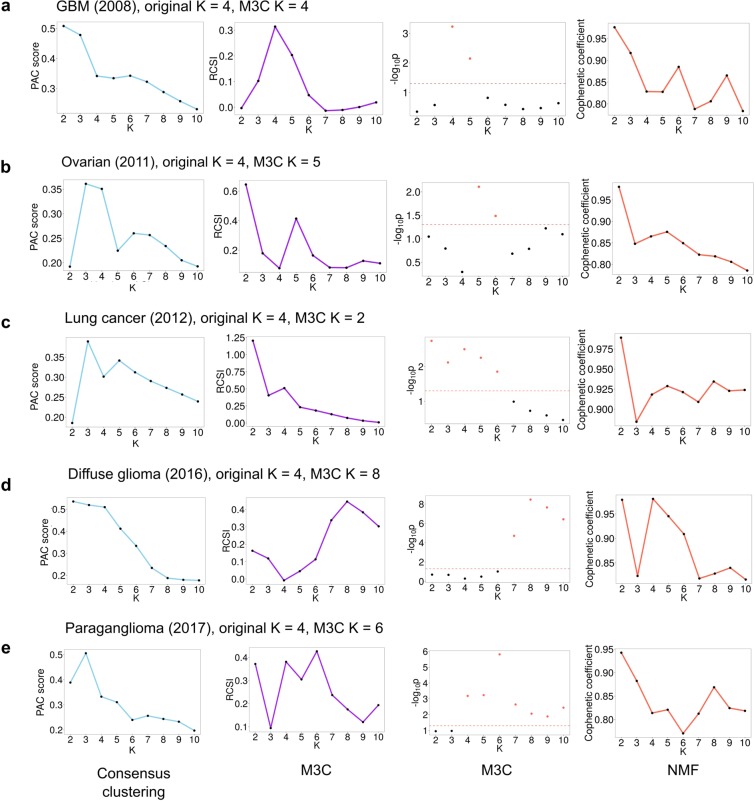
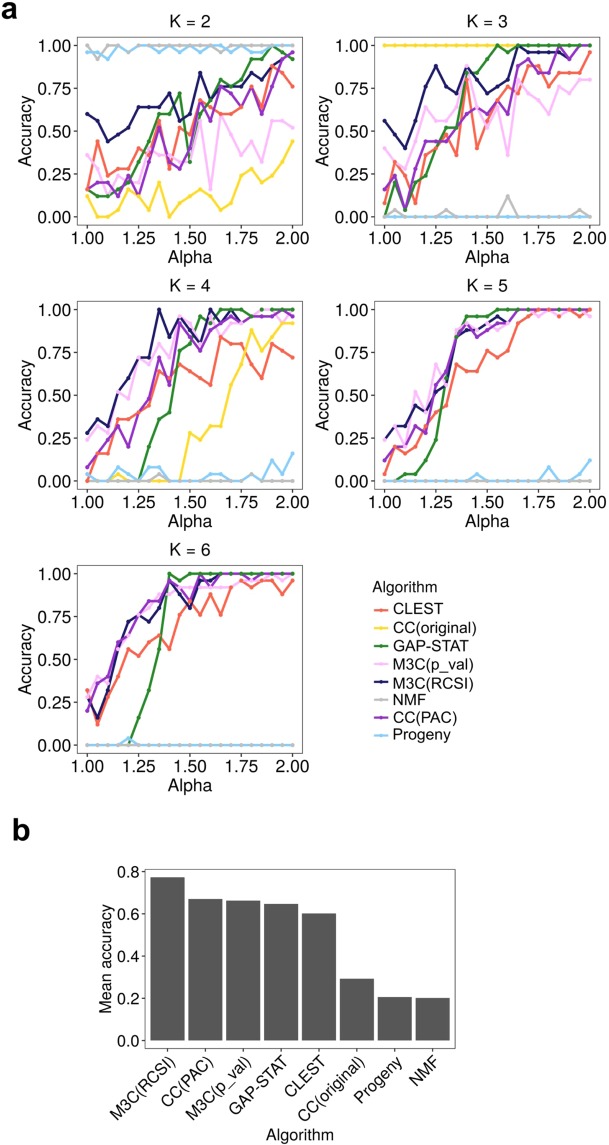
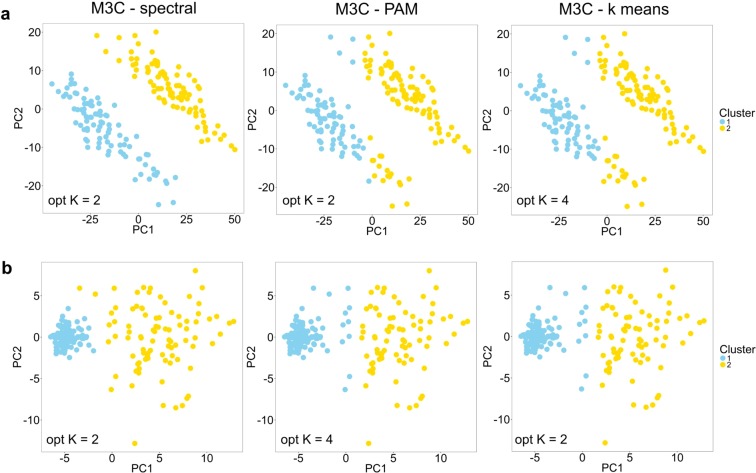
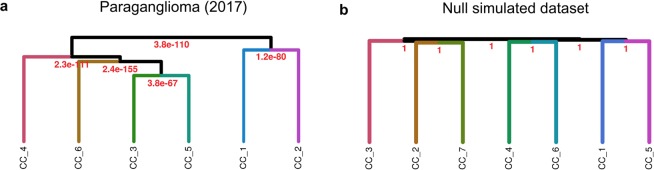
Genome-wide data is used to stratify patients into classes for precision medicine using clustering algorithms. A common problem in this area is selection of the number of clusters (K). The Monti consensus clustering algorithm is a widely used method which uses stability selection to estimate K. However, the method has bias towards higher values of K and yields high numbers of false positives. As a solution, we developed Monte Carlo reference-based consensus clustering (M3C), which is based on this algorithm. M3C simulates null distributions of stability scores for a range of K values thus enabling a comparison with real data to remove bias and statistically test for the presence of structure. M3C corrects the inherent bias of consensus clustering as demonstrated on simulated and real expression data from The Cancer Genome Atlas (TCGA). For testing M3C, we developed clusterlab, a new method for simulating multivariate Gaussian clusters.


Conflict of interest statement

The authors declare no competing interests.

Figures

Figure 1
Figure 1
Bias in the estimation of K using Monti and NMF consensus clustering. (a) A PCA plot of a simulated null dataset where only one cluster should be declared. (b) Monti consensus clustering yields a CDF plot implying improved stability with increased K. (c) The PAC score to measure the stability of K decreases with its value, demonstrating a strong preference towards estimating higher optimal values of K. (d) NMF consensus clustering yields a cophenetic coefficient plot which implies lower values of K are preferable using this method.
Figure 2
Figure 2
Overview of the M3C method and an initial demonstration. (a) A schematic of the M3C method and software. After exploratory PCA to investigate structure, the M3C function may be run which includes two functions; M3C-ref and M3C-real. The M3C-ref function runs consensus clustering with simulated random data sets that maintain the same gene-gene correlation structure of the input data. While, the M3C-real function runs the same algorithm for the input data. Afterwards, the relative cluster stability index (RCSI), Monte Carlo p-values, and beta p-values are calculated. Structural relationships are then analysed using hierarchical clustering of the consensus cluster medoids with SigClust to calculate significance of the dendrogram branch points. (b) Results from running M3C on a simulated null dataset, it can be clearly seen that the p-values do not reach significance along the range of K, therefore the correct result is suggested, K=1. (c) Results from running M3C on a simulated dataset where four clusters are found, the correct decision is made by M3C. (d) Using M3C, a systemic lupus erythematosus dataset was detected with no significant evidence of structure. (e) Similarly, a breast cancer dataset was identified with no significant evidence of structure.
Figure 3
Figure 3
Further evidence of bias existing in widely applied consensus clustering algorithms. (a) Results from running M3C on a glioblastoma dataset found the optimal K was four. Consensus clustering using the PAC-score shows an optimal K of ten, and NMF of two. (b) Results from running M3C on an ovarian cancer dataset found the optimal K was five. Consensus clustering using the PAC-score shows an optimal K of two, and NMF also of two. (c) Results from running M3C on a lung cancer dataset found the optimal K was two. Consensus clustering using the PAC-score shows an optimal K of two, and NMF also of two. (d) Results from running M3C on a diffuse glioma dataset found the optimal K was eight. Consensus clustering using the PAC-score shows an optimal K of ten, and NMF of four. (e) Results from running M3C on a paraganglioma dataset found the optimal K was six. Consensus clustering using the PAC-score shows an optimal K of ten, and NMF of two. It can be observed, consensus clustering using the PAC-score and NMF both tend towards K=10 or K=2, respectively, on real data.
Figure 4
Figure 4
M3C demonstrates good performance in finding K on simulated data. (a) A sensitivity analysis was conducted for every algorithm for K=2 to K=6 while varying the alpha parameter of clusterlab (degree of Gaussian cluster separation). Accuracy was calculated as the fraction of correct optimal K decisions, and for each alpha, with 25 iterations performed at each step. CC(original) refers to the Monti et al. (2003) consensus clustering method, GAP-STAT refer to the GAP-statistic, CC(PAC) refers to consensus clustering with the PAC-score. (b) Performance was calculated across the range of K tested for each algorithm as the mean accuracy.
Figure 5
Figure 5
M3C uses spectral clustering to deal with complex structures. (a) Results from running M3C using either spectral, PAM, or k-means clustering on anisotropic structures. The results for K=2 for each inner algorithm are shown in all cases, in the corner of the plots are the optimal K decisions using the RCSI. (b) Similarly, results from testing different internal algorithms on structures of unequal variance.
Figure 6
Figure 6
M3C can investigate structural relationships between consensus clusters. M3C calculates the medoids of each consensus cluster, then hierarchical clustering is performed on these, SigClust is run to detect the significance of each branch point. (a) Results from M3C structural analysis of the six clusters obtained from the paraganglioma dataset analysis, all p-values were strongly significant, supporting the M3C decision of the declaration of structure. (b) Results from the same analysis run on a simulated null dataset of the same dimensions, no p-values were significant.
Figure 7
Figure 7
M3C can perform quickly across a range of datasets. (a) M3C runtimes (in minutes) for five datasets used in the analysis. Performance was measured on an Intel Core i7-5960X CPU running at 3.00 GHz using a single thread with 32GB of RAM. M3C was run using 25 outer Monte Carlo simulations and 100 inner iterations using the PAM algorithm. (b) M3C and other method runtimes in minutes for a series of simulated datasets with the number of samples (N) ranging from 100–1000 for datasets of 1000 features. CLEST and the GAP-statistic, which also use a Monte Carlo reference procedure, were set to run with 25 Monte Carlo simulations, the same as M3C for comparison. (c) Log-log plot of the same data shown in (b).

References

    1. Ceccarelli M, et al. Molecular profiling reveals biologically discrete subsets and pathways of progression in diffuse glioma. Cell. 2016;164:550–563. doi: 10.1016/j.cell.2015.12.028. - DOI - PMC - PubMed
    1. Fishbein L, et al. Comprehensive molecular characterization of pheochromocytoma and paraganglioma. Cancer cell. 2017;31:181–193. doi: 10.1016/j.ccell.2017.01.001. - DOI - PMC - PubMed
    1. Network CGAR. Comprehensive genomic characterization defines human glioblastoma genes and core pathways. Nature. 2008;455:1061. doi: 10.1038/nature07385. - DOI - PMC - PubMed
    1. Network CGAR. Integrated genomic analyses of ovarian carcinoma. Nature. 2011;474:609. doi: 10.1038/nature10166. - DOI - PMC - PubMed
    1. Network CGAR. Comprehensive genomic characterization of squamous cell lung cancers. Nature. 2012;489:519. doi: 10.1038/nature11404. - DOI - PMC - PubMed