. 2020 Feb 4;10(1):1783.
doi: 10.1038/s41598-020-58687-z.

The upper cervical spinal cord in ALS assessed by cross-sectional and longitudinal 3T MRI

Affiliations

The upper cervical spinal cord in ALS assessed by cross-sectional and longitudinal 3T MRI

Thomas Wimmer et al. Sci Rep. .

Abstract

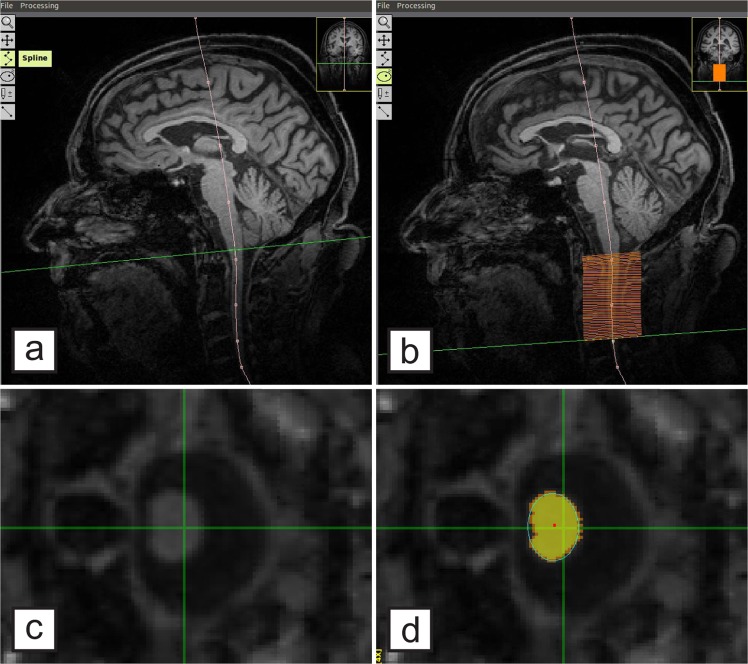
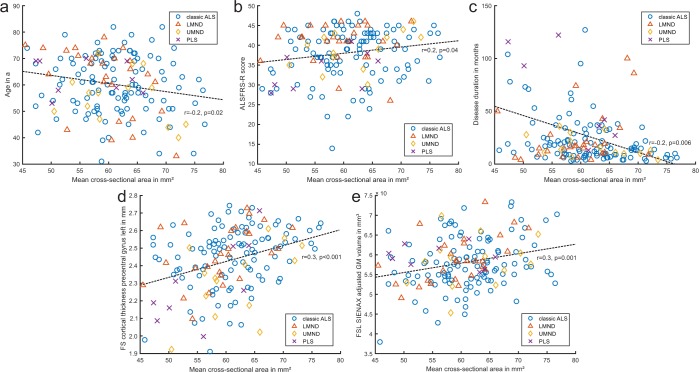
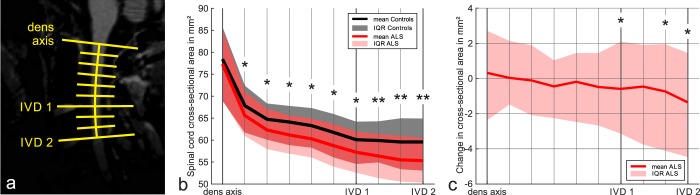
The upper cervical spinal cord is measured in a large longitudinal amyotrophic lateral sclerosis (ALS) cohort to evaluate its role as a biomarker. Specifically, the cervical spinal cord´s cross-sectional area (CSA) in plane of the segments C1-C3 was measured semi-automatically with T1-weighted 3T MRI sequences in 158 ALS patients and 86 controls. Six-month longitudinal follow-up MRI scans were analyzed in 103 patients. Compared to controls, in ALS there was a significant mean spinal cord atrophy (63.8 mm² vs. 60.8 mm², p = 0.001) which showed a trend towards worsening over time (mean spinal cord CSA decrease from 61.4 mm² to 60.6 mm² after 6 months, p = 0.06). Findings were most pronounced in the caudal segments of the upper cervical spinal cord and in limb-onset ALS. Baseline CSA was related to the revised ALS functional rating scale, disease duration, precentral gyrus thickness and total brain gray matter volume. In conclusion, spinal cord atrophy as assessed in brain MRIs in ALS patients mirrors the extent of overall neurodegeneration and parallels disease severity.


Conflict of interest statement

The authors declare no competing interests.

Figures

Figure 1
Figure 1
Measurement of the cervical spinal cord cross-sectional area (CSA) applying SpineSeg. (a) demonstrates the cerebral 3T MRI, covering the upper segments of the cervical spinal cord, in a sagittal view. A guiding curve (pink) was placed along the spinal cord in the coronal and sagittal plane; the image is consequently resampled into perpendicular slices. Within the slices from the dens axis until the second intervertebral disk (b), the cervical spinal CSA segmentation was derived using a semi-automated tree pruning approach. Transversal view of the spinal cord is demonstrated before (c) and after (d) segmentation, respectively. (d) Seed in red, segmentation in yellow.
Figure 2
Figure 2
Quantile function of baseline mean cervical spinal cord cross-sectional area in ALS and controls. (a) CSA in ALS was significantly smaller than in controls. (b) CSA was further significantly smaller in limb- compared to bulbar-onset ALS. *p ≤ 0.05, **p ≤ 0.001 (all statistical models are adjusted for baseline age).
Figure 3
Figure 3
Relationship between baseline mean cervical spinal cord cross-sectional area (CSA) and various variables in ALS. CSA relates to baseline (a) age, (b) total revised ALS functional rating scale (ALSFRS-R), (c) disease duration, (d) cortical thickness of left precentral gyrus, (e) total adjusted gray matter (GM) volume. Some patients labelled PLS did not fulfill the demand of a period of at least 4 years with UMN signs only at the time of 3T MRI, but would go on to be diagnosed with PLS after the study’s conclusion. FS, Freesurfer; FSL, FMRIB Software Library; LMND, lower motor neuron dominant ALS; UMND, upper motor neuron dominant ALS; PLS, primary lateral sclerosis. P-values ≤ 0.05 were deemed statistically significant.
Figure 4
Figure 4
Cross-sectional area along the studied upper cervical spinal cord length in ALS and controls. For analysis of CSA distribution along the spinal cord, five intermediate positions between dens axis and the center of the first intervertebral disk (IVD) and two between first and second IVD were calculated, as indicated in (a). The cross-sectional area in these positions is compared between ALS and controls in (b), displaying means for ALS and controls as well as the interquartile range (IQR) for both groups. Significantly smaller CSA values were found in ALS in all positions below the dens axis. The longitudinal change in CSA along the spinal cord in ALS in shown in (c), indicating that significant CSA changes are only found in the more caudal areas between IVD 1 and IVD 2. *p ≤ 0.05, **p ≤ 0.001 (all statistical models are adjusted for baseline age).
Figure 5
Figure 5
Baseline and follow-up mean cervical spinal cord cross-sectional area and ALSFRS-R in ALS. Markers are spread out to display measurement quantiles, as given in the top axis. *p ≤ 0.05 (all statistical models are adjusted for baseline age).

References

    1. Goetz Christopher G. Amyotrophic lateral sclerosis: Early contributions of Jean-Martin Charcot. Muscle & Nerve. 2000;23(3):336–343. doi: 10.1002/(SICI)1097-4598(200003)23:3<336::AID-MUS4>3.0.CO;2-L. - DOI - PubMed
    1. Brettschneider J, et al. TDP-43 pathology and neuronal loss in amyotrophic lateral sclerosis spinal cord. Acta Neuropathol. 2014;128:423–437. doi: 10.1007/s00401-014-1299-6. - DOI - PMC - PubMed
    1. Brettschneider J, et al. Stages of pTDP-43 pathology in amyotrophic lateral sclerosis. Ann Neurol. 2013;74:20–38. doi: 10.1002/ana.23937. - DOI - PMC - PubMed
    1. Geser F, et al. Motor neuron disease clinically limited to the lower motor neuron is a diffuse TDP-43 proteinopathy. Acta Neuropathol. 2011;121:509–517. doi: 10.1007/s00401-011-0797-z. - DOI - PMC - PubMed
    1. Agosta F, et al. A longitudinal diffusion tensor MRI study of the cervical cord and brain in amyotrophic lateral sclerosis patients. J Neurol Neurosurg Psychiatry. 2009;80:53–55. doi: 10.1136/jnnp.2008.154252. - DOI - PubMed

Publication types