. 2020 Feb 4;10(1):1808.
doi: 10.1038/s41598-020-58708-x.

Ferumoxytol-enhanced three-dimensional magnetic resonance imaging of carotid atheroma- a feasibility and temporal dependence study

Affiliations

Ferumoxytol-enhanced three-dimensional magnetic resonance imaging of carotid atheroma- a feasibility and temporal dependence study

Ammara Usman et al. Sci Rep. .

Abstract

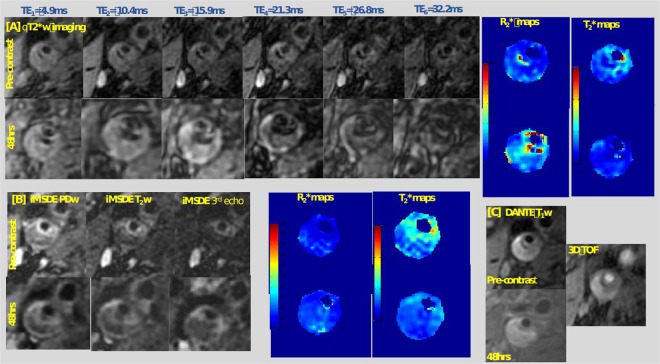
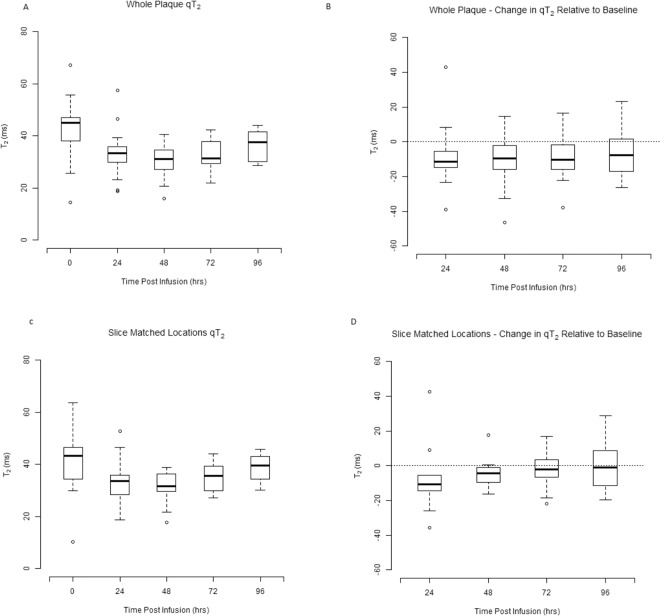
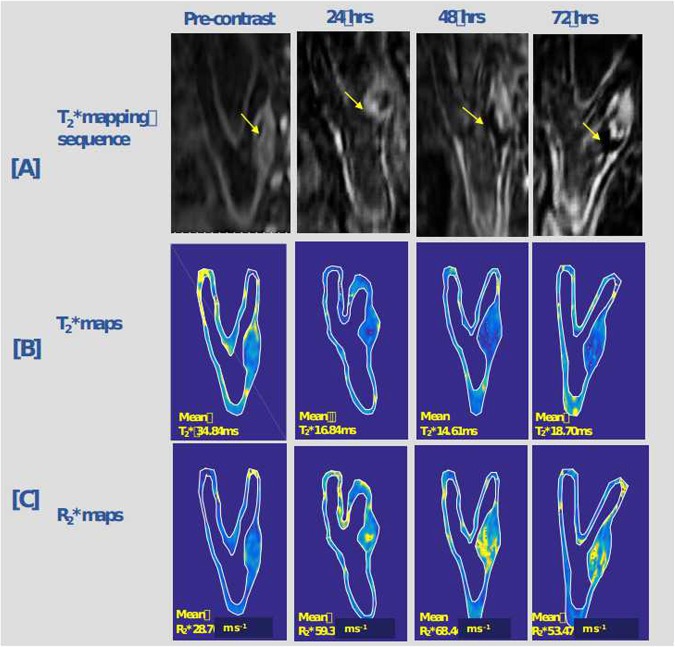
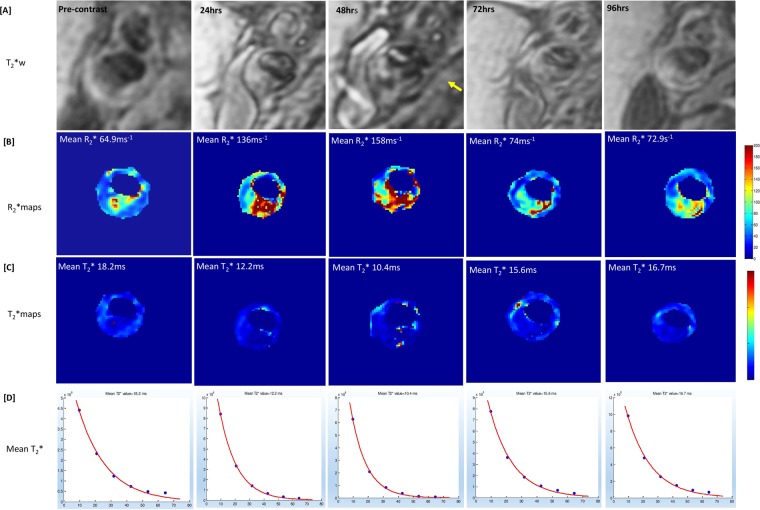
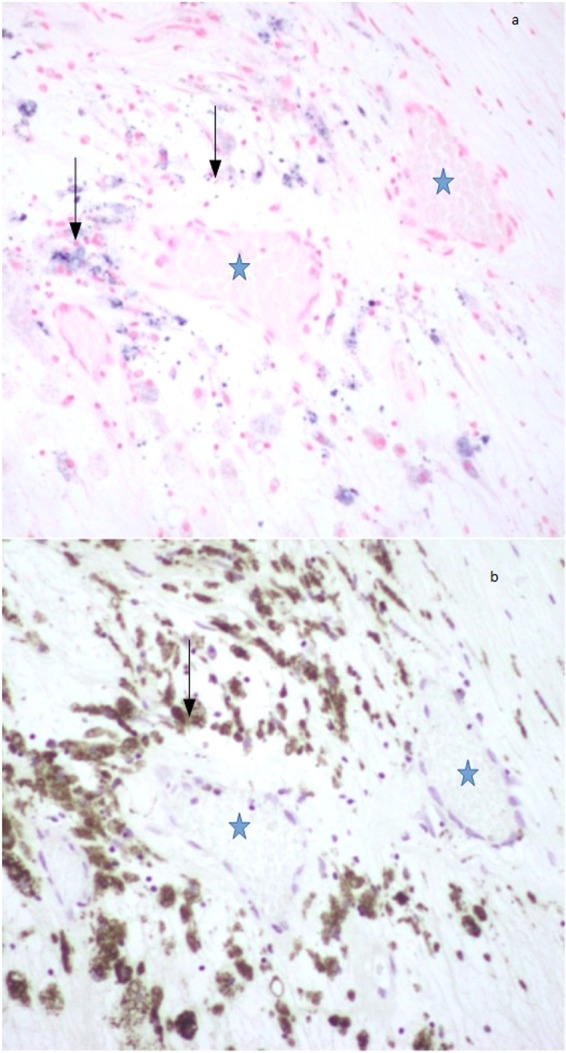
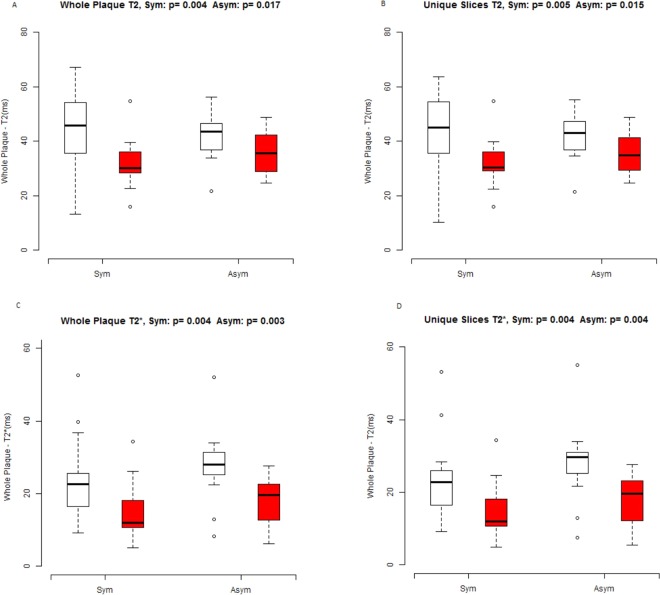
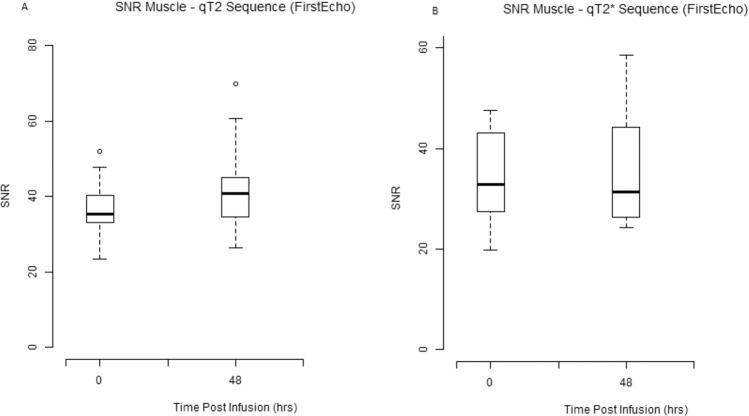
Ferumoxytol is an ultrasmall super paramagnetic particles of iron oxide (USPIO) agent recently used for magnetic resonance (MR) vascular imaging. Other USPIOs have been previously used for assessing inflammation within atheroma. We aim to assess feasibility of ferumoxytol in imaging carotid atheroma (with histological assessment); and the optimum MR imaging time to detect maximum quantitative signal change post-ferumoxytol infusion. Ten patients with carotid artery disease underwent high-resolution MR imaging of their carotid arteries on a 1.5 T MR system. MR imaging was performed before and at 24, 48, 72 and 96 hrs post ferumoxytol infusion. Optimal ferumoxytol uptake time was evaluated by quantitative relaxometry maps indicating the difference in T2* (ΔT2*) and T2 (ΔT2) between baseline and post-Ferumoxytol MR imaging using 3D DANTE MEFGRE qT2*w and iMSDE black-blood qT2w sequences respectively. 20 patients in total (10 symptomatic and 10 with asymptomatic carotid artery disease) had ferumoxytol-enhanced MR imaging at the optimal imaging window. 69 carotid MR imaging studies were completed. Ferumoxytol uptake (determined by a decrease in ΔT2* and ΔT2) was identified in all carotid plaques (symptomatic and asymptomatic). Maximum quantitative decrease in ΔT2* (10.4 [3.5-16.2] ms, p < 0.001) and ΔT2 (13.4 [6.2-18.9] ms; p = 0.001) was found on carotid MR imaging at 48 hrs following the ferumoxytol infusion. Ferumoxytol uptake by carotid plaques was assessed by histopathological analysis of excised atheroma. Ferumoxytol-enhanced MR imaging using quantitative 3D MR pulse sequences allows assessment of inflammation within carotid atheroma in symptomatic and asymptomatic patients. The optimum MR imaging time for carotid atheroma is 48 hrs after its administration.


Conflict of interest statement

The authors declare no competing interests.

Figures

Figure 1
Figure 1
Detailed multi-contrast ferumoxytol-enhanced magnetic resonance imaging protocol of carotid atheroma demonstrating the qT2* with six echo times, qT2 with three echo times and T1 pulse sequence at baseline and 48hrs post ferumoxytol administration with corresponding R2* and T2*maps. This figure illustrates the detailed MR imaging protocol at baseline and 48 hrs after the administration of ferumoxytol in a patient with right internal carotid artery stenosis >70% as calculated by NASCET criteria. Panel [A] shows the multi-echo T2*/R2* mapping sequence with six echo times and the corresponding R2* and T2* maps before and at 48 hrs following the administration of ferumoxytol. Panel [B] shows the iMSDE PD and T2 mapping sequence and the corresponding R2 and T2 maps before and at 48 hrs following the ferumoxytol administration. Panel [C] demonstrates the 3D TOF (time of flight) and T1 images pre-contrast and at 48 hrs of ferumoxytol administration.
Figure 2
Figure 2
Box and whisker plots of whole plaque and slice matched quantitative T2 and change in quantitative T2 at 24, 48, 72 and 96 hrs post ferumoxytol administration relative to baseline. Figure illustrates the qT2 of (A) whole plaque (C) slice matched location with carotid bifurcation taken as a reference for slice match representing all 10 patients at baseline, 24, 48, 72 and 96 hrs post ferumoxytol administration. (B) Demonstrates the change in whole plaque qT2 at 24, 48, 72 and 96hrs relative to the baseline (p = 0.006), (p < 0.001), (p = 0.002) (p = 0.070) respectively (D) demonstrates the slice matched location change in qT2 at 24, 48, 72 and 96 hrs relative to the baseline (p = 0.053), (p = 0.015), (p = 0.093), (p = 0.770) respectively.
Figure 3
Figure 3
Box and whisker plots of whole carotid plaque and slice matched quantitative T2* and change in quantitative T2* at 24, 48, 72 and 96 hrs post ferumoxytol administration relative to baseline. Box and whisker plots illustrate the qT2* of (A) whole plaque (C) slice matched location with carotid bifurcation taken as a reference for slice match representing all 10 patients at baseline, 24, 48, 72 and 96 hrs post ferumoxytol administration. (B) Demonstrates the change in whole plaque qT2* at 24, 48, 72 and 96hrs relative to the baseline (p < 0.001), (p < 0.001), (p = 0.154) (p = 0.091) respectively (D) demonstrates the slice matched location change in qT2* at 24, 48, 72 and 96 hrs relative to the baseline (p = 0.001), (p < 0.001), (p = 0.222), (p = 0.020) respectively.
Figure 4
Figure 4
Oblique view of quantitative T2*mapping sequence of the carotid artery pre-contrast and 24, 48, 72 hrs post ferumoxytol with its corresponding T2* and R2* maps. An internal carotid artery plaque occupying more than 70% of the lumen is evident. [A] Demonstrates images acquired by the T2*/R2*mapping sequence at baseline and 24, 48 and 72 hrs following ferumoxytol infusion. Note the signal void at 48hrs-72hrs (yellow arrow) reflecting ferumoxytol uptake, [B] shows the corresponding oblique T2* maps with relative decrease in T2* values and maximum decrease at 48 hrs, [C] demonstrates the corresponding increase in R2*values with maximum increase at 48 hrs. The maximum T2* drop was seen on 48 hrs which also corresponds to the maximum R2* increase at the same time frame.
Figure 5
Figure 5
Ferumoxytol-enhanced magnetic resonance images of carotid atheroma with corresponding T2*/R2* maps and T2* graphs at baseline and 24, 48, 72 and 96 hrs of ferumoxytol administration demonstrating the maximum R2* increase of the atherosclerotic plaque after ferumoxytol administration at 48 hrs. [A] Images of the multi-echo T2*/R2* MR sequence at all 5 time points with signal void in carotid atheroma (yellow arrow) visible at 48 hrs following ferumoxytol administration. [B] Shows corresponding R2* maps (mean R* values) pre-contrast and at 24 hr, 48 hr, 72 hr and 96 hr following ferumoxytol administration. Note the maximum R2* increase of the atherosclerotic plaque after ferumoxytol administration at 48hrs, reflecting USPIO uptake. [C,D] Shows the corresponding T2* maps and graphs demonstrating maximum decrease in T2* values at 48 hr.
Figure 6
Figure 6
(a) Iron within ferumoxytol stained blue on Perl’s stain- back arrows (at 20 × magnification). (b) Immunohistochemical staining of macrophages (CD68) demonstrates the co-localization of the macrophages (black arrows) in the area corresponding to the ferumoxytol uptake on Perl’s stain (a). Neovessels (blue star) seem to be in vicinity of areas abundant in macrophages.
Figure 7
Figure 7
Box and whisker plots illustrates the Ferumoxytol uptake by symptomatic and asymptomatic patient cohort at baseline and 48 hrs post ferumoxytol MR imaging (A) the ∆ T 2 values, p = 0.030, p = 0.002 for symptomatic and asymptomatic patient cohort respectively. (B) The ∆T2*values, p = 0.003, p < 0.001 for symptomatic and asymptomatic cohort respectively.
Figure 8
Figure 8
Box and whisker plots illustrate signal-to-noise ratio muscle on qT2* and qT2 weighted sequences at pre and 48hrs post ferumoxytol MR imaging (A) SNR muscle on qT2* weighted sequence (B) SNR muscle on qT2 weighted sequence at baseline and 48 hrs post-ferumoxytol MR imaging sessions.
Figure 9
Figure 9
Representative quantitative T2* and quantitative T2 mapping images pre and 48hrs post ferumoxytol and corresponding R2*/T2*maps of carotid atheroma of a patient with asymptomatic carotid artery disease. (A) Pre-contrast qT2* = 34.8 ms (B) Post ferumoxytol qT2*with corresponding R2*/T2*maps and graphs demonstrating mean T2*values = 13.1 ms (C) Pre-contrast qT2 = 56.8 ms (D) Post ferumoxytol qT2 with corresponding R2*/T2*maps and graphs demonstrating mean T2*values of 35.5 ms.

References

    1. Libby P, Lichtman AH, Hansson GK. Immune effector mechanisms implicated in atherosclerosis: from mice to humans. Immun. 2013;38:1092–1104. doi: 10.1016/j.immuni.2013.06.009. - DOI - PMC - PubMed
    1. Moreno PR, Purushothaman M, Purushothaman KR. Plaque neovascularization: defense mechanisms, betrayal, or a war in progress. Ann. N. Y. Acad. Sci. 2012;1254:7–17. doi: 10.1111/j.1749-6632.2012.06497.x. - DOI - PubMed
    1. Sadat U, et al. Inflammation and neovascularization intertwined in atherosclerosis: imaging of structural and molecular imaging targets. Circulation. 2014;130:786–794. doi: 10.1161/CIRCULATIONAHA.114.010369. - DOI - PMC - PubMed
    1. Chinetti-Gbaguidi G, Colin S, Staels B. Macrophage subsets in atherosclerosis. Nat. Rev. Cardiol. 2015;12:10–17. doi: 10.1038/nrcardio.2014.173. - DOI - PubMed
    1. Falk E, Nakano M, Bentzon JF, Finn AV, Virmani R. Update on acute coronary syndromes: the pathologists’ view. Eur. Heart J. 2013;34:719–728. doi: 10.1093/eurheartj/ehs411. - DOI - PubMed

Publication types

Substances