

High-resolution PET imaging reveals subtle impairment of the serotonin transporter in an early non-depressed Parkinson's disease cohort
- PMID: 32020370
- PMCID: PMC7396398
- DOI: 10.1007/s00259-020-04683-4
High-resolution PET imaging reveals subtle impairment of the serotonin transporter in an early non-depressed Parkinson's disease cohort
Abstract
Purpose: The serotonin transporter (SERT) is a biochemical marker for monoaminergic signaling in brain and has been suggested to be involved inthe pathophysiology of Parkinson's disease (PD). The aim of this PET study was to examine SERT availability in relevant brain regions in early stages ofnon-depressed PD patients.
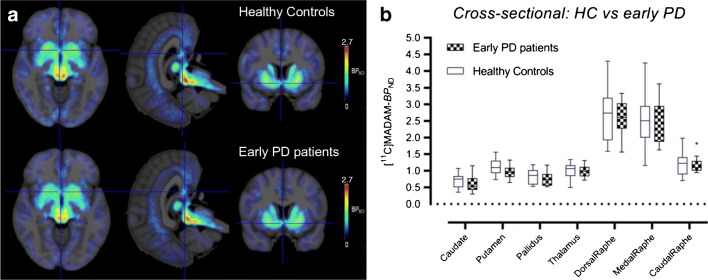
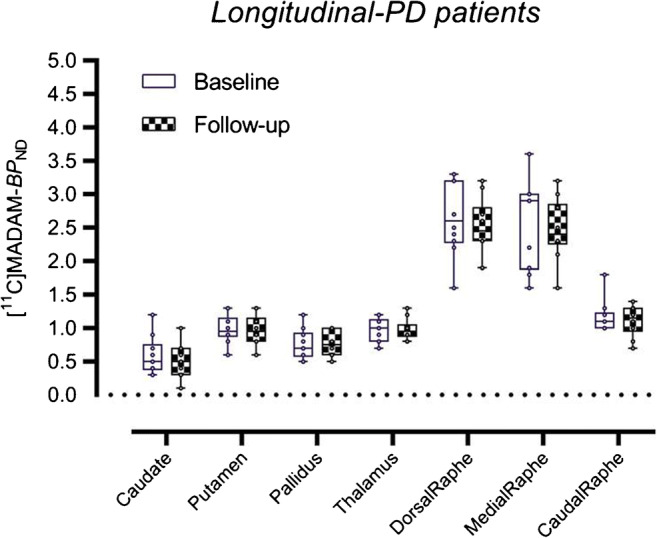
Methods: In a cross-sectional study, 18 PD patients (13 M/5F, 64 ± 7 years, range 46-74 years, disease duration 2.9 ± 2.6 years; UPDRS motor 21.9 ± 5.2) and 20 age- and gender-matched healthy control (HC) subjects (15 M/5F, 61 ± 7 years, range 50-72 years) were included. In a subsequent longitudinal phase, ten of the PD patients (7 M/3F, UPDRS motor 20.6 ± 6.9) underwent a second PET measurement after 18-24 months. After a 3-T MRI acquisition, baseline PET measurements were performed with [11C]MADAM using a high-resolution research tomograph. The non-displaceablebinding potential (BPND) was chosen as the outcome measure and was estimated at voxel level on wavelet-aided parametric images, by using the Logan graphical analysis and the cerebellum as reference region. A molecular template was generated to visualize and define different subdivisions of the raphe nuclei in the brainstem. Subortical and cortical regions of interest were segmented using FreeSurfer. Univariate analyses and multivariate network analyses were performed on the PET data.
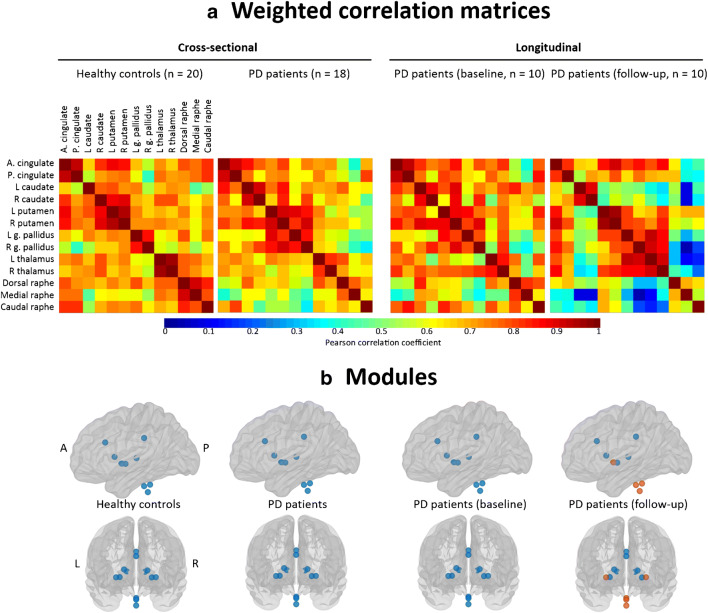
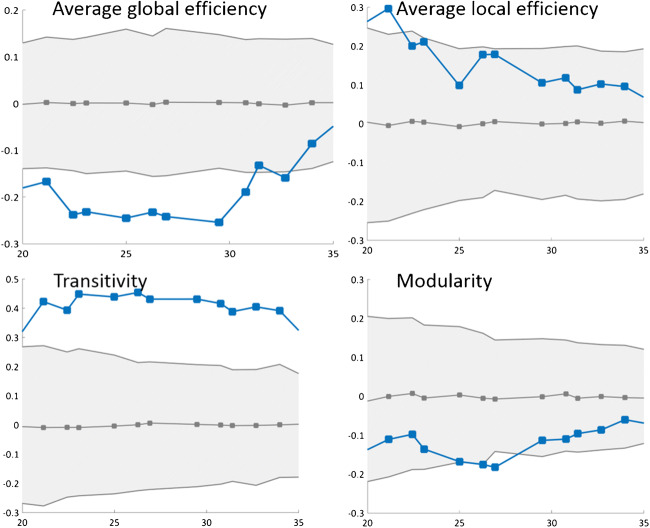
Results: The univariate region-based analysis showed no differences in SERT levels when the PD patients were compared with the HC neither at baseline or after 2 years of follow-up. The multivariate network analysis also showed no differences at baseline. However, prominent changes in integration and segregation measures were observed at follow-up, indicating a disconnection of the cortical and subcortical regions from the three nuclei of the raphe.
Conclusion: We conclude that the serotoninergic system in PD patients seems to become involved with a network dysregulation as the disease progresses, suggesting a disturbed serotonergic signaling from raphe nuclei to target subcortical and cortical regions.
Keywords: Functional connectivity/graph analysis; Parkinson’s disease; Raphe nuclei; The serotoninergic system.
Conflict of interest statement
Patrik Fazio, Christer Halldin, Eric Westman, and Daniel Ferreira declare that they have no potential conflicts of interest. Dr. Varrone reports grants from Swedish Science Council, AstraZeneca Translational Science Centre at KI, Swedish Parkinson Foundation, and Eira Larsson during the conduct of the study. Lars Farde owns shares in AstraZeneca Pharmaceutical.
Figures
Similar articles
-
Preserved Serotonin Transporter Availability in Parkinson Disease Measured with Either [11C]MADAM or [11C]DASB: A Study Including 2 Separate Cohorts of Nondepressed Patients.J Nucl Med. 2025 Feb 3;66(2):309-314. doi: 10.2967/jnumed.124.268233. J Nucl Med. 2025. PMID: 39746753
-
Serotonergic dysregulation is linked to sleep problems in Parkinson's disease.Neuroimage Clin. 2018 Mar 2;18:630-637. doi: 10.1016/j.nicl.2018.03.001. eCollection 2018. Neuroimage Clin. 2018. PMID: 29845011 Free PMC article.
-
[¹⁸F]FDOPA uptake in the raphe nuclei complex reflects serotonin transporter availability. A combined [¹⁸F]FDOPA and [¹¹C]DASB PET study in Parkinson's disease.Neuroimage. 2012 Jan 16;59(2):1080-4. doi: 10.1016/j.neuroimage.2011.09.034. Epub 2011 Sep 22. Neuroimage. 2012. PMID: 21963917
-
Serotonin transporter in Parkinson's disease: A meta-analysis of positron emission tomography studies.Ann Neurol. 2017 Feb;81(2):171-180. doi: 10.1002/ana.24859. Ann Neurol. 2017. PMID: 28019672 Review.
-
Serotonergic imaging in Parkinson's disease.Prog Brain Res. 2021;261:303-338. doi: 10.1016/bs.pbr.2020.11.001. Epub 2021 Jan 29. Prog Brain Res. 2021. PMID: 33785134 Review.
Cited by
-
The pathobiological basis of depression in Parkinson disease: challenges and outlooks.J Neural Transm (Vienna). 2022 Dec;129(12):1397-1418. doi: 10.1007/s00702-022-02559-5. Epub 2022 Nov 2. J Neural Transm (Vienna). 2022. PMID: 36322206 Free PMC article. Review.
-
Imaging Biomarkers in Prodromal and Earliest Phases of Parkinson's Disease.J Parkinsons Dis. 2024;14(s2):S353-S365. doi: 10.3233/JPD-230385. J Parkinsons Dis. 2024. PMID: 38339941 Free PMC article. Review.
-
Cytochrome P450 and Epoxide Hydrolase Metabolites in Aβ and tau-induced Neurodegeneration: Insights from Caenorhabditis elegans.bioRxiv [Preprint]. 2023 Oct 2:2023.10.02.560527. doi: 10.1101/2023.10.02.560527. bioRxiv. 2023. PMID: 37873467 Free PMC article. Preprint.
-
Outcome Measures for Disease-Modifying Trials in Parkinson's Disease: Consensus Paper by the EJS ACT-PD Multi-Arm Multi-Stage Trial Initiative.J Parkinsons Dis. 2023;13(6):1011-1033. doi: 10.3233/JPD-230051. J Parkinsons Dis. 2023. PMID: 37545260 Free PMC article.
-
Molecular connectivity studies in neurotransmission: a scoping review.Imaging Neurosci (Camb). 2025 Apr 4;3:imag_a_00530. doi: 10.1162/imag_a_00530. eCollection 2025. Imaging Neurosci (Camb). 2025. PMID: 40800788 Free PMC article.
References
-
- Fereshtehnejad S, Zeighami Y, Dagher A, Postuma RB. Clinical criteria for subtyping Parkinson’s disease: biomarkers and longitudinal progression. 2017; 140(7):1959-1976. 10.1093/brain/awx118. - PubMed
-
- Huot P, Fox SH. The serotonergic system in motor and non-motor manifestations of Parkinson’s disease. Exp Brain Res. 2013;230(4):463-76.10.1007/s00221-013-3621-2. - PubMed
Publication types
MeSH terms
Substances
LinkOut - more resources
Full Text Sources
Medical
