Multi-dimensional omics characterization in glioblastoma identifies the purity-associated pattern and prognostic gene signatures
- PMID: 32021566
- PMCID: PMC6995093
- DOI: 10.1186/s12935-020-1116-3
Multi-dimensional omics characterization in glioblastoma identifies the purity-associated pattern and prognostic gene signatures
Abstract
Background: The presence of tumor-associated stroma and tumor-infiltrated immune cells have been largely reported across glioblastomas. Tumor purity, defined as the proportion of tumor cells in the tumor, was associated with the genomic and clinicopathologic features of the tumor and may alter the interpretation of glioblastoma biology.
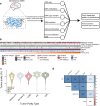
Methods: We use an integrative approach to infer tumor purity based on multi-omic data and comprehensively evaluate the impact of tumor purity on glioblastoma (GBM) prognosis, genomic profiling, and the immune microenvironment in the Cancer Genome Atlas Consortium (TCGA) cohort.
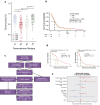
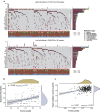
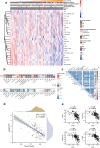
Results: We found that low tumor purity was significantly associated with reduced survival time. Additionally, we established a purity-relevant 5-gene signature that was an independent prognostic biomarker and validated it in the TCGA, CGGA and GSE4412 cohort. Moreover, we correlated tumor purity with genomic characteristics and tumor microenvironment. We identified that gamma delta T cells in glioblastoma microenvironment were positively correlated with purity and served as a marker for favorable prognosis, which was validated in both TCGA and CGGA dataset.
Conclusions: We observe the potential confounding effects of tumor purity on GBM clinical and molecular information interpretation. GBM microenvironment could be purity-dependent, which provides new insights into the clinical implications of glioblastoma.
Keywords: Glioblastoma; Tumor heterogeneity; Tumor immunity; Tumor microenvironment; Tumor purity.
© The Author(s) 2020.
Conflict of interest statement
Competing interestsThe authors declare that they have no competing interests.
Figures


Similar articles
-
Systematic identification, development, and validation of prognostic biomarkers involving the tumor-immune microenvironment for glioblastoma.J Cell Physiol. 2021 Jan;236(1):507-522. doi: 10.1002/jcp.29878. Epub 2020 Jun 22. J Cell Physiol. 2021. PMID: 32572951
-
Immunological classification of glioblastoma and its prognostic implications.Am J Transl Res. 2022 Nov 15;14(11):8009-8022. eCollection 2022. Am J Transl Res. 2022. PMID: 36505340 Free PMC article.
-
Prognostic value and immune relevancy of a combined autophagy-, apoptosis- and necrosis-related gene signature in glioblastoma.BMC Cancer. 2022 Mar 3;22(1):233. doi: 10.1186/s12885-022-09328-3. BMC Cancer. 2022. PMID: 35241019 Free PMC article.
-
Investigation of Genetic Determinants of Glioma Immune Phenotype by Integrative Immunogenomic Scale Analysis.Front Immunol. 2021 Jun 16;12:557994. doi: 10.3389/fimmu.2021.557994. eCollection 2021. Front Immunol. 2021. PMID: 34220791 Free PMC article.
-
Molecular Heterogeneity and Immunosuppressive Microenvironment in Glioblastoma.Front Immunol. 2020 Jul 17;11:1402. doi: 10.3389/fimmu.2020.01402. eCollection 2020. Front Immunol. 2020. PMID: 32765498 Free PMC article. Review.
Cited by
-
Revealing the inhibitory effect of VASH1 on ovarian cancer from multiple perspectives.Cancer Biol Ther. 2023 Dec 31;24(1):2285817. doi: 10.1080/15384047.2023.2285817. Epub 2023 Nov 27. Cancer Biol Ther. 2023. PMID: 38010374 Free PMC article.
-
Nucleotide-Binding Oligomerization Domain (NOD)-Like Receptor Subfamily C (NLRC) as a Prognostic Biomarker for Glioblastoma Multiforme Linked to Tumor Microenvironment: A Bioinformatics, Immunohistochemistry, and Machine Learning-Based Study.J Inflamm Res. 2023 Feb 10;16:523-537. doi: 10.2147/JIR.S397305. eCollection 2023. J Inflamm Res. 2023. PMID: 36798872 Free PMC article.
-
Comprehensive Analyses of Ferroptosis-Related Alterations and Their Prognostic Significance in Glioblastoma.Front Mol Biosci. 2022 Jun 3;9:904098. doi: 10.3389/fmolb.2022.904098. eCollection 2022. Front Mol Biosci. 2022. PMID: 35720126 Free PMC article.
-
A New Era of Neuro-Oncology Research Pioneered by Multi-Omics Analysis and Machine Learning.Biomolecules. 2021 Apr 12;11(4):565. doi: 10.3390/biom11040565. Biomolecules. 2021. PMID: 33921457 Free PMC article. Review.
-
Identification and Validation of Immune-Related Gene for Predicting Prognosis and Therapeutic Response in Ovarian Cancer.Front Immunol. 2021 Nov 22;12:763791. doi: 10.3389/fimmu.2021.763791. eCollection 2021. Front Immunol. 2021. PMID: 34880862 Free PMC article.
References
LinkOut - more resources
Full Text Sources

