

Oleic acid ameliorates palmitic acid induced hepatocellular lipotoxicity by inhibition of ER stress and pyroptosis
- PMID: 32021639
- PMCID: PMC6990600
- DOI: 10.1186/s12986-020-0434-8
Oleic acid ameliorates palmitic acid induced hepatocellular lipotoxicity by inhibition of ER stress and pyroptosis
Erratum in
-
Correction to: Oleic acid ameliorates palmitic acid induced hepatocellular lipotoxicity by inhibition of ER stress and pyroptosis.Nutr Metab (Lond). 2020 Mar 12;17:18. doi: 10.1186/s12986-020-00438-y. eCollection 2020. Nutr Metab (Lond). 2020. PMID: 32190095 Free PMC article.
Abstract
Background: Pyroptosis is a novel programmed cell death. It is identified as caspase-1 dependent and characterized by plasma-membrane rupture and release of proinflammatory intracellular contents inculuding IL-1 beta and IL-18. Pyroptosis is distinct from other forms of cell death, especially apoptosis that is characterized by nuclear and cytoplasmic condensation and is elicited via activation of a caspase cascade. In pyroptosis, gasdermin D (GSDMD) acts as a major executor, while NLRP3 related inflammasome is closely linked to caspase-1 activation. Given that pyroptosis has played a critical role in the progression of non-alcoholic steatohepatitis (NASH), here, we investigated whether the regulation of pyroptosis activation is responsible for the protective role of monounsaturated oleic acids in the context of hepatocellular lipotoxicity.
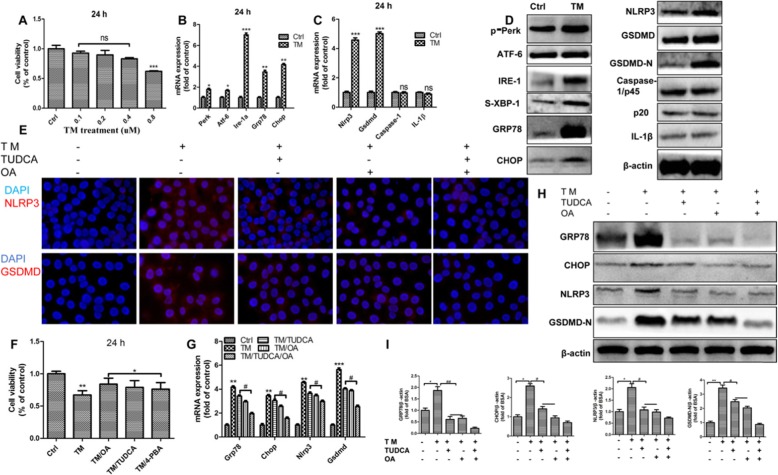
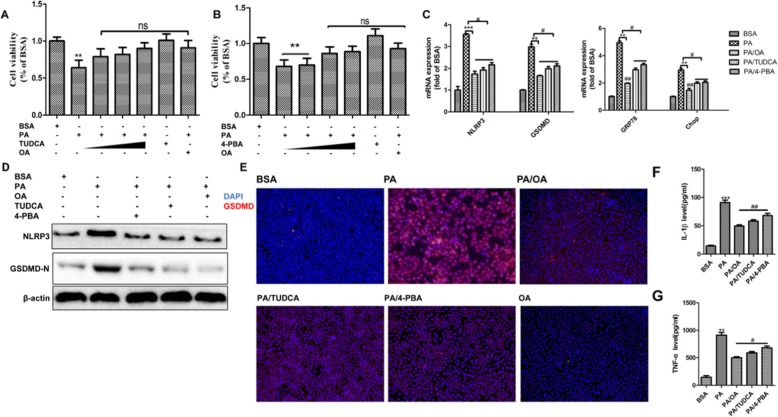
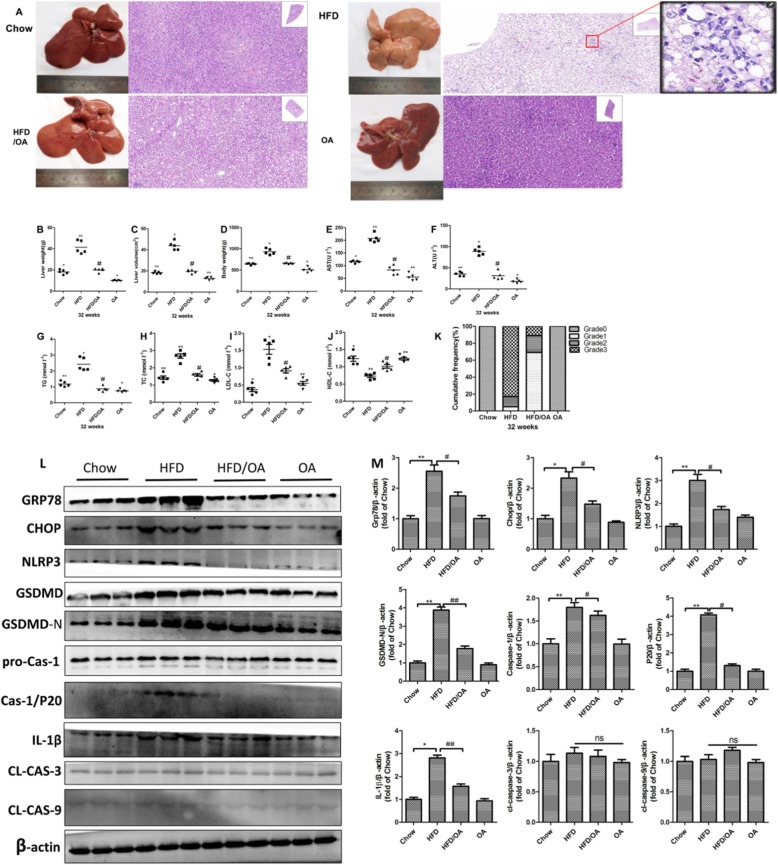
Methods: Human hepatoma cell line HepG2 cells were exposed to palmitic acid (PA) with or without oleic acids (OA) or/and endoplasmic reticulum (ER) stress inhibitor tauroursodeoxycholic acid (TUDCA) for 24 h. Besides, the cells were treated with the chemical ER stressor tunicamycin (TM) with or without OA for 24 h as well. The expressions of pyroptosis and ER stress related genes or proteins were determined by real-time PCR, Western blot or immunofluorescence. The morphology of pyroptosis was detected by acridine orange and ethidium bromide (AO/EB) staining. The release of IL-1 beta and tumor necrosis factor alpha (TNF-α) was determined by ELISA. Sprague-Dawley (SD) rats were fed with high fat diet (HFD) for 16 w, then, HFD was half replaced by olive oil to observe the protective effects of olive oil. The blood chemistry were analyzed, and the liver histology and the expressions of related genes and proteins were determined in the liver tissues.
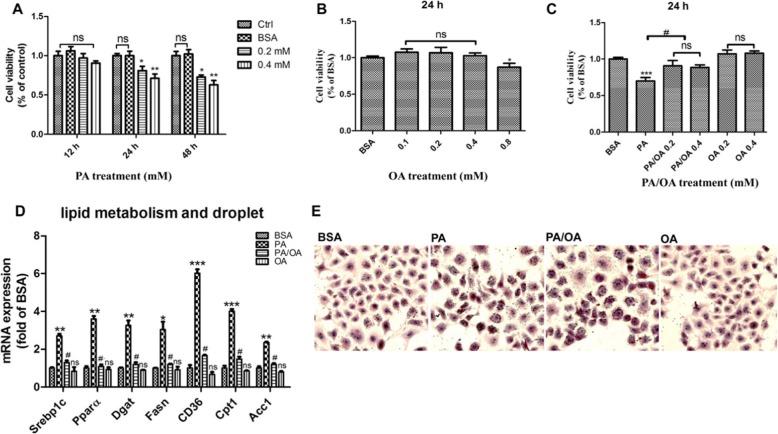
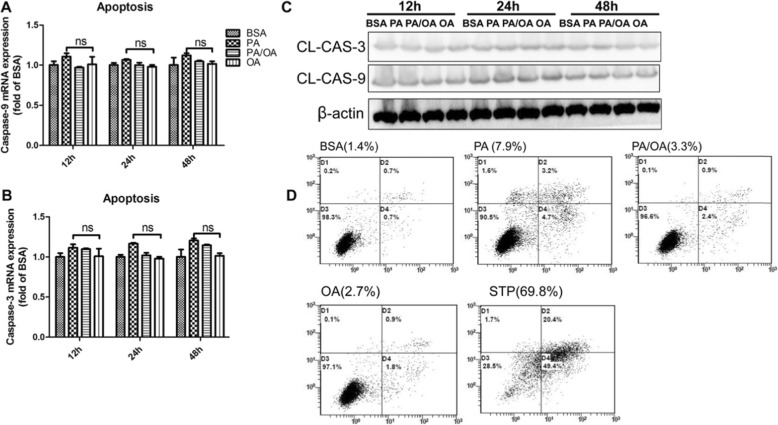
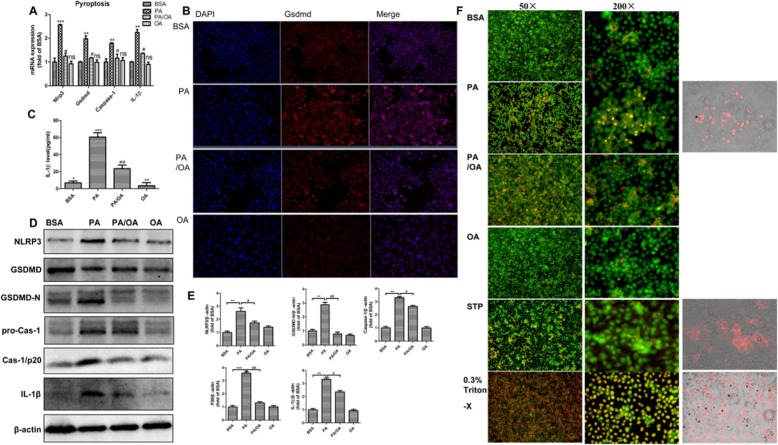
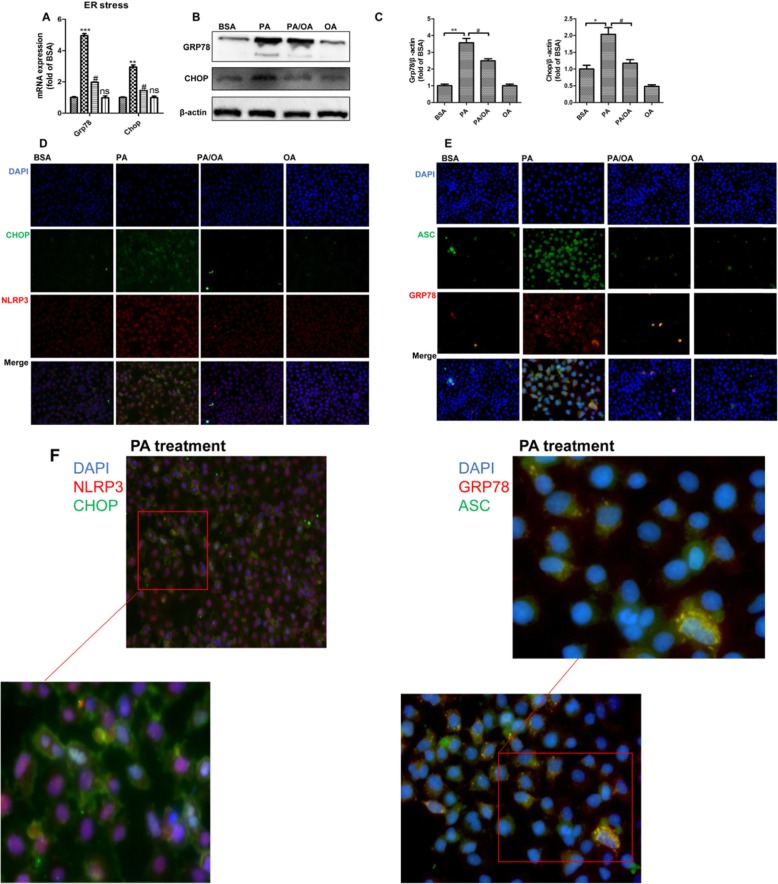
Results: We demonstrated that PA impaired the cell viability and disturbed the lipid metabolism of HepG2 cells (P < 0.01), but OA robustly rescued cells from cell death (P < 0.001). More importantly, we found that instead of cell apoptosis, PA induced significant pyroptosis, evidenced by remarkably increased mRNA and protein expressions of inflammasome marker NLRP3, Caspase-1 and IL-1beta, as well as cell membrane perforation driving protein GSDMD (P < 0.05). Furthermore, we demonstrated that the PA stimulated ER stress was causally related to pyroptosis. The enhanced expressions of ER stress markers CHOP and BIP were found subcellular co-located to pyroptosis markers NLRP3 and ASC. Additionally,TM was able to induce pyroptosis like PA did, and ER stress inhibitor TUDCA was able to inhibit both PA and TM induced ER stress as well as pyroptosis. Furthermore, we demonstrated that OA substantially alleviated either PA or TM induced ER stress and pyroptosis in HepG2 cells (P < 0.01). In vivo, only olive oil supplementation did not cause significant toxicity, while HFD for 32 w obviously induced liver steatosis and inflammation in SD rats (P < 0.05). Half replacement of HFD with olive oil (a mixed diet) has remarkably ameliorated liver abnormalities, and particularly inhibited the protein expressions of either ER stress and pyroptosis markers (P < 0.05).
Conclusion: Palmitic acid induced predominant pyroptosis in HepG2 cells, and ER stress may be responsible for the induction of pyroptosis and subsequent cell death. Monounsaturated oleic acids were able to ameliorate hepatocellular lipotoxicity both in vitro and in vivo, and OA mediated inhibition of ER stress and pyroptosis may be the underlying mechanisms.
Keywords: ER stress; Lipotoxicity; Oleic acid; Palmitic acid; Pyroptosis.
© The Author(s). 2020.
Conflict of interest statement
Competing interestsThe authors declare that they have no competing interests.
Figures
Similar articles
-
Oleic acid protects insulin-secreting INS-1E cells against palmitic acid-induced lipotoxicity along with an amelioration of ER stress.Endocrine. 2019 Jun;64(3):512-524. doi: 10.1007/s12020-019-01867-3. Epub 2019 Feb 18. Endocrine. 2019. PMID: 30778898
-
Oleic acid improves hepatic lipotoxicity injury by alleviating autophagy dysfunction.Exp Cell Res. 2023 Aug 15;429(2):113655. doi: 10.1016/j.yexcr.2023.113655. Epub 2023 May 28. Exp Cell Res. 2023. PMID: 37253404
-
Oleic acid protects saturated fatty acid mediated lipotoxicity in hepatocytes and rat of non-alcoholic steatohepatitis.Life Sci. 2018 Jun 15;203:291-304. doi: 10.1016/j.lfs.2018.04.022. Epub 2018 Apr 27. Life Sci. 2018. PMID: 29709653
-
Pathogenesis of NASH: How Metabolic Complications of Overnutrition Favour Lipotoxicity and Pro-Inflammatory Fatty Liver Disease.Adv Exp Med Biol. 2018;1061:19-44. doi: 10.1007/978-981-10-8684-7_3. Adv Exp Med Biol. 2018. PMID: 29956204 Review.
-
Induction of Hepatoma Cell Pyroptosis by Endogenous Lipid Geranylgeranoic Acid-A Comparison with Palmitic Acid and Retinoic Acid.Cells. 2024 May 9;13(10):809. doi: 10.3390/cells13100809. Cells. 2024. PMID: 38786033 Free PMC article. Review.
Cited by
-
Penthorum chinense Pursh extract ameliorates hepatic steatosis by suppressing pyroptosis via the NLRP3/Caspase-1/GSDMD pathway.Food Sci Nutr. 2024 Apr 16;12(7):5176-5187. doi: 10.1002/fsn3.4165. eCollection 2024 Jul. Food Sci Nutr. 2024. PMID: 39055201 Free PMC article.
-
Can Growth of Nannochloropsis oculata under Modulated Stress Enhance Its Lipid-Associated Biological Properties?Mar Drugs. 2022 Nov 24;20(12):737. doi: 10.3390/md20120737. Mar Drugs. 2022. PMID: 36547884 Free PMC article.
-
Different Metabolism and Toxicity of TRANS Fatty Acids, Elaidate and Vaccenate Compared to Cis-Oleate in HepG2 Cells.Int J Mol Sci. 2022 Jun 30;23(13):7298. doi: 10.3390/ijms23137298. Int J Mol Sci. 2022. PMID: 35806300 Free PMC article.
-
Correction to: Oleic acid ameliorates palmitic acid induced hepatocellular lipotoxicity by inhibition of ER stress and pyroptosis.Nutr Metab (Lond). 2020 Mar 12;17:18. doi: 10.1186/s12986-020-00438-y. eCollection 2020. Nutr Metab (Lond). 2020. PMID: 32190095 Free PMC article.
-
Dose- and Time-Dependent Effects of Oleate on Mitochondrial Fusion/Fission Proteins and Cell Viability in HepG2 Cells: Comparison with Palmitate Effects.Int J Mol Sci. 2021 Sep 10;22(18):9812. doi: 10.3390/ijms22189812. Int J Mol Sci. 2021. PMID: 34575980 Free PMC article.
References
LinkOut - more resources
Full Text Sources
Other Literature Sources
Research Materials
Miscellaneous
