

doi: 10.1038/s41567-019-0749-4.
Epub 2020 Jan 13.
Near-Earth Magnetotail Reconnection Powers Space Storms
Affiliations
- PMID: 32021641
- PMCID: PMC6999787
- DOI: 10.1038/s41567-019-0749-4
Item in Clipboard
Near-Earth Magnetotail Reconnection Powers Space Storms
Nat Phys.
2020.
No abstract available
Figures
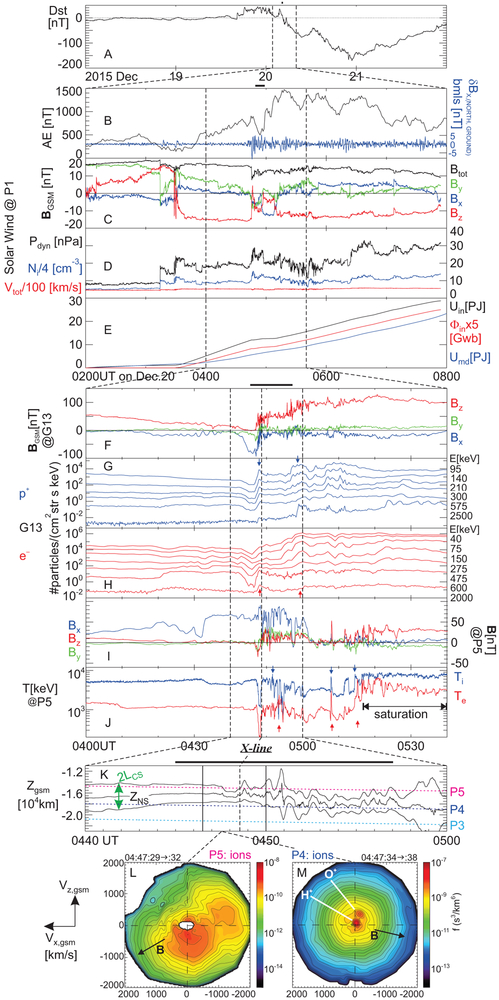
(A) Dst index encompassing several days around the event. (B) AE index (black, left axis scale) and ground magnetometer magnetic pulsations from Bay Mills (bmls), band-pass filtered at 10s-120s (northward component δBX shown, in blue, in the right vertical axis scale; repeated from Fig. 2B for referencing the time of reconnection enhancement around the time of enhancement in pulsation amplitude). (C) Solar wind magnetic field at ARTEMIS P1 in GSM coordinates. In this and all subsequent panels showing vector quantities, black, blue, green and red traces correspond to the vector magnitude, and its X, Y, and Z components, respectively. Note that when not explicitly defined, X,Y, Z components refer to the GSM coordinate system rotated about the ZGSM axis by ~10° to account for the approximate rotation of the field-line planes on THEMIS at that time (M2). (D) Solar wind dynamic pressure, Pdyn (black); density, Ni (blue); velocity magnitude, Vtot (red) also at ARTEMIS P1, showing that the Pdyn increase was due to the Ni increase. (E) Cumulative integrals (M8) of: i) solar wind energy coupling function ε, Uin= ∫εdt (black); ii) flux input rate in the magnetotail by the solar wind electric field Ey,sw, Φin=0.2·40RE·∫Ey,swdt; and iii) magnetospheric energy dissipation rate computed from Dst and AE, Umd (blue).(F) G13 magnetic field components in GSM coordinates; (G) G13 proton fluxes at energies tabulated on the right (increasing flux corresponds to decreasing energy); vertical blue arrows show times of energization; (H) G13 electron fluxes corresponding to the energies tabulated to the right as in (G); vertical red arrows show times of energization; (I) P5 magnetic field components (shown for reference) in X, Y, Z rotated GSM coordinates; (J) ion (Ti) and electron (Te) temperatures at P5 (saturation noted after 05:16UT causes temperatures to be underestimated, but does not affect our conclusions (M4)); vertical blue and red arrows correspond to ion and electron heating, respectively. (K) Estimate of ZGSM location of the neutral sheet, ZNS (middle solid line), and current sheet thickness, LCS (represented by distances of the upper and lower solid lines from the middle one), obtained from Harris sheet model (M6), overplotted along with P3-P5 positions (colored dashed lines); vertical lines are same as in Fig. 2E-J; they correspond to the interval of interest (04:46:30 to 04:50:00UT) encompassing the fast flows (solid lines) and time of the X-line passage (04:48:30UT) by P5 and P4 (dashed line). (L) Representative ion velocity distribution function X-Z plane cut (X is positive to the left) during one spin near the peak tailward reconnection outflows at P5, showing simultaneous reconnection inflows from above the neutral sheet (M5). (M) Same as 1L but at P4, at approximately the same time, showing reconnection inflows from below the neutral sheet (M5).
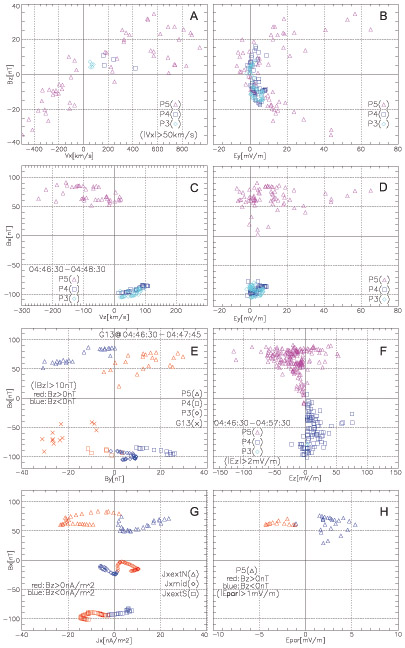
Quantities plotted compactly in Fig. 3 are shown here in raw format, plotted against Bx, or Bz separately to reveal their correlation with these quantities, signifying adherence to expectations from the reconnection paradigm and revealing the full excursion of these quantities, which is obscure in color in Fig. 3. Quantities and units are listed in horizontal axes; Bx or Bz are listed in vertical axes (common for left and right panels). Different symbols correspond to various satellites in A-F and H and to different distances from the neutral sheet in G (as denoted in inserts). Colors, also representing satellites (P5/P4/P3 are magenta/blue/turquoise, respectively) in A-D and F further help differentiate the sources of data. Colors represent sign of Bz (red, blue for Bz<0, >0 respectively) in E, G and H. The time-interval plotted is 04:46:30-04:50:00UT (vertical solid lines in Fig. 2) except for some deviations for Vz, By, and Ez (denoted in the individual panels C, E and F), justified as follows: for Vz (restricted to 04:46:30-04:48:30UT, tailward of the X-line), the earthward side of the plasma sheet expanded lobeward, and the equatorward inflow (Vz) cannot be cleanly separated from outward expansion; for By (at G13 only, restricted to 04:46:30-04:47:45UT), the neutral sheet flapped southward (Extended Data Fig. 1K). and G13 moved closer to the neutral sheet as its ∣Bx∣ was suddenly reduced (Fig. 2E) and all its components became very noisy, presumably as it was immersed in the hot outflows from reconnection – beyond 04:48:30UT the reconnection exhaust moved quickly away from G13 as the X-line moved tailward; and for Ez (extended to 04:46:30-04:57:30UT) the interval is justified by the persistence of the Hall system electric field at P5-3 over the entire interval Δt (subsequent, secondary X-lines result in similar polarity Hall electric field, towards the neutral sheet from both sides). To reduce clutter from random fluctuations, low magnitudes of some quantities have been eliminated for Vx, By, Ez, and E∥, as listed in the respective panels (A, E, F and H).
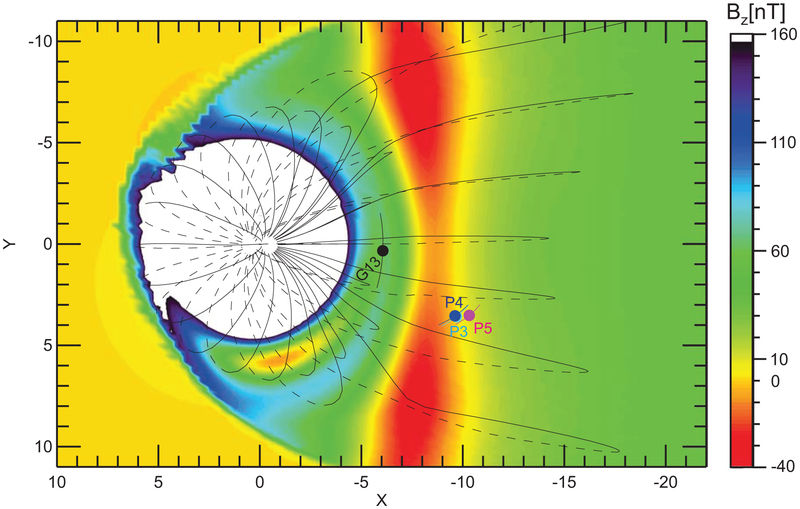
Equatorial Bz profile (color) from the TS04 model15 based on solar wind and Dst values at 04:45UT, with field lines (solid lines: above magnetic equator; dashed: below) and satellite locations from Fig. 1 superimposed (for reference). The magnetic equator in the model was determined as the surface of
reversals, as a function of Z. At the equatorial (X, Y) projections of THEMIS satellites, the model Bz ranges from −2.5 to −7nT.
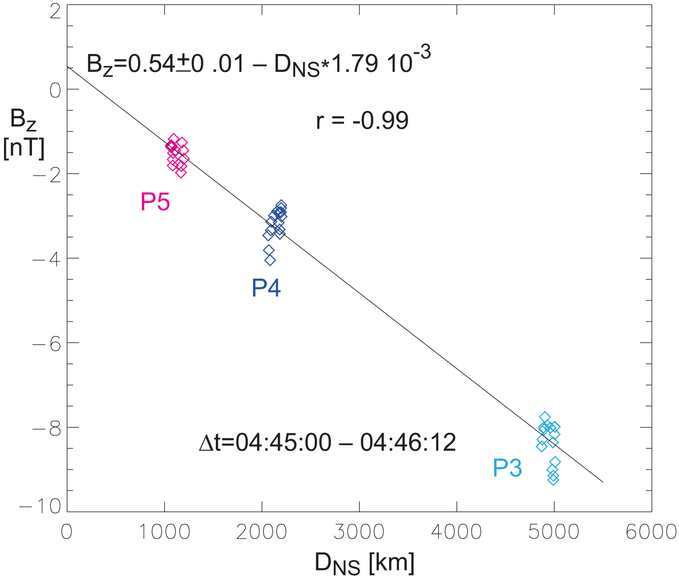
Linear fit to Bz data from THEMIS P5-3 immediately prior to reconnection onset, 04:45:00 – 04:46:12 UT, as a function of their distance DNS from the neutral sheet position, ZNS. The Harris sheet44 model was used to determine ZNS (M6). The inferred equatorial Bz is ~ +0.54nT.
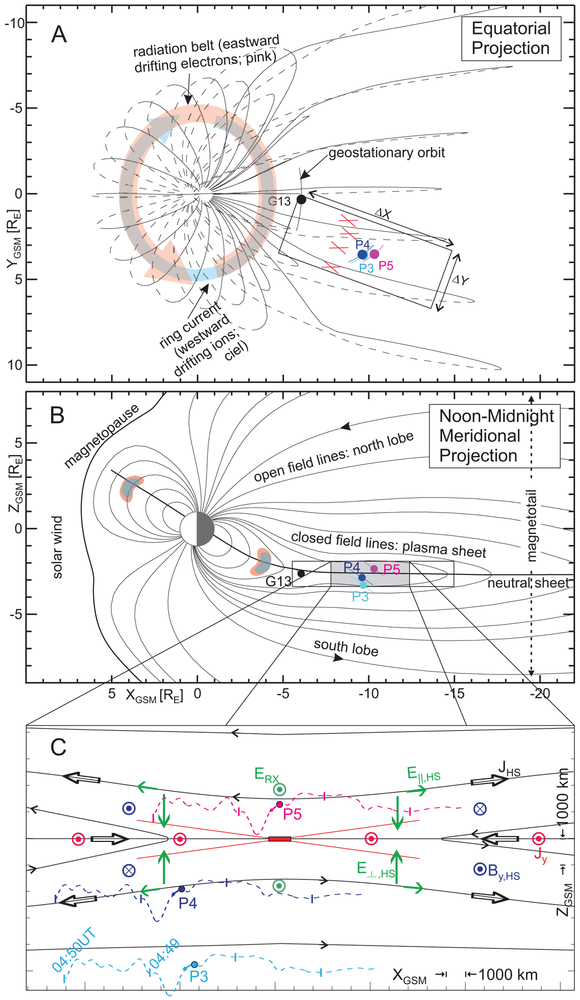
(A) and (B): Equatorial and meridional projections, respectively, of representative field lines from a storm-time magnetic model and satellites (orbit tracks at +/− 1hr) in Geocentric Solar Magnetospheric (GSM) coordinates (M2). In (A), solid lines: above magnetic equator; dashed: below; ΔX-ΔY rectangle: effective area of reconnection inflow region (for size estimate see text and M8), which could host multiple active reconnection sites (red X’s). In (B), magnetopause: envelope of magnetospheric field lines; neutral sheet: surface at which radial field reverses sign. (C) THEMIS P3, P4, and P5 satellites in context of magnetic topology of primary reconnection X-line at the time of its retreat tailward of P5; Hall system current (JHS, black arrows) and its magnetic perturbations (By,HS, blue arrowheads/tails); cross-tail current (Jy, red arrowheads); reconnection electric field (ERX, green arrowheads); and Hall system electric field (E⊥,HS, green equatorward arrows, E∥,HS, green field-aligned arrows). Red central rectangle: electron diffusion region of primary X-line. Dashed lines: (earthward) track of satellites relative to (tailward-) retreating reconnection topology, inferred from retreat speed (−75km/s) and current sheet location and thickness estimates (M6); tick-marks are placed at one minute intervals.
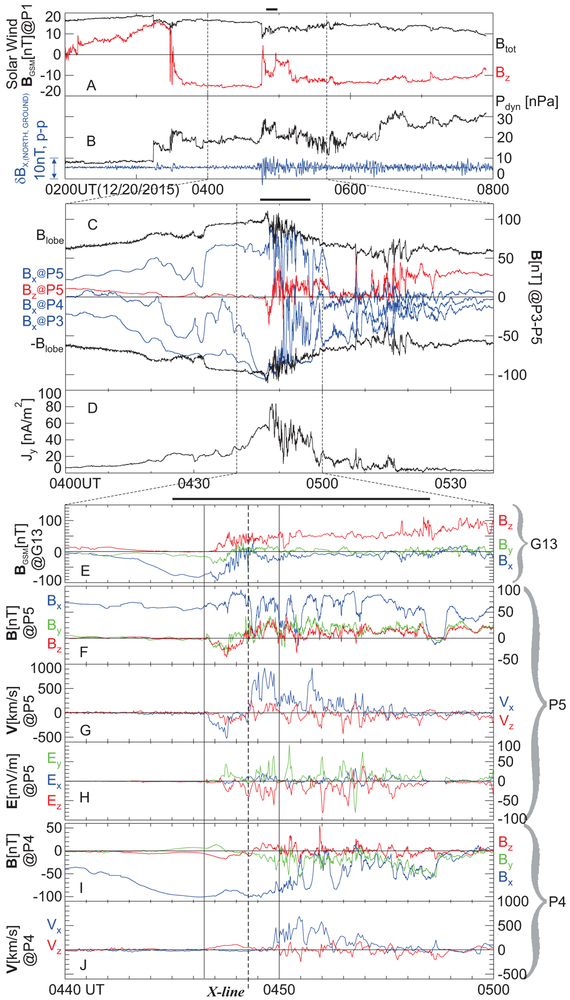
(A) Solar wind total (Btot) and GSM-northward (Bz) component magnetic field at ARTEMIS P1 (M1), located at (X,Y,Z)GSM= (−21, 54, −4)RE. In this and all subsequent panels showing vector quantities, black, blue, green and red traces correspond to the vector magnitude, and its X, Y, and Z components, respectively. (B) Solar wind dynamic pressure, Pdyn (black) at ARTEMIS P1, and X (northward) component ground magnetometer magnetic pulsations (variations) at Bay Mills (bmls), band-pass filtered with a 10s-120s window (δBX,(NORTH,GROUND)). (C) Magnetic field Bx at P3, P4 and P5; Bz at P5 only; and +/− Blobe (total field in the lobe) inferred from total plasma pressure at P5 assumed to be in pressure balance with the lobe (magnetic) pressure, overplotted for comparison with Bx. Note that when not explicitly defined, X,Y, Z components refer to the GSM coordinate system rotated about the ZGSM axis by ~10° to account for the approximate rotation of the field-line planes on THEMIS at that time (M2). (D) Cross-tail current density (Jy) between THEMIS satellites (M6). (E) G13 magnetic field, BGSM, in the GSM-proper frame; (F) P5 magnetic field, B; (G) P5 ion velocity V components: Vx, which is in the approximate reconnection outflow direction (+X), and Vz, which is parallel to the approximate inflow direction (±Z); (H) P5 measured electric field, E; (I) P4 magnetic field, B; (J) P4 ion velocity X and Z components, as at P5, in (G), above.
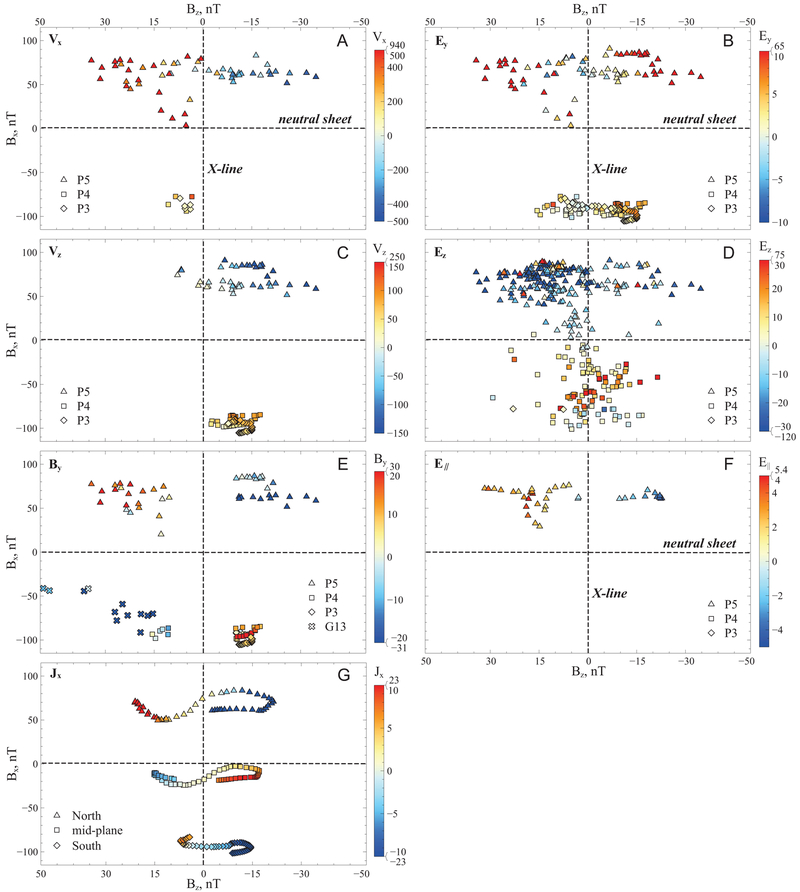
P3, P4, P5 and G13 data, in GSM coordinates for G13 or GSM coordinates rotated by ~10° about the ZGSM axis, to account for the approximate rotation of the field-line planes on THEMIS at that time (M2), obtained from the time period surrounding the X-line passage past THEMIS, plotted in Bz-Bx space. (Per reconnection geometry depicted in Fig. 1C, Bz positive/negative denotes the region earthward/tailward of X-line, respectively, while Bx positive/negative denotes the region above/below the neutral sheet, respectively.) Quantities plotted in color in each panel are: the X- and Y-directed ion velocity Vx, Vy in (A), and (C) respectively; the Y- and Z-directed measured electric field Ey, Ez in (B) and (D) respectively; the measured electric field parallel to the magnetic field E∥ in (F); the Y-directed magnetic field in (E) and the X-directed electrical current, Jx, in (G) inferred from magnetic field data (M7). Color scales for all panels are saturated to better depict the quantities plotted. A different representation of the same data (not color coded) showing the full range of the quantities and their correlation with Bx or Bz is in Extended Data Fig. 2. The time interval plotted is 04:46:30 to 04:50:00UT (vertical solid lines in Fig. 2) except for small deviations for Vz, By, and Ey, (C, E, and D), which are listed in the respective panels in Extended Data Fig. 2 (2C, 2E and 2F). To reduce clutter by random fluctuations, low magnitudes of quantities have been eliminated for Vx, By, Ez, and E∥, (A, E, D, and F, respectively) and those restrictions are also listed in the respective panels in Extended Data Fig. 2 (2A, 2E, 2F, and 2H).
References
-
- Gonzales WD, et al. , What is a geomagnetic storm? J. Geophys. Res, 99, 5771–5791, doi: 10.1029/93JA02867 (1994). - DOI
-
- Gonzalez WD, et al. , Solar wind-magnetosphere coupling during intense magnetic storms (1978–1979), J. Geophys. Res, 94, 8835–8851, doi: 10.1029/JA094iA07p08835 (1989). - DOI
-
- Dungey JW, Interplanetary magnetic field and the auroral zones, Phys. Rev. Lett, 6, 47–48, doi: 10.1103/PhysRevLett.6.47 (1961). - DOI
-
- Akasofu S–I, Energy coupling between the solar wind and the magnetosphere, Space Sci. Rev, 28, 121–190, doi: 10.1007/BF00218810 (1981). - DOI
Grants and funding
LinkOut - more resources
Full Text Sources