. 2019:7:155584-155600.
doi: 10.1109/ACCESS.2019.2949577. Epub 2019 Oct 25.

MCADNNet: Recognizing Stages of Cognitive Impairment through Efficient Convolutional fMRI and MRI Neural Network Topology Models

Affiliations

MCADNNet: Recognizing Stages of Cognitive Impairment through Efficient Convolutional fMRI and MRI Neural Network Topology Models

Saman Sarraf et al. IEEE Access. 2019.

Abstract

Mild cognitive impairment (MCI) represents the intermediate stage between normal cerebral aging and dementia associated with Alzheimer's disease (AD). Early diagnosis of MCI and AD through artificial intelligence has captured considerable scholarly interest; researchers hope to develop therapies capable of slowing or halting these processes. We developed a state-of-the-art deep learning algorithm based on an optimized convolutional neural network (CNN) topology called MCADNNet that simultaneously recognizes MCI, AD, and normally aging brains in adults over the age of 75 years, using structural and functional magnetic resonance imaging (fMRI) data. Following highly detailed preprocessing, four-dimensional (4D) fMRI and 3D MRI were decomposed to create 2D images using a lossless transformation, which enables maximum preservation of data details. The samples were shuffled and subject-level training and testing datasets were completely independent. The optimized MCADNNet was trained and extracted invariant and hierarchical features through convolutional layers followed by multi-classification in the last layer using a softmax layer. A decision-making algorithm was also designed to stabilize the outcome of the trained models. To measure the performance of classification, the accuracy rates for various pipelines were calculated before and after applying the decision-making algorithm. Accuracy rates of 99.77% 0.36% and 97.5% 1.16% were achieved for MRI and fMRI pipelines, respectively, after applying the decision-making algorithm. In conclusion, a cutting-edge and optimized topology called MCADNNet was designed and preceded a preprocessing pipeline; this was followed by a decision-making step that yielded the highest performance achieved for simultaneous classification of the three cohorts examined.

Keywords: Alzheimer’s disease; Brain; Classification; Deep learning; MCI; Structural and Functional Magnetic Resonance Imaging.


Figures

Fig. 1.
Fig. 1.
MCADNNet is a unique and optimized topology that simultaneously recognizes MCI, AD, NC participants in MRI and fMRI data. The architecture includes three layers of convolution (Grey-Blue layers) including 10, 20 and 50 filters of 5×5, as well as three Max Pooling layers (Black-Blue layers). MCADNNet ends with two fully connected layers of 500 and two hidden neurons (Black layers) followed by a softmax function (Blue layer). In both cases of MRI and fMRI, the first layer receives 56×56 images, the closest dimension to preprocessed images enabling the architecture to extract more details from the images. Also, compared to the DeepAD model, the 3-layer MCADNNet extracts more hierarchical features that result in high performance of multi-class recognition.
Fig. 2.
Fig. 2.
Top: Training process in one of the fMRI experiments for DeepAD (left) and MCADNNet (right) architectures indicate the models that produce a very high performance of classification. The random initiation at the zeroth epoch was above one, which dropped dramatically after the first iterations (can occur due to Caffe DIGITS implementation). The model converged in the first iterations due to utilizing high-volume, aggressively-preprocessed fMRI data. The final accuracy rate achieved from this MCADNNet model (utilized in this visualization) was 92.35% in the subject-level experience before decision making, while the accuracy rate was 90.76% from the DeepAD model trained and tested by the same dataset.Bottom: Training processes for MCADNNet against structural MRI data (right) and DeepAD (left) architecture were figured. The random initialization of loss values began above one and dramatically dropped after the first epoch. Additionally, the slight fluctuation in the loss of training datasets explains the impact of SGD as a randomly-selected block of data was injected into the network in order to train the model. The highest accuracy rate achieved was 95.44% from MCADNNet and 94.80% from DeepAD against a given MRI testing dataset.
Fig. 3.
Fig. 3.
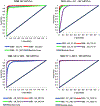
ROC Curves show the performance of classification for the trained models. In this study, the ROC and AUC indicate classification was accurately performed and each curve representing an experiment was very far from the random guess in the binary classification tasks where the structural and functional MRI data were used for training both DeepAD and MCADNNet architectures. The figure top-left shows the performance of MCADNNet for binary classification including fMRI testing data (AD/NC, AD/MCI, NC/MCI). As mentioned in the discussion of the structural MRI preprocessing pipeline, four Gaussian kernels including σ=0, 2, 3, and 4 mm were utilized. The performance of binary classification for MRI testing data is shown in Figure 3 (top-right, bottom-left, and bottom-right) for AD/NC, AD/MCI and NC/MCI (and different Gaussian kernels used for smoothing). The ROC curves show that all the binary classifications provide high performance as they are extremely close to the upper left corner of the plot.
Fig. 4.
Fig. 4.
Confusion matrices for simultaneously classifying MCI, AD and NC classes through MCADNNet architecture were extracted indicating the quality of prediction for the three classes. As seen, in most cases including both fMRI and MRI, the performance of classification (prediction) was very high for classes specifying that the trained models were unbiased to any of three classes. However, in the fMRI experiment, the highest score belonged to MCI class and the lowest prediction scores were obtained from the normal brains, confirming that MCI is the early stage of the dementia. In structural MRI, the highest accuracy rate belonged to the MCI group and interestingly the highest error rate also occurred in recognizing AD from MCI, revealing the fact of structural similarity between certain brain regions in AD and MCI groups. However, in the MRI classification experiment, the number of samples utilized in training and validation was significantly smaller than fMRI methods (3D vs 4D data) that also played an important role in the model convergence in the early epochs as well as in the performance of classification. This figure shows the normalized confusion matrices for fMRI and MRI experiments for AD vs NC vs MCI multi-class classification. The top-left figure shows the performance of classification for fMRI testing data. All accuracy rates for three classes are located in the diagonal of the confusion matrix; the rates are 97%, 88%, and 90%, respectively, for AD, NC, and MCI.
Fig. 5.
Fig. 5.
Structural MRI AD, MCI, and NC Features are visualized through MCADNNent Conv. layer 1 ,2 and 3. The hierarchical features extracted by convolutional layers have opened new avenues to investigate the brain structure and function. We aimed to classify three classes of brains, so called NC, which is the blue framed group at left. The MCI is green framed group in the middle and Alzheimer’s brains are the red framed group at right. When the performance of classification in CNN-based experiment is fairly high, the features extracted by various CNN layers can be utilized for other analyses. One randomly selected sample from each of three classes was used and passed through the prediction module of the final trained version of MCADNNet. The features extracted from each CNN layer were visualized and shown above.
Fig. 6.
Fig. 6.
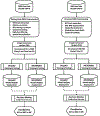
fMRI and MRI Pipelines. In this work, we designed a new CNN-based topology to predict NC, MCI and AD using functional and structural MRI data. The new topology contains three layers of CNNs in which the efficient parameters were utilized. Furthermore, a decision-making algorithm was developed to stabilize the results from the deep learning engine.

References

    1. Reisberg B, Ferris SH, Kluger A, Franssen E, Wegiel J, and De Leon MJ, “Mild cognitive (mci): a historical perspective,” International Psychogeriatrics, vol. 20, no. 1, pp. 18–31, 2008. - PubMed
    1. Tampi RR, Tampi DJ, Chandran S, Ghori A, and Durning M, “Mild cognitive: A comprehensive review,” Healthy Aging Research, vol. 4, pp. 1–11, 2015.
    1. Petersen RC, Stevens JC, Ganguli M, Tangalos EG, Cummings J, and DeKosky S, “Practice parameter: early detection of dementia: mild cognitive (an evidence-based review): report of the quality standards subcommittee of the american academy of neurology,” Neurology, vol. 56, no. 9, pp. 1133–1142, 2001. - PubMed
    1. Luck T, Luppa M, Briel S, and Riedel-Heller SG, “Incidence of mild cognitive: a systematic review,” Dementia and geriatric cognitive disorders, vol. 29, no. 2, pp. 164–175, 2010. - PubMed
    1. Jean L, Bergeron M.-v., Thivierge S, and Simard M, “Cognitive intervention programs for individuals with mild cognitive: systematic review of the literature,” The American Journal of Geriatric Psychiatry, vol. 18, no. 4, pp. 281–296, 2010. - PubMed

LinkOut - more resources