. 2020 Mar 19;31(7):640-654.
doi: 10.1091/mbc.E19-09-0509. Epub 2020 Feb 5.

A mechanism for neurofilament transport acceleration through nodes of Ranvier

Affiliations

A mechanism for neurofilament transport acceleration through nodes of Ranvier

Maria-Veronica Ciocanel et al. Mol Biol Cell. .

Abstract

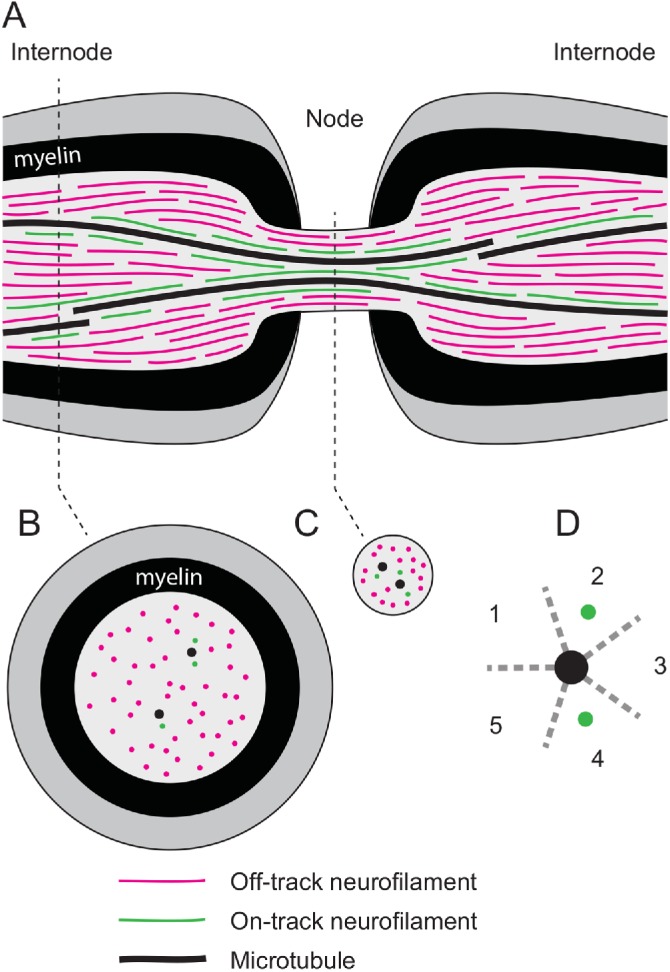
Neurofilaments are abundant space-filling cytoskeletal polymers in axons that are transported along microtubule tracks. Neurofilament transport is accelerated at nodes of Ranvier, where axons are locally constricted. Strikingly, these constrictions are accompanied by sharp decreases in neurofilament number, no decreases in microtubule number, and increases in the packing density of these polymers, which collectively bring nodal neurofilaments closer to their microtubule tracks. We hypothesize that this leads to an increase in the proportion of time that the filaments spend moving and that this can explain the local acceleration. To test this, we developed a stochastic model of neurofilament transport that tracks their number, kinetic state, and proximity to nearby microtubules in space and time. The model assumes that the probability of a neurofilament moving is dependent on its distance from the nearest available microtubule track. Taking into account experimentally reported numbers and densities for neurofilaments and microtubules in nodes and internodes, we show that the model is sufficient to explain the local acceleration of neurofilaments within nodes of Ranvier. This suggests that proximity to microtubule tracks may be a key regulator of neurofilament transport in axons, which has implications for the mechanism of neurofilament accumulation in development and disease.


Figures

FIGURE 1:
FIGURE 1:
Schematic of a node of Ranvier along a myelinated axon. (A) Longitudinal section through the node and flanking internodes. Neurofilaments switch between on-track (green) and off-track (magenta) states. On-track neurofilaments are engaged with microtubule tracks (black) and move along those tracks in a rapid, intermittent, and bidirectional manner. Off-track neurofilaments are disengaged from their microtubule tracks and may get pushed aside, pausing for prolonged periods before reengaging and resuming movement. To move on track, off-track neurofilaments must diffuse laterally until they encounter a microtubule. (B) Cross-sectional view of the internode. (C) Cross-sectional view of the node. Note that most microtubules run continuously through the node from one internode to the next, whereas most neurofilaments terminate on one side of the node, resulting in far fewer neurofilaments in the node than in the flanking internodes. Also note that these polymers are packed more densely in the node. Collectively, these differences cause the average distance between neurofilaments and microtubules to be less in the node than in the flanking internodes. (D) View of one microtubule in cross-section (black) with two on-track neurofilaments (green). Owing to spatial constraints, each microtubule track is considered to accommodate up to five “lanes” of traffic (numbered 1–5 and separated by dashed gray lines), that is, a maximum of five neurofilaments at one time (Lai et al., 2018).
FIGURE 2:
FIGURE 2:
Diagram of the six-state kinetic model of neurofilament transport. There are four on-track states (a, a0, r, r0) and two off-track states (ap, rp). On-track neurofilaments move along microtubules in an anterograde or retrograde direction (states a and r, respectively) with velocities vaand vr. The anterograde movements are powered by kinesin motors and the retrograde movements by dynein motors. When in the on-track moving states, the filaments can switch to on-track pausing states a0 and r0, governed by the rate γ10. When in the on-track pausing states, the filaments can either switch back to their respective on-track moving states, at the rate γ01, or switch to the corresponding anterograde and retrograde off-track pausing states ap or rp. Cycling between the on and off-track pausing states is governed by the rates γoff and γon. Reversals in direction can happen in all pausing states, governed by the reversal rate constants, γar and γra. Adapted from Li et al. (2012).
FIGURE 3:
FIGURE 3:
(A) Average total (black) and average on-track (states a, a0, r, r0, green) neurofilament content plotted vs. axon length at three time points during an internode simulation (neurofilament number averaged per axonal bin over 10 simulations). Five stochastic realizations of the total neurofilament content are displayed in blue. (B) Histogram of the average total neurofilament content (averaged for all bins over 10 simulations) at three time points during the same internode simulation; the red curve is the Gaussian fit to each distribution.
FIGURE 4:
FIGURE 4:
Evolution of mean velocity (left) and on-rate γon (right) with time for a simulation with no node (internode simulation). The mean velocity is calculated by averaging the velocity of all the neurofilaments within each bin (Eq. 10), followed by averaging over all bins in the axonal domain. The dashed lines correspond to the average mean velocity over a 10-h period.
FIGURE 5:
FIGURE 5:
(A) Average total (black) and average on-track (green) neurofilament content (neurofilament number averaged per axonal bin over 10 simulations) plotted vs. axon length at three time points during a simulation with a nodal constriction 10 μm in length. Five stochastic realizations of the total neurofilament content are displayed in blue. (B) Plots of the corresponding axon cross-sectional areas (blue, Eq. 3) vs. axon length.
FIGURE 6:
FIGURE 6:
(A) Modulation of the mean velocity (governed by Eqs. 6 and 7 and averaged over a 3-h window) along the axon for five stochastic realizations (blue) at three time points during a simulation of neurofilament transport across a 10-μm node. The black lines represent the average of 10 simulations. (B) Modulation of the corresponding mean on-rates (governed by Eqs. 2 and 8) along the axon for the same stochastic simulations.
FIGURE 7:
FIGURE 7:
(A) Cartoon of a node simulation showing our definitions of the neurofilament content ratio (ratio between neurofilament content in the internode and node) and the “sharpness” of the nodal constriction (the depth of the node divided by its length). (B) Plot of the evolution of the neurofilament content ratio from the start of a simulation, calculated using the neurofilament content at the middle location of the node for one of the simulations illustrated in Figure 5.
FIGURE 8:
FIGURE 8:
(A) Total neurofilament content at the last time point (day 3) in a node simulation, plotted against distance along the axon, for three different average neurofilament lengths. The neurofilaments were assigned lengths drawn from an exponential distribution with mean lengths of 5, 10, and 20 μm. (B) The same data as shown in A replotted with a narrower range on the x-axis to better show the shape of the curves in the vicinity of the node. (C) Dependence of the content ratio, calculated using neurofilament content at the middle of the node and averaged over 3 d of simulation, on the mean neurofilament length distribution. (D) Dependence of the predicted nodal sharpness, D/L (see Figure 7A), on the mean neurofilament length.
FIGURE 9:
FIGURE 9:
(A) Total neurofilament content at the last time point (day 3) in a node simulation, plotted against distance along the axon, for simulations with different ratios of total neurofilaments to microtubules in the axonal window. (B) The same data shown in A replotted with a narrower range on the x-axis to better show the shape of the curves in the vicinity of the node. (C) Dependence of the neurofilament content ratio, calculated at the middle of the node and averaged over the last 2 d of the simulations, on the ratio of neurofilaments to microtubules.
FIGURE 10:
FIGURE 10:
(A) Cartoon of a fluorescence photoactivation pulse-escape experiment. A population of neurofilaments within an activation window is photoactivated (orange), and the fluorescence decay due to the departure of neurofilaments from the activation window is recorded over time. The decay kinetics reflect the moving and pausing behavior of the filaments (Li et al., 2014). (B) Comparison of the pulse-escape decay kinetics in our simulations (dashed lines) with our experimental data (solid lines) on contiguous nodes (orange) and internodes (blue) of myelinated axons in mouse tibial nerves (data from Walker et al., 2019). As described in Model, the activation window length was 5 μm (Walker et al., 2019) and neurofilament lengths were drawn from a distribution with average length of 5.5 μm (minimum = 1 μm, maximum = 43 μm; Fenn et al., 2018). The error bars for the experimental data represent the SD about the mean at each time point.

Similar articles

Cited by

References

    1. Alami NH, Jung P, Brown A. (2009). Myosin Va increases the efficiency of neurofilament transport by decreasing the duration of long-term pauses. J Neurosci , 6625–6634. - PMC - PubMed
    1. Batchelor GK. (1970). Slender-body theory for particles of arbitrary cross-section in Stokes flow. J Fluid Mech , 419–440.
    1. Berthold CH. (1978). Morphology of normal peripheral axons. In: Physiology and Pathobiology of Axons, ed. Waxman SG, New York: Raven Press, 3–63.
    1. Brown A. (2014). Slow axonal transport. In: Reference Module in Biomedical Sciences, ed. Caplan M, Elsevier.
    1. Brown A. (2015). Axonal transport. In: Neuroscience in the 21st Century: From Basic to Clinical, 2nd ed., ed. Pfaff DW, Volkow ND, New York: Springer Publishing, 333–379.

Publication types

LinkOut - more resources