

doi: 10.7326/M20-0358.
Epub 2020 Feb 5.
Reporting, Epidemic Growth, and Reproduction Numbers for the 2019 Novel Coronavirus (2019-nCoV) Epidemic
Affiliations
- PMID: 32023340
- PMCID: PMC7077751
- DOI: 10.7326/M20-0358
Item in Clipboard
Reporting, Epidemic Growth, and Reproduction Numbers for the 2019 Novel Coronavirus (2019-nCoV) Epidemic
Ann Intern Med.
.
No abstract available
Figures
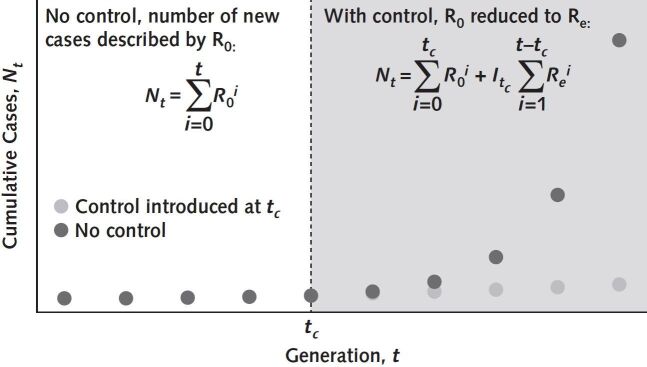
Estimation of cumulative cases with and without implementation of control measures. Serial interval is the average time between cases in a chain of transmission and is used to calculate the number of generations in an epidemic (time since epidemic start ÷ serial interval duration). In the absence of control measures, the total number of cases after t serial intervals depends on R0 (the number of new cases created by an index case in a completely susceptible population in the absence of intervention) and the number of epidemic generations (left-hand equation). Introduction of control is assumed to reduce the reproduction number to Re. The last generation with uncontrolled growth is indicated by tc, with an incident case count of Itc, and we can use the right-hand equation to calculate case numbers in the presence of control. The difference between the 2 curves shows the effect of introducing control measures vs. continued epidemic growth
without control. R0 = basic reproduction number; Re = effective reproduction number.
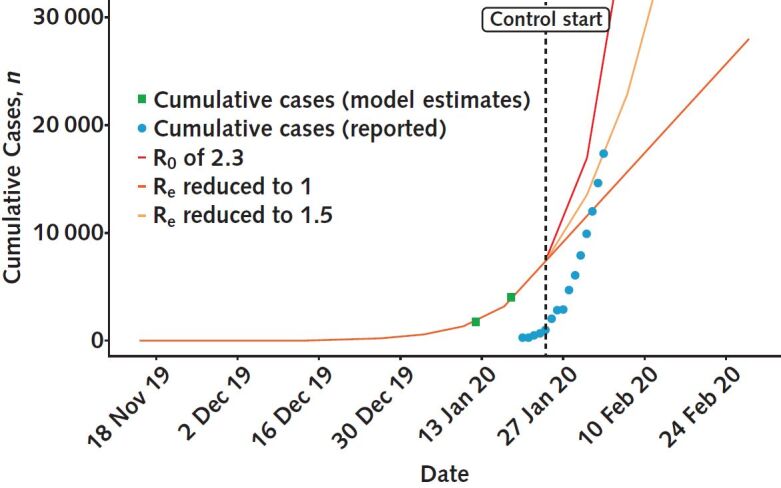
Simulated epidemic trajectories and reported cumulative case counts for 2019-nCoV. The initial growth of the epidemic is based on introduction of the pathogen in mid-November 2019, with R0 = 2.3 and a serial interval of 7 d. The model reproduces estimates of case counts based on volume of internationally exported cases (green squares) (4). Daily cumulative counts of virologically confirmed cases are based on publicly available reports (blue circles) (1, 2). Case counts reported on 3 February 2020 are not compatible with reduction of Re to 1 but could be compatible with reduction to 1.5. If control is achieved, reported case counts will intersect horizontally with the contour lines on this graph. When reported cases move beyond contours vertically, the reproduction numbers represented by those contours become implausible. 2019-nCoV = 2019 novel
coronavirus; R0 = basic reproduction number; Re = effective reproduction number.
References
-
- BNO News. Tracking coronavirus: map, data and timeline. 2 February 2020. Accessed at https://bnonews.com/index.php/2020/02/the-latest-coronavirus-cases. on 3 February 2020.
-
- China Centers for Disease Control. Distribution of pneumonia in a new coronavirus infection. 2020. Accessed at http://2019ncov.chinacdc.cn/2019-nCoV. on 3 February 2020.
-
- Imai N, Cori A, Dorigatti I, et al. Report 3: transmissibility of 2019-nCoV. 25 January 2020. Accessed at www.imperial.ac.uk/mrc-global-infectious-disease-analysis/news--wuhan-co.... on 25 January 2020.
MeSH terms
LinkOut - more resources
Full Text Sources