. 2020 Mar 20;9(3):576-589.
doi: 10.1021/acssynbio.9b00448. Epub 2020 Feb 17.

Development of High-Performance Whole Cell Biosensors Aided by Statistical Modeling

Development of High-Performance Whole Cell Biosensors Aided by Statistical Modeling

Adokiye Berepiki et al. ACS Synth Biol. .

Abstract

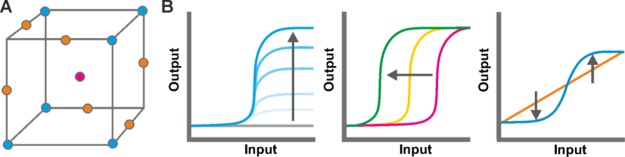
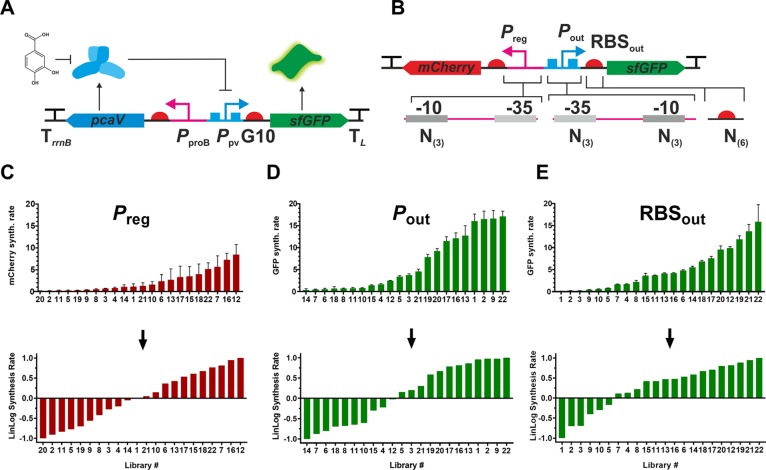
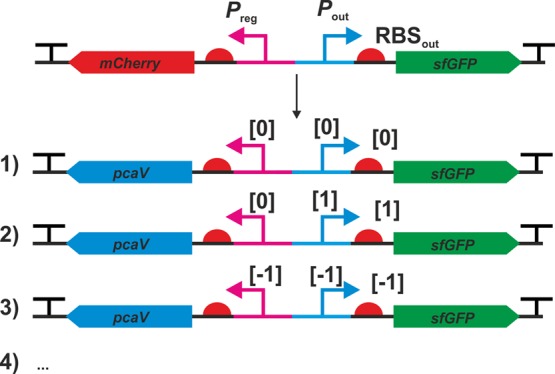
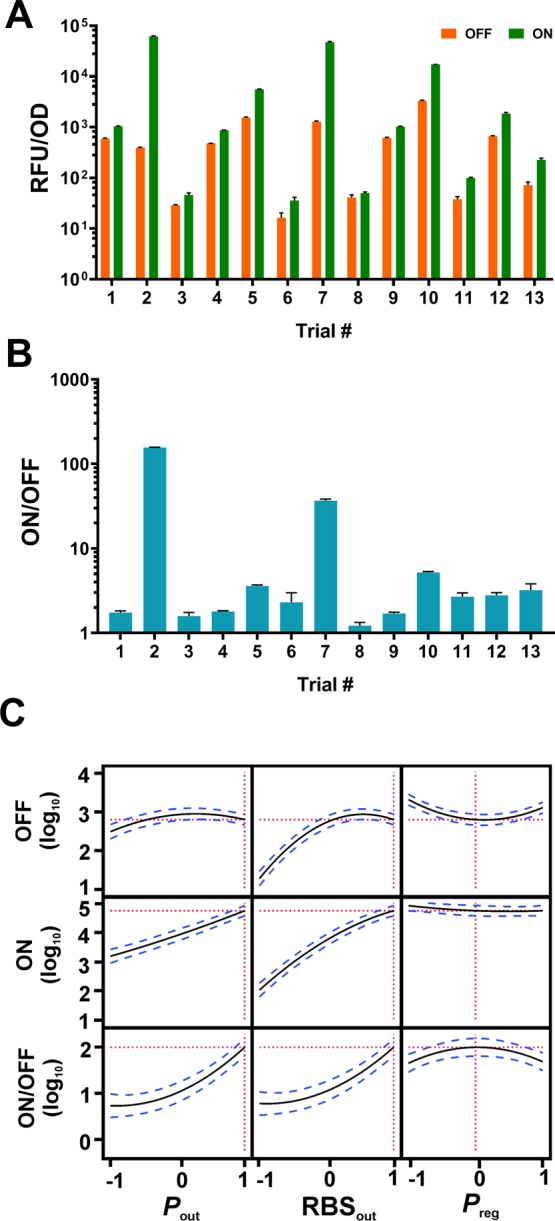
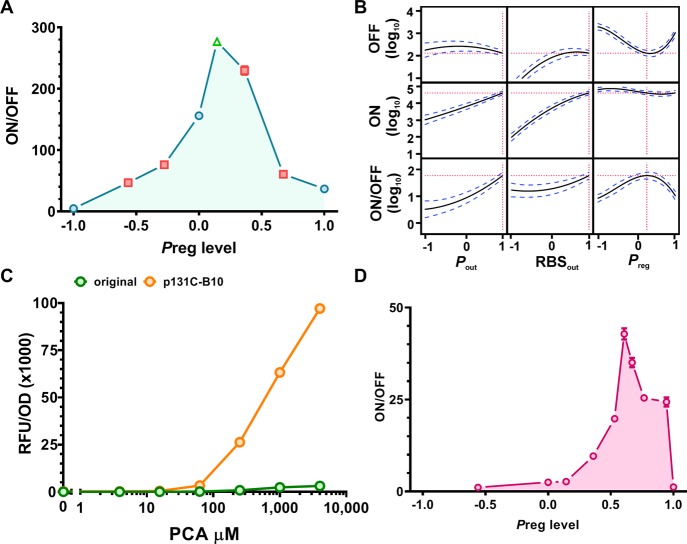
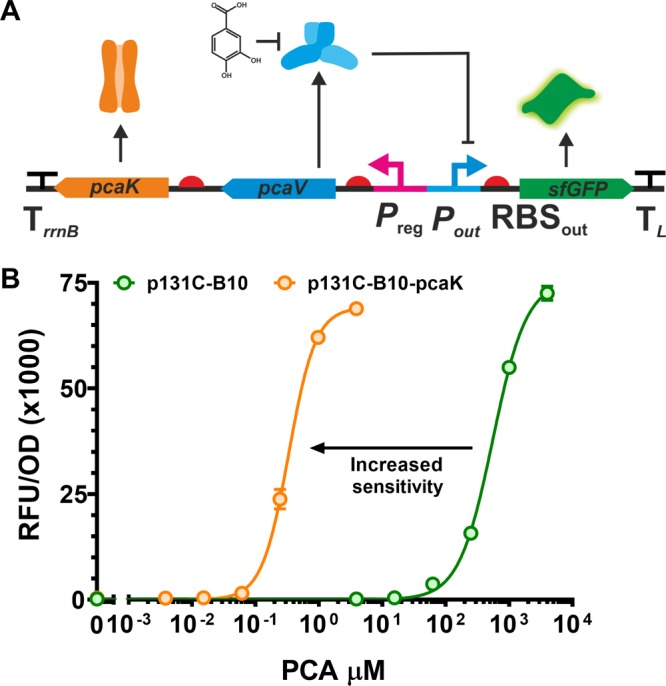
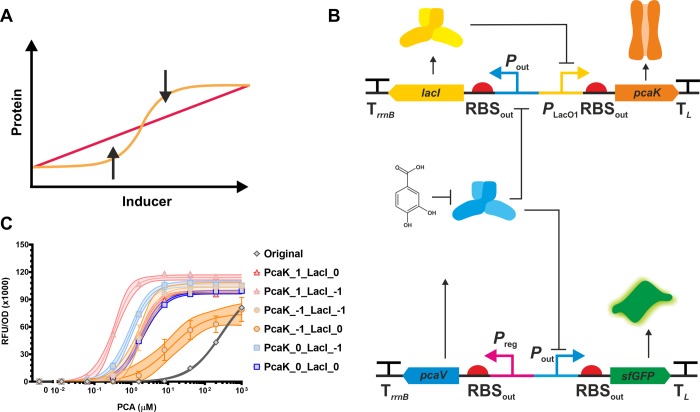
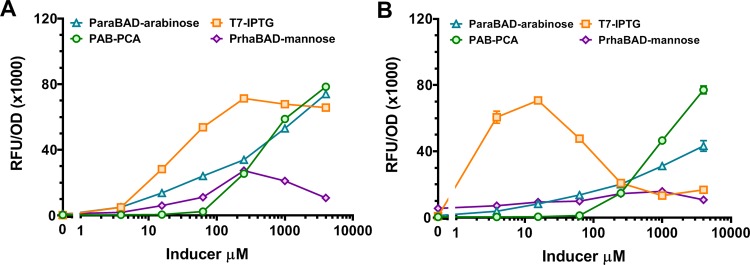
Whole cell biosensors are genetic systems that link the presence of a chemical, or other stimulus, to a user-defined gene expression output for applications in sensing and control. However, the gene expression level of biosensor regulatory components required for optimal performance is nonintuitive, and classical iterative approaches do not efficiently explore multidimensional experimental space. To overcome these challenges, we used a design of experiments (DoE) methodology to efficiently map gene expression levels and provide biosensors with enhanced performance. This methodology was applied to two biosensors that respond to catabolic breakdown products of lignin biomass, protocatechuic acid and ferulic acid. Utilizing DoE we systematically modified biosensor dose-response behavior by increasing the maximum signal output (up to 30-fold increase), improving dynamic range (>500-fold), expanding the sensing range (∼4-orders of magnitude), increasing sensitivity (by >1500-fold), and modulated the slope of the curve to afford biosensors designs with both digital and analogue dose-response behavior. This DoE method shows promise for the optimization of regulatory systems and metabolic pathways constructed from novel, poorly characterized parts.

Keywords: definitive screening design; design of experiments; ferulic acid; protocatechuic acid; whole cell biosensors.


Conflict of interest statement

The authors declare no competing financial interest.

Figures

Figure 1
Figure 1
Application of design of experiments (DoE) to modulate biosensor dose response curves. (A) An experiment can be considered as a point in multidimensional space. DoE is a statistical tool that enables the proper exploration of experimental space to understand and optimize biology. (B) Modulation of biosensor dose response curves by increasing maximum output in the ON state while minimizing output in the OFF state (vertical extension; left), increasing sensitivity (middle), and conversion of a digital response to an analogue one (horizontal extension; right).
Figure 2
Figure 2
Configuration of PCA biosensor and construction of promoter and RBS libraries. (A) The PCA biosensor consists of the PcaV repressor, which binds to the PPV promoter controlling sfGFP expression. In the presence of PCA the system is derepressed. (B) The genetic elements regulating expression of the system components were renamed as shown and mutated with degenerate oligonucleotides to make individual libraries. pcaV was substituted with mCherry to facilitate library screening. (C–E) Transcriptional (C, D) and translational activity (E) of library variants assessed by fluorescent protein synthesis rate (upper panels). Synthesis rates were transformed into logarithmically scaled values (lower panels) and “levels” for DoE were set at −1, 0, and +1.
Figure 3
Figure 3
Genetic configuration of biosensor designs conforming to definitive screening design. Following library construction pcaV was reinstalled to create a functioning biosensor and regulatory elements were cloned at the appropriate levels. Three out of 13 constructs are shown, and the full table can be found in Table 1.
Figure 4
Figure 4
Experimental trials and statistical modeling. (A) GFP fluorescence for PCA biosensor variants in the ON state (1 mM PCA; green bars) and OFF state (no PCA; orange bars). (B) The dynamic range for PCA biosensor variants (ON/OFF). Error bars represent the standard deviation of three biological replicates. Each experiment was repeated a minimum of two times and typical results are shown. (C) Prediction profile of standard least-squares regression model based on experimental data.
Figure 5
Figure 5
Optimization of PCA biosensor and effect of copy number. (A) The level of aTF was tuned to determine optimal dynamic range. Shown is the dynamic range (ON/OFF) for the PCA biosensor when induced with 1 mM PCA with Preg set at different levels. The blue circles represent the initial trials, the red squares represent the first iteration with Preg set at different levels and the green triangle represents the final iteration of Preg level. (B) Prediction profile of standard least-squares regression model based on data from new trials. (C) Comparison of original PCA biosensor with the optimized version (p131C–B10) in an end point assay. Cells were induced with varying concentration of PCA for 3 h at 37 °C then measured for GFP fluorescence. (D) Performance of PCA biosensor when present as one-copy in the genome. The level of repressor was tuned to determine optimal dynamic range when present as a single copy. Shown is the dynamic range (ON/OFF) for the PCA biosensor when induced with 1 mM PCA with Preg set at different strengths. Error bars represent the standard deviation of three biological replicates. Each experiment was repeated a minimum of two times and typical results are shown.
Figure 6
Figure 6
Increasing the sensitivity of the PCA biosensor. (A) The pcaK gene from Pseudomonas putida was inserted downstream of the Preg promoter and strong G10 RBS (+1) and pcaV. (B) The expression of a high-affinity, PCA permease leads to a reduction in EC50 of the PCA biosensor, as shown here. We observed a shift of the dose response curve to the left when pcaK is expressed (orange), compared to the p131C–B10 biosensor (green). Error bars represent the standard deviation of three biological replicates.
Figure 7
Figure 7
Extending biosensor linear range through transport modulation. (A) Biosensors with analogue dose–responses have application in protein engineering as they allow more accurate identification of enzyme variants with improved function. To this end we designed a regulatory network to convert the digital-like dose response to an analogue output. (B) This circuit consists of a PcaV repressed Pout::lacI, which in turn repress pcaK expression. In the presence of high concentrations of PCA LacI is produced, leading to restricted pcaK expression, reducing ligand uptake, which ultimately reduces sfGFP output. Without PCA, lacI expression is repressed, pcaK is induced, leading to increased PCA uptake and accumulation inside the cell, thus increasing derepression of sfGFP expression. (C) Six variants of the dose–response extender circuit were designed and tested. The variants have different strength RBSs upstream of the lacI (−1, 0) and pcaK (−1, 0, +1). Expression testing under different concentrations of PCA show the different dose response performance of the construct variants. Error bars represent the standard error of three biological replicates, and the area fill denotes the 95% confidence interval for the fitted curve.
Figure 8
Figure 8
Benchmarking of PCA biosensor with popular inducible expression systems. (A,B) The PCA biosensor (p131C–B10; green circles) was tested against three common expression systems—T7 RNAP/IPTG (pET44-sfGFP; orange squares), ParaBAD/arabinose (pBAD-sfGFP; blue triangles), and PrhaBAD/mannose (pCK302; purple diamonds)—in an end point assay. Cells were induced with varying concentrations of inducers for 3 h (A) and 24 h (B) at 37 °C then measured for GFP fluorescence. Error bars represent the standard deviation of three biological replicates. Each experiment was repeated a minimum of two times, and typical results are shown.
Figure 9
Figure 9
Optimization of a FA biosensor. (A) Schematic representation of a refactored FA biosensor. The FerC aTF (orange) represses sfGFP (green) expression by regulating the PLC2 promoter. The FerA enzyme (purple) metabolizes the sensed chemical ferulic acid into the ligand effector feruloyl-CoA, which binds to FerC derepressing sfGFP. (B) Dynamic range (ON/OFF) of the 9 DoE variants of the FA biosensor, in the first iteration, set with combinations of promoter strength levels of the FerC regulator (PregC at levels −1, 0, +1) and the FerA enzyme (PenzA at levels −1, 0, +1). (C) Performance of the 3 additional DoE variants of the FAB in the second iteration. The best variant of the first iteration pFABs9, PregC/PenzA/RBSout levels +1/+1/+1 (green circles), was compared to a group of new variants that had RBSout set at decreasing levels while the level of both PregC and PenzA was fixed at +1: pFABsG21, PregC/PenzA/RBSout levels +1/+1/+0.94 (red diamonds); pFABsG19, PregC/PenzA/RBSout levels +1/+1/+0.89 (orange triangles); and pFABsG12, PregC/PenzA/RBSout levels +1/+1/+0.81 (blue hexagons). The fluorescent signal (RFU/OD) is shown for the induction with increasing concentrations of ferulic acid. (D) The dynamic range (ON/OFF) is shown for the signal ratio of the variants at ON induced state (presence of ferulic acid at 1 mM) or OFF uninduced state (absence of ferulic acid). Error bars represent the standard deviation of three biological replicates.

References

    1. Ang J.; Harris E.; Hussey B. J.; Kil R.; McMillen D. R. (2013) Tuning response curves for synthetic biology. ACS Synth. Biol. 2, 547–567. 10.1021/sb4000564. - DOI - PMC - PubMed
    1. De Paepe B.; Peters G.; Coussement P.; Maertens J.; De Mey M. (2017) Tailor-made transcriptional biosensors for optimizing microbial cell factories. J. Ind. Microbiol. Biotechnol. 44, 623–645. 10.1007/s10295-016-1862-3. - DOI - PubMed
    1. Lim H. G.; Jang S.; Jang S.; Seo S. W.; Jung G. Y. (2018) Design and optimization of genetically encoded biosensors for high-throughput screening of chemicals. Curr. Opin. Biotechnol. 54, 18–25. 10.1016/j.copbio.2018.01.011. - DOI - PubMed
    1. Shi S.; Ang E. L.; Zhao H. (2018) In vivo biosensors: mechanisms, development, and applications. J. Ind. Microbiol. Biotechnol. 45, 491–516. 10.1007/s10295-018-2004-x. - DOI - PubMed
    1. Liu D.; Evans T.; Zhang F. (2015) Applications and advances of metabolite biosensors for metabolic engineering. Metab. Eng. 31, 35–43. 10.1016/j.ymben.2015.06.008. - DOI - PubMed

Publication types

MeSH terms