. 2020 Mar 11;20(3):1499-1509.
doi: 10.1021/acs.nanolett.9b03483. Epub 2020 Feb 10.

Sugar-Nanocapsules Imprinted with Microbial Molecular Patterns for mRNA Vaccination

Affiliations

Sugar-Nanocapsules Imprinted with Microbial Molecular Patterns for mRNA Vaccination

Sejin Son et al. Nano Lett. .

Abstract

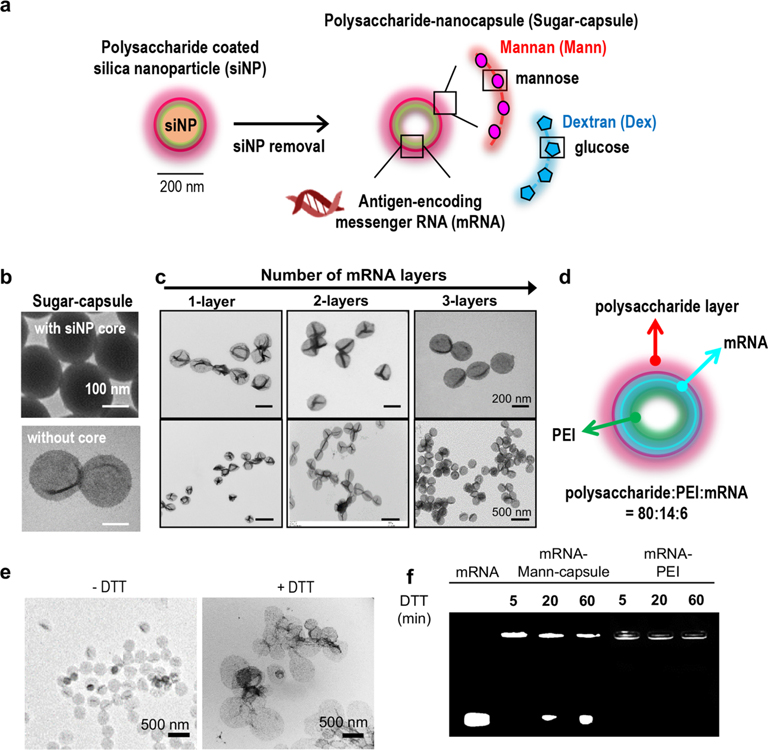
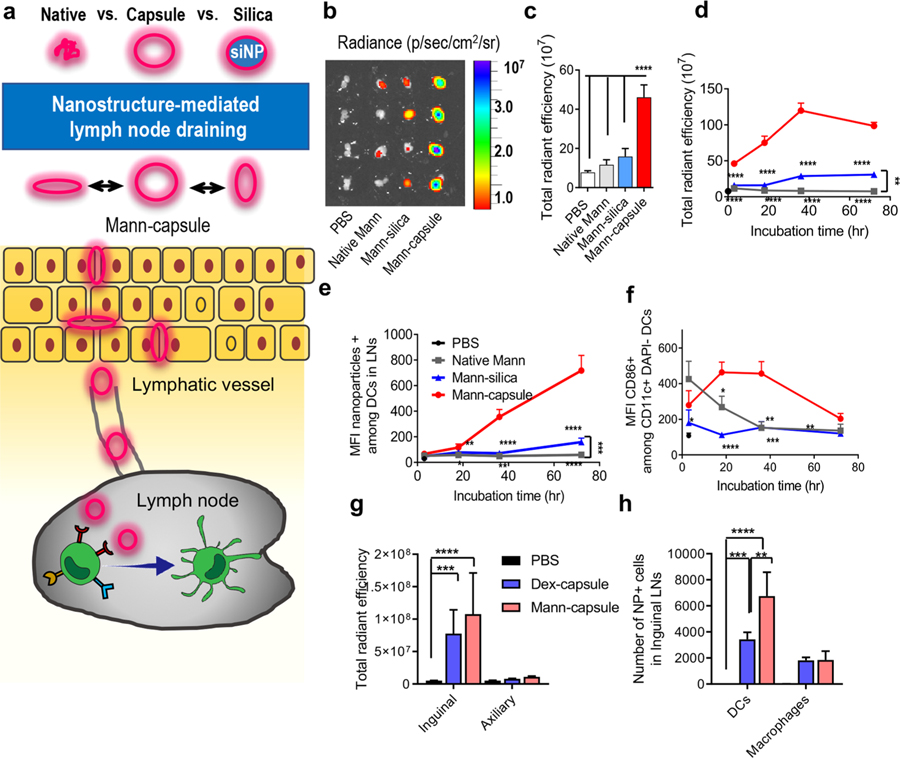
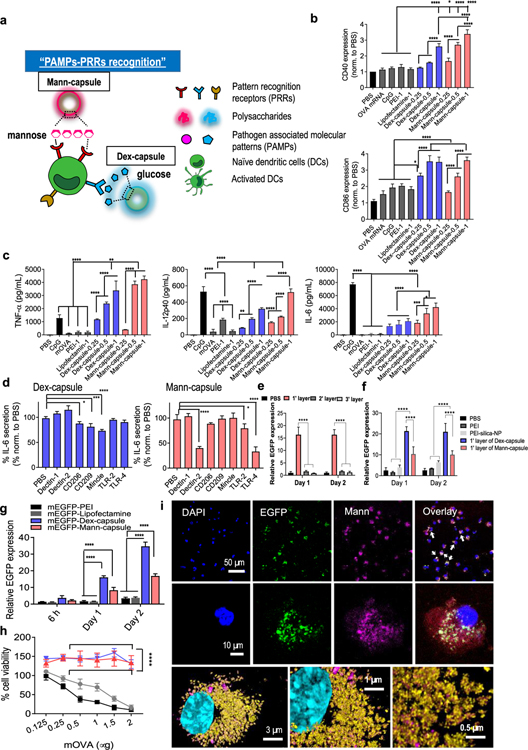
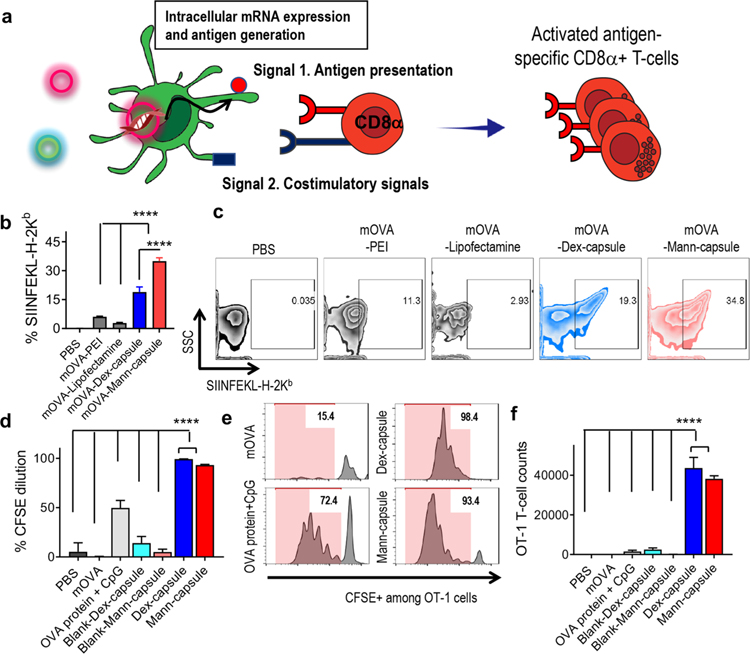
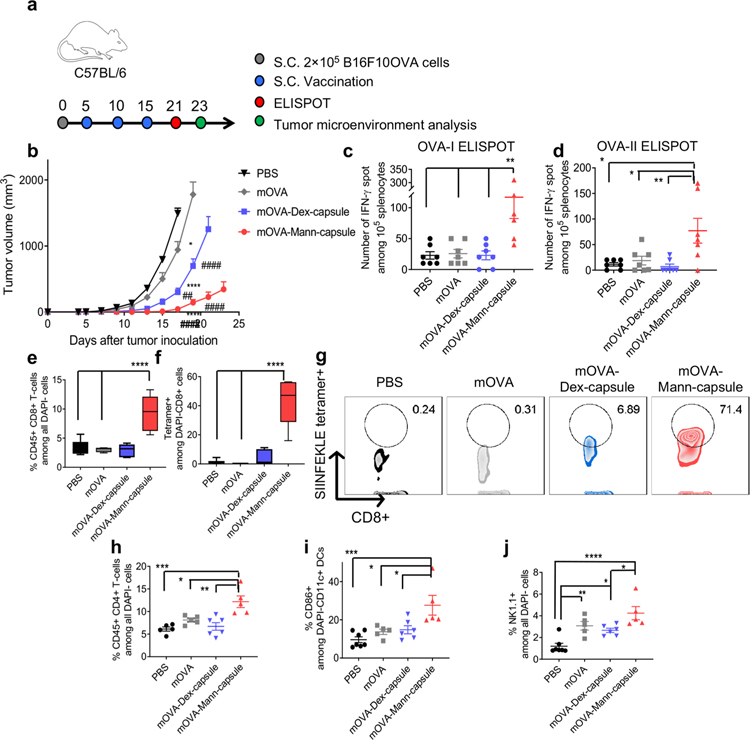
Innate immune cells recognize and respond to pathogen-associated molecular patterns. In particular, polysaccharides found in the microbial cell wall are potent activators of dendritic cells (DCs). Here, we report a new class of nanocapsules, termed sugar-capsules, entirely composed of polysaccharides derived from the microbial cell wall. We show that sugar-capsules with a flexible polysaccharide shell and a hollow core efficiently drain to lymph nodes and activate DCs. In particular, sugar-capsules composed of mannan (Mann-capsule) carrying mRNA (mRNA) promote strong DC activation, mRNA translation, and antigen presentation on DCs. Mann-capsules elicit robust antigen-specific CD4+ and CD8α+ T-cell responses with antitumor efficacy in vivo. The strategy presented in this study is generally applicable for utilizing pathogen-derived molecular patterns for vaccines and immunotherapies.

Keywords: dendritic cell; mRNA; nanoparticle; polysaccharide; vaccine.


Conflict of interest statement

The authors declare the following competing financial interest(s): O.C.F. has financial interest in Selecta Biosciences, Tarveda Therapeutics, and Seer.

Figures

Figure 1.
Figure 1.
(a) Schematic illustration of synthesis of mRNA-loaded sugar-capsules. (b) TEM images of sugar-capsules before (top) and after (bottom) removal of a core silica nanoparticle. (c) TEM images of sugar-capsules with multilayered mRNA loading at high (top) and low (bottom) magnification. (d) Illustration of an mRNA-sugar-capsules with the weight ratio of components. (e, f) Evaluation of redox-responsive degradability of sugar-capsules. (e) TEM images of Mann-capsules and (f) agarose gel image of mRNA-Mann-capsules or mRNA-PEI after DTT treatment.
Figure 2.
Figure 2.
(a) Sugar-capsules with a hollow core efficiently drain to LNs after subcutaneous administration. (b–f) C57BL/6 mice were administered s.c. with Mann-Cy5.5 formulated as native Mann, Mann-silica, or Mann-capsules. (b) Draining inguinal LNs were imaged and quantified for Cy5.5 signal by IVIS at (c) 3 h postinjection or (d) over time at 3, 18, 36, and 72 h post injections. Mean fluorescence intensity (MFI) of (e) Mann-Cy5.5+ cells and (f) MFI of CD86 signal among CD11c+ DCs in inguinal LNs was measured over time by flow cytometric analysis. (g, h) C57BL/ 6 mice were administered s.c. with either Dex-capsules or Mann-capsules tagged with Cy5.5 and assessed for (g) the total radiant efficiency of Cy5.5 signal in the excised inguinal and axillary LNs by IVIS and (h) the number of capsule+ DCs and macrophages within inguinal LNs at 15 h postinjection. The data show means ± s.e.m. Statistical significance was calculated by (c,g,h) one-way ANOVA or (d–f) two-way ANOVA, followed by the Bonferroni multiple comparisons post-test. *P < 0.05, **P < 0.01, ***P < 0.001, and ****P < 0.0001.
Figure 3.
Figure 3.
(a) Schematic illustration of the engagement and activation of DCs by Mann- or Dex-capsules. (b) Expression levels of CD40 (top) and CD86 (bottom) costimulatory signals and (c) secretion of pro-inflammatory TNF-α, IL-12p40, and IL-6 from BMDCs incubated with indicated formulations. (d) Secretion of IL-6 was measured after incubating sugar-capsules with BMDCs in the presence of blocking antibodies against various PRRs. (e–g) Evaluation of mRNA translation by quantifying EGFP signal after incubating BMDCs with various mEGFP formulations. We (e) varied the number of LbL layers for Dex-capsules and (f, g) compared Dex- and Mann-capsules to control groups. (i) Confocal microscopy images of BMDCs incubated with mEGFP-Mann-capsules. Nuclear DAPI (blue), EGFP (green), and Mann-Cy5.5-capsule (pink) are shown at various magnifications. (h) Cytotoxicity was measured after incubating BMDCs with a varying amount of mOVA-sugar-capsules. The data show means ± s.e.m. Statistical significance was calculated by (b–d) one-way ANOVA or (e, g) two-way ANOVA, followed by the Bonferroni multiple comparisons post-test. *P < 0.05, **P < 0.01, ***P < 0.001, and ****P < 0.0001.
Figure 4.
Figure 4.
(a) Schematic illustration of antigen presentation and cross-priming of CD8a+ T-cells mediated by mRNA-loaded sugar-capsules. (b, c) BMDCs were incubated with mOVA formulated with either PEI, lipofectamin, Dex-capsules, or Mann-capsules, and (b) the frequency of DCs presenting SIINFEKL-H-2Kb complex with (c) the representative scatter plots are shown. (d–f) CFSE-labeled OT-I CD8α+ T-cells were cultured with BMDCs pulsed with various mOVA formulations, and (d) CFSE dilution, (e) the representative histograms, and (f) the number of expanded OT-1 CD8α+ T-cells were quantified by flow cytometric analyses. The data show means ± s.e.m. Statistical significance was calculated by one-way ANOVA, followed by the Bonferroni multiple comparisons post-test. ****P < 0.0001.
Figure 5.
Figure 5.
Antitumor efficacy of mOVA-loaded sugar-capsules. (a) C57BL/6 mice were inoculated with B16F10OVA cells at the right s.c. flank on day 0 and treated with the indicated formulations on days 5, 10, and 15. (b) Tumor growth was measured over time, and splenocytes were analyzed by ELISPOT on day 21 for (c) OVA-I-specific CD8α+ T-cells and (d) OVA-II-specific CD4 T-cells. (e–j) Tumors were analyzed by flow cytometry on day 23. Shown are the frequency of (e) CD8a+ T-cells, (f) OVA-specific CD8a+ T-cells, and (g) their representative scatter plots. Also, the frequency of (h) CD4+ T-cells, (i) CD86+CD11c+ DCs, and (j) NK1.1+ natural killer cells within the tumor microenvironment. The data show means ± s.e.m. Statistical significance was calculated by (b) two-way ANOVA or (c–j) one-way ANOVA, followed by the Bonferroni multiple comparisons post-test. *P < 0.05, **P < 0.01, ***P < 0.001, and ****P < 0.0001. * and # in part b indicate statistical differences compared with PBS and mOVA, respectively.

References

    1. Banchereau J; Steinman RM Dendritic cells and the control of immunity. Nature 1998, 392 (6673), 245–52. - PubMed
    1. Mogensen TH Pathogen recognition and inflammatory signaling in innate immune defenses. Clin. Microbiol. Rev 2009, 22 (2), 240–73. - PMC - PubMed
    1. Ozinsky A; Underhill DM; Fontenot JD; Hajjar AM; Smith KD; Wilson CB; Schroeder L; Aderem A The repertoire for pattern recognition of pathogens by the innate immune system is defined by cooperation between toll-like receptors. Proc. Natl. Acad. Sci. U. S. A 2000, 97 (25), 13766–71. - PMC - PubMed
    1. Nam J; Son S; Park KS; Zou W; Shea LD; Moon JJ Cancer nanomedicine for combination cancer immunotherapy. Nature Reviews Materials 2019, 4 (6), 398–414.
    1. Han X; Shen S; Fan Q; Chen G; Archibong E; Dotti G; Liu Z; Gu Z; Wang C Red blood cell-derived nanoerythrosome for antigen delivery with enhanced cancer immunotherapy. Sci. Adv 2019, 5 (10), No. eaaw6870. - PMC - PubMed

Publication types

MeSH terms