. 2020 Feb 4;30(5):1478-1490.e6.
doi: 10.1016/j.celrep.2019.11.040.

Oct4-Mediated Inhibition of Lsd1 Activity Promotes the Active and Primed State of Pluripotency Enhancers

Affiliations

Oct4-Mediated Inhibition of Lsd1 Activity Promotes the Active and Primed State of Pluripotency Enhancers

Lama AlAbdi et al. Cell Rep. .

Abstract

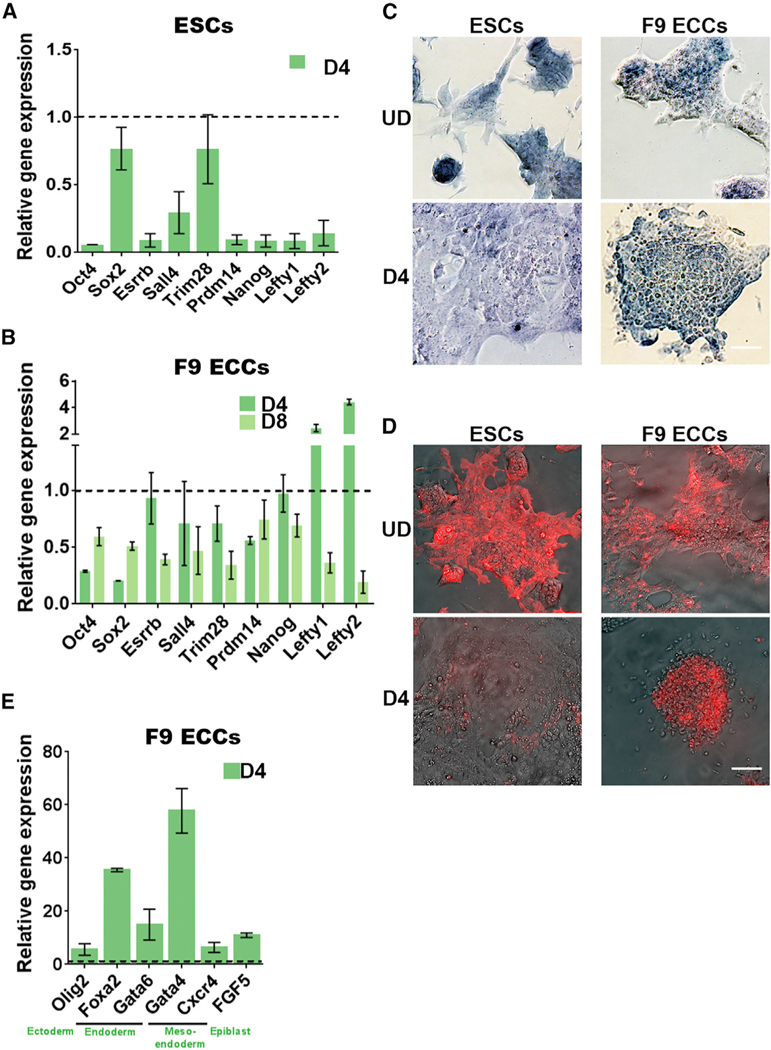
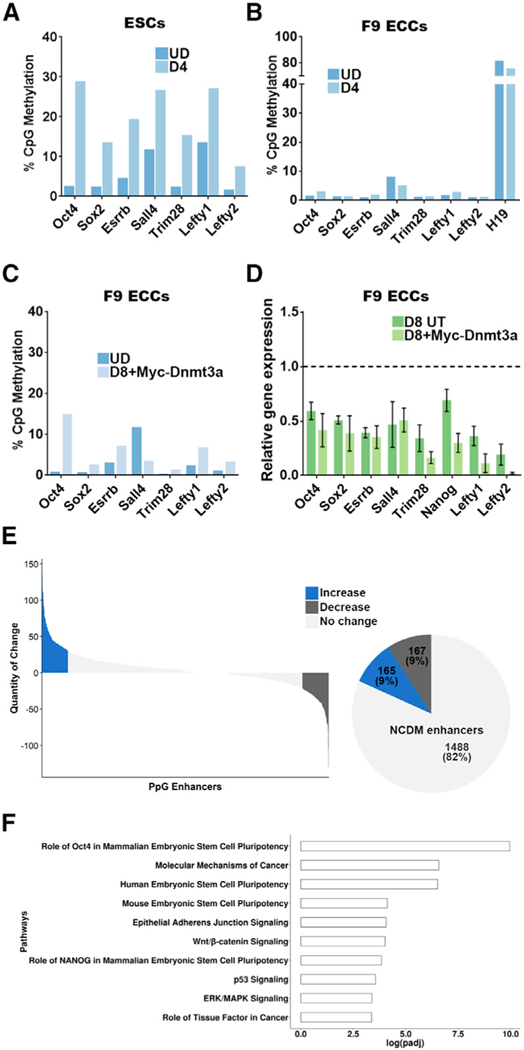
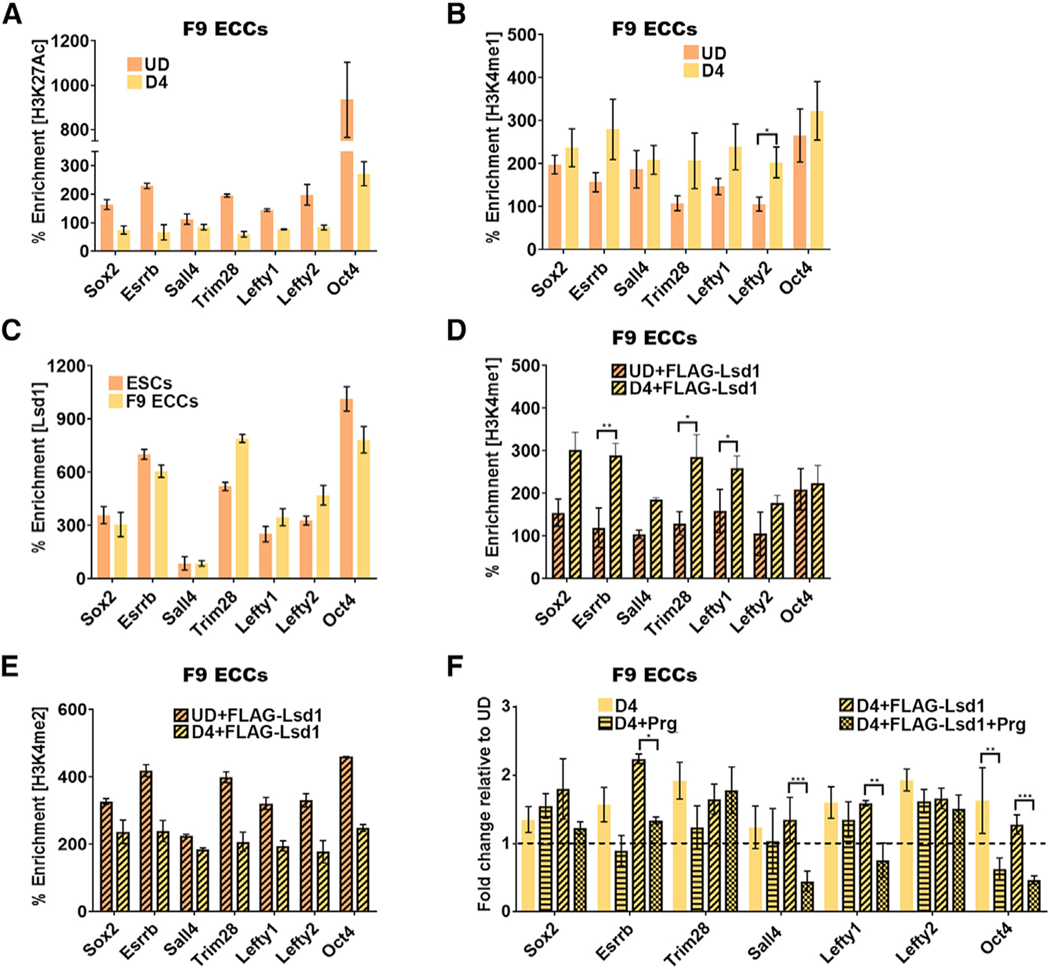
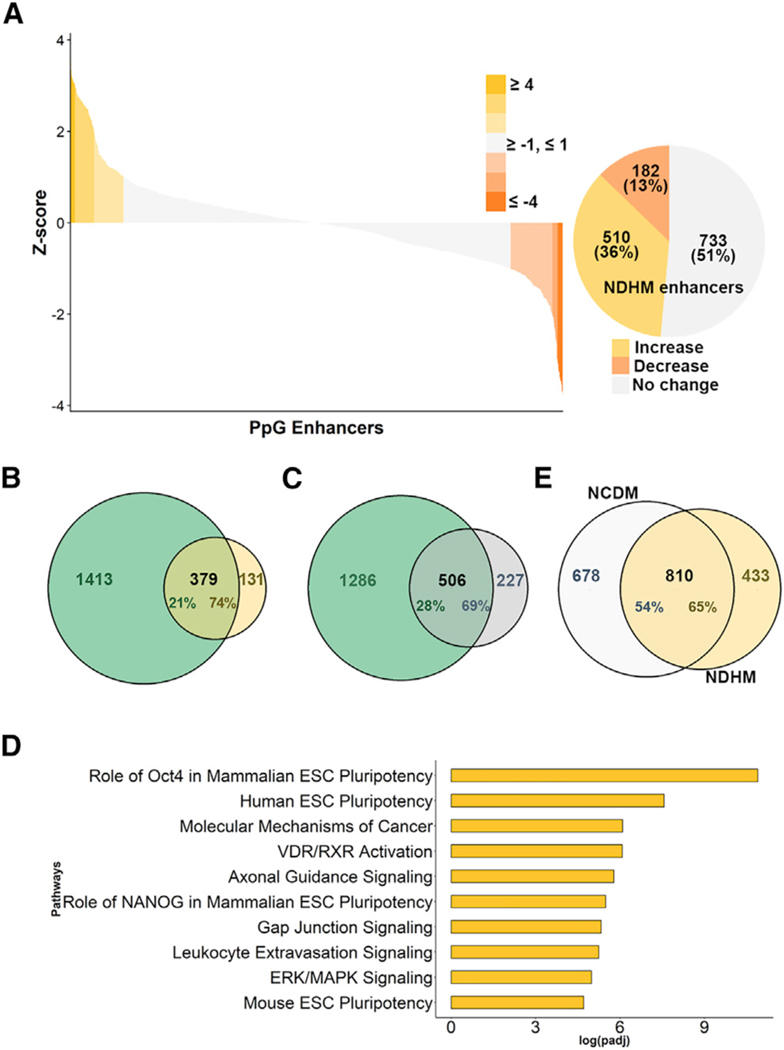
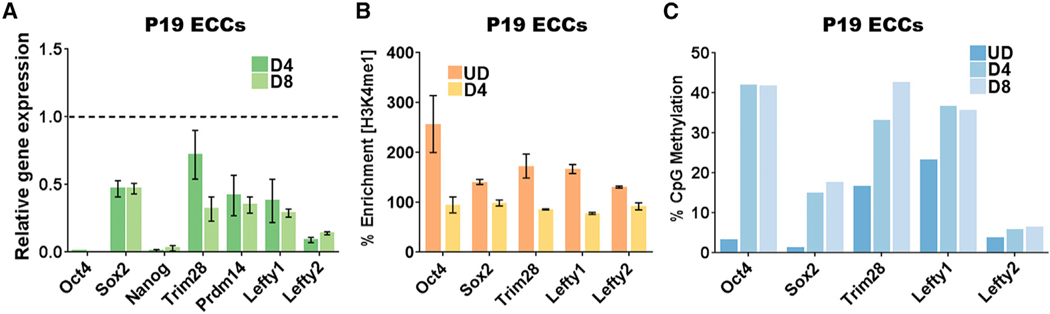
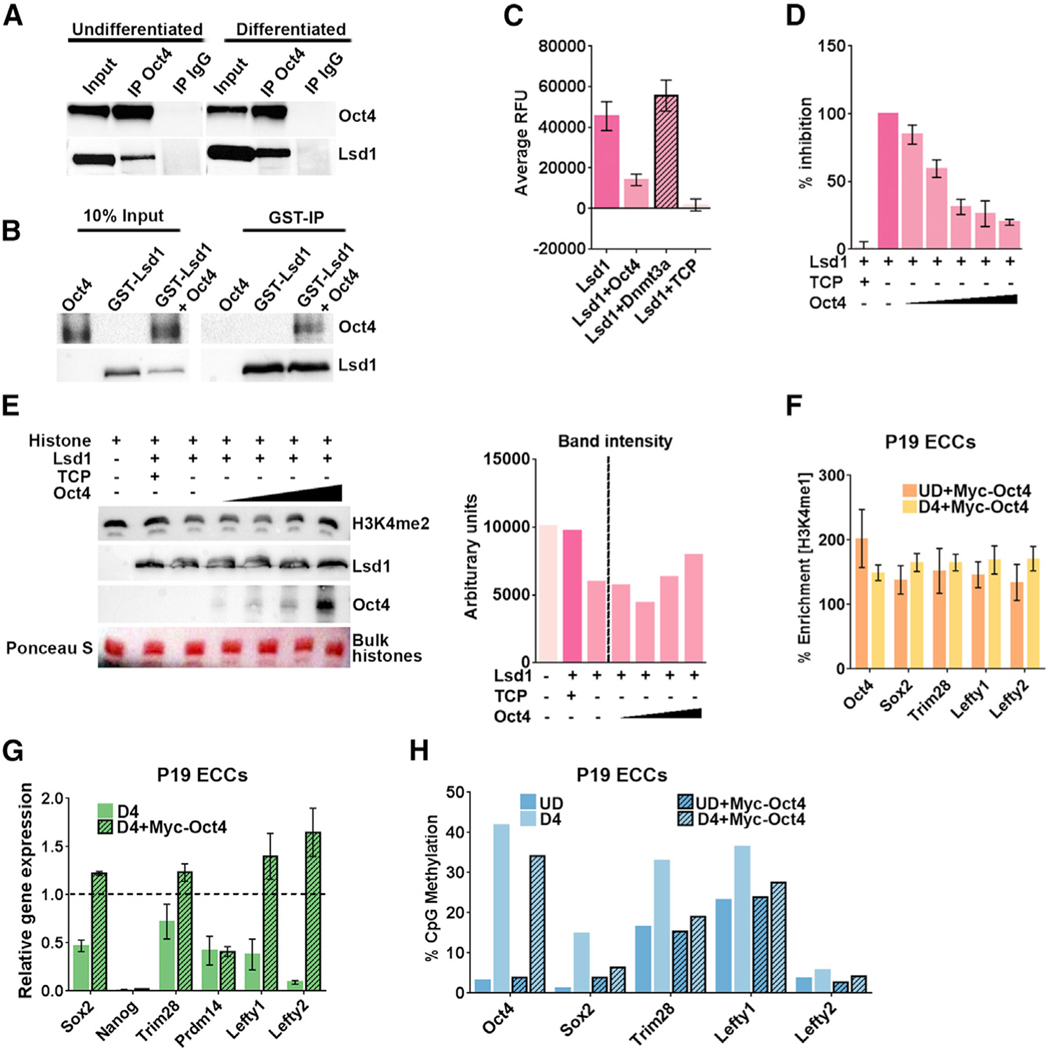
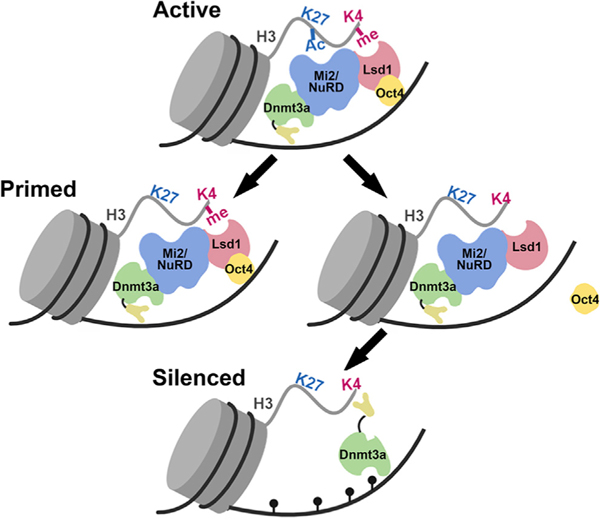
An aberrant increase in pluripotency gene (PpG) expression due to enhancer reactivation could induce stemness and enhance the tumorigenicity of cancer stem cells. Silencing of PpG enhancers (PpGe) during embryonic stem cell differentiation involves Lsd1-mediated H3K4me1 demethylation and DNA methylation. Here, we observed retention of H3K4me1 and DNA hypomethylation at PpGe associated with a partial repression of PpGs in F9 embryonal carcinoma cells (ECCs) post-differentiation. H3K4me1 demethylation in F9 ECCs could not be rescued by Lsd1 overexpression. Given our observation that H3K4me1 demethylation is accompanied by strong Oct4 repression in P19 ECCs, we tested if Oct4 interaction with Lsd1 affects its catalytic activity. Our data show a dose-dependent inhibition of Lsd1 activity by Oct4 and retention of H3K4me1 at PpGe in Oct4-overexpressing P19 ECCs. These data suggest that Lsd1-Oct4 interaction in cancer stem cells could establish a "primed" enhancer state that is susceptible to reactivation, leading to aberrant PpG expression.

Keywords: DNA methylation; Dnmt3a; Lsd1; Oct4; cancer stem cells; embryonal carcinoma cells; enhancer priming; enhancers; histone demethylation; pluripotency.


Conflict of interest statement

Declaration of Interests The authors declare no competing interests.

Figures

Figure 1.
Figure 1.. Pluripotency Genes Are Partially Repressed in Embryonal Carcinoma Cells
(A, B, and E) Gene expression analysis by qRT- PCR of PpGs in (A) F9 ESCs, (B) ECCs, and (E) lineage-specific genes in F9 ECCs. The threshold cycle (Ct) values for each gene were normalized to Gapdh, and expression is shown relative to that in undifferentiated cells (dotted line). In F9 ECCs, the lineage-specific genes show a 5- to 60-fold induction of gene expression (E), whereas the expression of PpGs is, on average, reduced to about 50% post-differentiation (B). Average and SEM of two biological replicates are shown for each gene. (C and D) Alkaline phosphatase staining (C) and SSEA-1 immunofluorescence (D) of ESCs and F9 ECCs pre- and post-differentiation. A positive signal indicates pluripotency that is lost post-differentiation in ESCs. Scale bars, 100 μm. UD, undifferentiated; D4 and D8, days post-induction of differentiation; ESCs, embryonic stem cells; F9 ECCs, F9 embryonal carcinoma cells; PpGs, pluripotency genes.
Figure 2.
Figure 2.. Pluripotency Gene Enhancers Do Not Gain DNA Methylation in Embryonal Carcinoma Cells
(A-C) DNA methylation analysis using Bis-seq. Genomic DNA was treated with bisulfite and PpGe regions were amplified by PCR. The amplicons were sequenced on a high-throughput sequencing platform (Wide-Seq), and the data were analyzed using Bismark software. DNA methylation of PpGe in (A) ESCs and (B) F9 ECCs pre- and post-differentiation. Less than 10% DNA methylation was recorded in F9 ECCs, where as the H19imprinted region, used as a control, showed DNA methylation at 80%. At the same regions, DNA methylation increased up to 30% in ESCs. See also Figure S1A. (C) DNA methylation of PpGe in F9 ECCs overexpressing Myc-Dnmt3a. (D) Gene expression analysis by qRT-PCR PpGs in F9 ECCs overexpressing Myc-Dnmt3a pre- and post-differentiation. (C) shows low levels (less than 10%) in DNA methylation at most PpGe, and (D) shows no significant decrease in expression in 5 out of 8 tested PpGs (p > 0.1). The Ct values for each gene were normalized to Gapdh, and expression is shown relative to that in undifferentiated cells (dotted line). (E) Genome-wide DNA methylation analysis by MethylRAD sequencing. Genomic DNA was digested with the restriction enzyme FspEI, which cuts methylated DNA into 31–32 bp fragments. The fragments were sequenced and mapped on an mm10 mouse genome. The number of reads per region were used as a measure for the extent of DNA methylation and compared between undifferentiated and D4 differentiated F9 ECCs. The waterfall plot shows DNA methylation changes at PpGe, which were computed by subtracting normalized counts in D4 samples from normalized counts in undifferentiated samples. Upper and lower quartiles were used in thresholding regions as gaining or losing methylation. The pie chart shows fractions of PpGe with increase, decrease, or no change in DNA methylation (NCDM). See also Figure S2B. (F) Top ten statistically significant enriched canonical pathways among the genes associated with the NCDM enhancers, which showed no change. The x axis shows the log10 (adjusted p value), with the p value adjusted for multiple testing using the Benjamini-Hochberg method. Data for (A)-(D) are the average and SEM of two biological replicates. UD, undifferentiated; D4 and D8, days post-induction of differentiation; D8 UT, untransfected F9 ECCs differentiated for 8 days; D8+Myc-Dnmt3a, F9 ECCs overexpressing Myc-Dnmt3a and differentiated for 8 days; ESCs, embryonic stem cells; F9 ECCs, F9 embryonal carcinoma cells; PpGe, pluripotency gene enhancers.
Figure 3.
Figure 3.. A “Primed” Chromatin State Is Established at Pluripotency Gene Enhancers in Embryonal Carcinoma Cells
Chromatin immunoprecipitation (ChlP)-qPCR assays. (A and B) Histone modifications at PpGe (A) H3K27Ac and (B) H3K4me1 in F9 ECCs pre- and D4 post-differentiation. Whereas deacetylation of PpGe is observed as a decrease in the H3K27Ac signal, histone H3K4me1 is retained post-differentiation. (C) Lsd1 occupancy in undifferentiated ESCs and F9 ECCs. (D and E) Enrichment of (D) H3K4me1 and (E) H3K4me2 in F9 ECCs expressing recombinant FLAG-Lsd1 compared to undifferentiated transfected cells. The ECCs were differentiated 24 h post-transfection with Lsd1-expressing plasmid. Whereas there was an increase in H3K4me1 at some PpGe (D), there was a concomitant decrease in H3K4me2 enrichment (E). (F) Fold change in enrichment of H3K4me1 at PpGe in pargyline treated and untreated, WT, and FLAG-Lsd1 overexpressing F9 ECCs at D4 post-differentiation. Fold change is represented as relative to enrichment in the undifferentiated state (dotted line). % Enrichment = fold enrichment over input x 100. p values were derived from Student’s t test: *p < 0.05; **p < 0.01; ***p < 0.005. UD, undifferentiated; D4, days post-induction of differentiation; D4+FLAG-Lsd1, F9 ECCs overexpressing FLAG- Lsd1 and differentiated for 4 days; Prg, pargyline; pluripotency gene enhancers. All experiments are an average of atleast two biological replicates and error is shown as SEM.
Figure 4.
Figure 4.. Global Retention of H3K4me1 at Pluripotency Gene Enhancers in Embryonal Carcinoma Cells
Genome-wide H3K4me1 levels in F9 ECCs pre- and post-differentiation were measured by ChlP-seq. Peak calling was performed using Epic2 for each input-ChIP pair. A total of 1,425 H3K4me1 peaks were identified in F9 ECCs within 1 kbp of previously annotated PpGe in ESCs (Whyte et al., 2012). See also Figure S5A. The histone demethylation activity of Lsd1 was surmised by calculating the change in H3K4me1 peak enrichment at PpGe between D4 differentiated and undifferentiated samples. (A) Waterfall plot represents changes in H3K4me1, which were calculated as the difference between log2FC of D4 and undifferentiated samples and transformed to Z score. Z score thresholds of +1 and −1 were used to define the fractions showing increase, no change, or decrease in H3K4me1 shown in the pie chart. Taken together, 87% PpGe show an increase or no change (NDCM) in H3K4me1 enrichment. (B and C) Venn diagrams showing an overlap between PpGe that show (B) an increase or (C) no change in peak enrichment in F9 ECCs but undergo histone H3K4me1 demethylation in ESCs post-differentiation (Whyte et al., 2012). (D) Top ten statistically significant enriched canonical pathways among the genes associated with increase and no change in F9 ECCs. The x axis shows the log-10 (adjusted p value), with the p value adjusted for multiple testing using the Benjamini-Hochberg method. (E) Overlap between the PpGe showing no change in DNA methylation (NDHM) and PpGe that show no decrease in H3K4me1 (NCDM). ESCs, embryonic stem cells; F9 ECCs, F9 embryonal carcinoma cells; PpGe, pluripotency gene enhancers; D4, Days post-induction of differentiation.
Figure 5.
Figure 5.. Pluripotency Gene Enhancers Are Decommissioned in P19 Embryonal Carcinoma Cells
(A) Gene expression analysis by qRT-PCR of PpGs in P19ECCs. The Ct values for each gene were normalized to Gapdh, and expression is shown relative to that in undifferentiated cells (dotted line). Similar to the repression of PpGs in ESCs (Figure 1A), PpGs, especially Oct4 and Nanog, show more than a 90% reduction in expression. (B) ChlP-qPCR showing H3K4me1 enrichment in UD and D4 differentiated P19 ECCs. A decrease in H3K4me1 was observed at all PpGe post-differentiation, demonstrating histone demethylation activity. % Enrichment = fold enrichment over input × 100. (C) DNA methylation analysis of PpGe using Bis-seq in UD, D4, and D8 differentiated P19ECCs. Up to a 40% increase in DNA methylation level was observed at 3 out of 5 PpGe post-differentiation. All experiments are an average of at least two biological replicates and error is shown as SEM. UD, undifferentiated; D4 and D8, days post-induction of differentiation; P19 ECCs, P19 embryonal carcinoma cells; PpGs, pluripotency genes; PpGe, pluripotency gene enhancers.
Figure 6.
Figure 6.. Oct4 Interacts with Lsd1 and Inhibits Its Catalytic Activity
(A) Nuclear extract from undifferentiated and D4 differentiated F9 ECCs was used to perform coIP with anti-Oct4 antibody and control immunoglobulin G (IgG). 10% ofthe input and eluate from coIP were probed for Oct4 and Lsd1 on western blot. The vertical space denotes the extra lane in the gel that was digitally removed. (B) Glutathione S-transferase (GST) pull-down experiment showing direct interaction between Lsd1 and Oct4. Recombinant GST-Lsd1 was incubated with Oct4 at about a 1:2 molar ratio and precipitated using GST-Sepharose. The co-precipitated Oct4 is detected using anti-Oct4 antibody. The vertical space denotes the extra lane in the gel that was digitally removed. (C) Lsd1 demethylase assay was performed using 0.25 μM Lsd1 and H3K4me2 peptide as substrate. Lsd1 demethylation activity was completely inhibited by 0.1 mM TCP (tranylcypromine) in the reaction. To test the effect of Oct4 on Lsd1 activity, demethylation assays were performed in the presence of 0.5 μM Oct4 ata1:2 (Lsd1:Oct4) molar ratio. The catalytic domain of Dnmt3a at the same molar ratio was used as a control. (D) Dose-dependent inhibition assays were performed using increasing concentrations of Oct4 in the following molar ratios of Lsd1:Oct4: (1:0.5), (1:1), (1:2), (1:3), (1:4). Data are an average and SD of at least 5 experimental replicates. (E) Lsd1 demethylation assays were performed using 0.25 μM Lsd1 and 30 mg bulk histones as substrate with increasing concentrations of Oct4 in the reaction. Upper panel: histone demethylation was detected by using anti-H3K4me2 on a western blot,which shows retention of signal with increasing concentrations of Oct4. Lower panels: amount of Lsd1 enzyme and increasing amounts of Oct4 in the histone demethylation reaction. Ponceau S stain of bulk histones shows equal loading on the gel. The bar graph on the right shows quantification of H3K4me2 signal using ImageJ software. (F) ChIP-qPCR showing percent enrichment of H3K4me1 at PpGe in P19 ECCs stably expressing recombinant Myc-Oct4 pre- and post-differentiation. The data show retention of H3K4me1 post-differentiation. % Enrichment = fold enrichment over input x 100 (G) Gene expression analysis by qRT-PCR of PpGs in P19 ECCs expressing recombinant Myc-Oct4. The Ct values were normalized to Gapdh, and expression is shown relative to that in undifferentiated cells (dotted line). (H) DNA methylation analysis of PpGe using Bis-seq in UD and D4 differentiated P19 ECCs WT and expressing recombinant Myc-Oct4. Oct4 expressing cells show failure to gain DNA methylation at PpGe post-differentiation compared to untransfected WT. All experiments are an average of at least two biological replicates and error is shown as SEM. TCP, tranylcypromine; ECCs, embryonal carcinoma cells; PpGe, pluripotency gene enhancers; D4, days post-induction of differentiation.
Figure 7.
Figure 7.. Model of Epigenetic Changes at Pluripotency Gene Enhancers during Stem Cell Differentiation
</p>In an undifferentiated state, the pluripotency gene enhancers (PpGe) are active, bound by the coactivator complex, and contain chromatin modifications, including H3K4m2/1 and H3K27Ac. In response to the signal of differentiation, the dissociation of the coactivator complex, including Oct4, is followed by the activity of the Lsd1-Mi2/NuRD complex, which facilitates enhancer silencing. The histone deacetylase (HDAC) removes H3K27Ac at PpGe, and Lsd1 demethylates H3K4me1, followed by DNA methylation by Dnmt3a. However, in F9 ECCs, Lsd1 activity is inhibited in the presence of Oct4, causing retention of H3K4me1. The ADD domain of Dnmt3a cannot interact with the H3K4 methylated histone tail and will potentially remain in the autoinhibited state, thus preventing DNA methylation at these sites. Consequently, PpGe, instead of being silenced, acquire a “primed” state. Black pins represent methylated CpGs.

References

    1. Akhtar-Zaidi B, Cowper-Sal-lari R, Corradin O, Saiakhova A, Bartels CF, Balasubramanian D, Myeroff L, Lutterbaugh J, Jarrar A, Kalady MF, et al. (2012). Epigenomic enhancer profiling defines a signature of colon cancer. Science 336, 736–739. - PMC - PubMed
    1. Alonso A, Breuer B, Steuer B, and Fischer J. (1991). The F9-EC cell line as a model for the analysis of differentiation. Int. J. Dev. Biol. 35, 389–397. - PubMed
    1. Andrews S. (2010). FastQC: a quality control tool for high throughput sequence data.http://www.bioinformatics.babraham.ac.uk/projects/fastqc.
    1. Andrews PW, Matin MM, Bahrami AR, Damjanov I, Gokhale P, and Draper JS (2005). Embryonic stem (ES) cells and embryonal carcinoma (EC) cells: opposite sides of the same coin. Biochem. Soc. Trans. 33, 1526–1530. - PubMed
    1. Aran D, and Hellman A. (2013). DNA methylation of transcriptional enhancers and cancer predisposition. Cell 754, 11–13. - PubMed

Publication types