Comparative Study
. 2020 Feb 4;30(5):1644-1659.e4.
doi: 10.1016/j.celrep.2020.01.007.

Single-Cell Transcriptomic Comparison of Human Fetal Retina, hPSC-Derived Retinal Organoids, and Long-Term Retinal Cultures

Affiliations
Comparative Study

Single-Cell Transcriptomic Comparison of Human Fetal Retina, hPSC-Derived Retinal Organoids, and Long-Term Retinal Cultures

Akshayalakshmi Sridhar et al. Cell Rep. .

Abstract

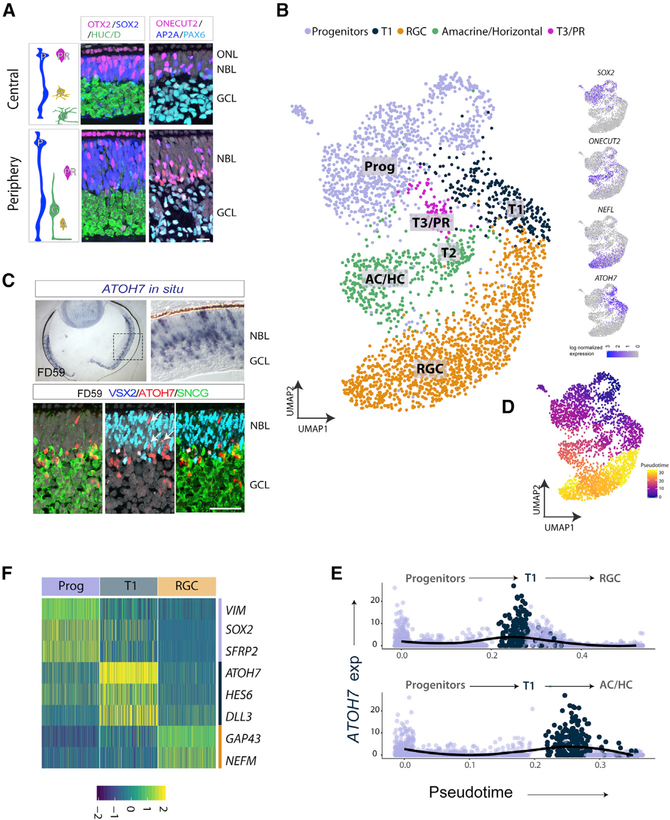
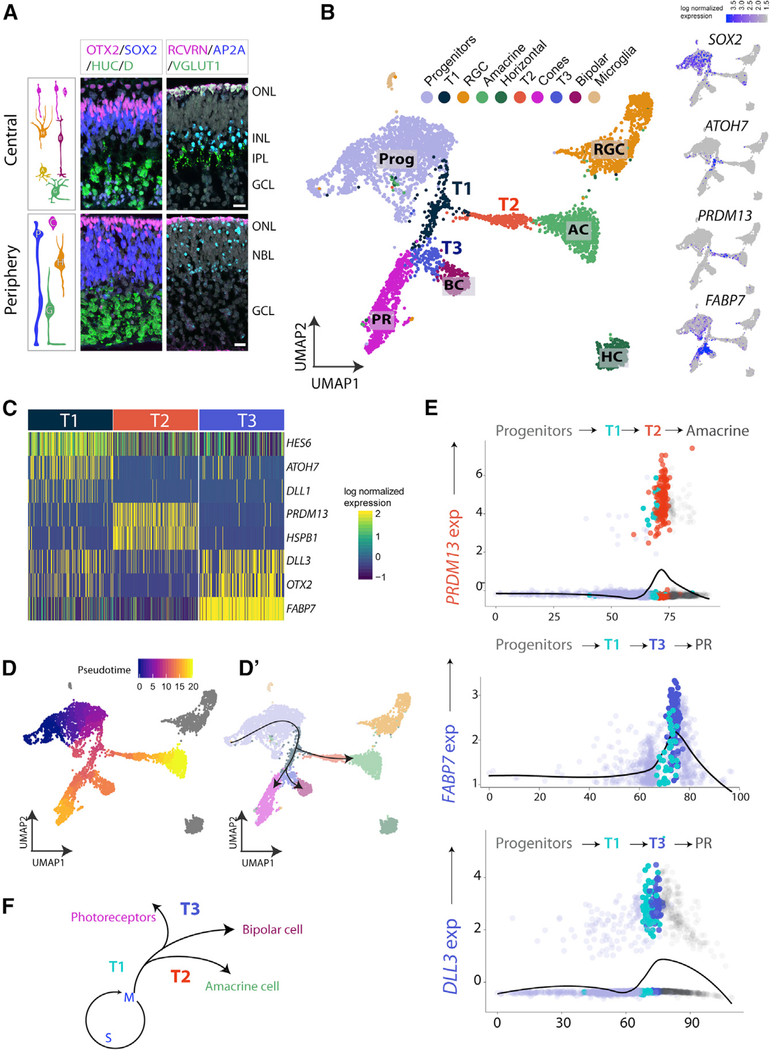
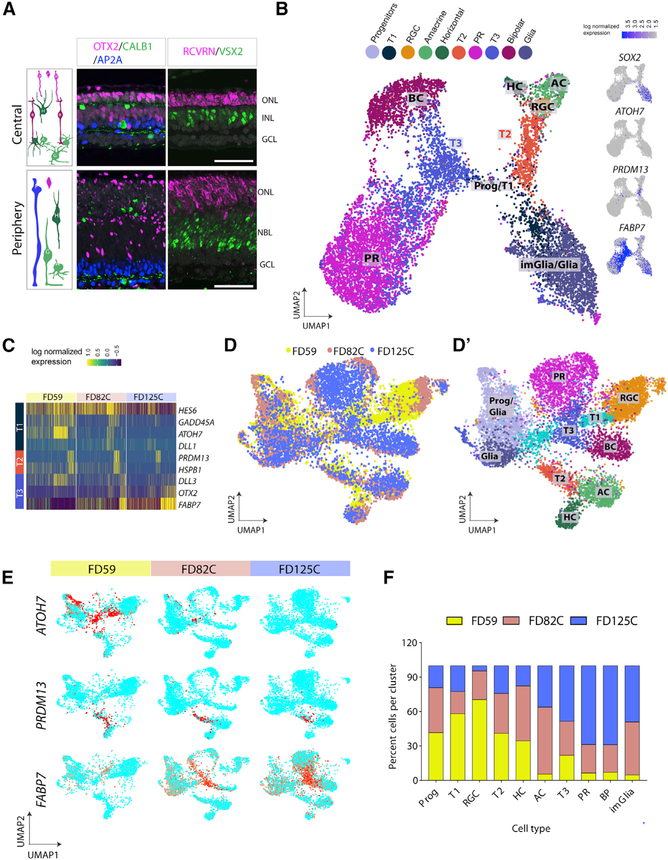
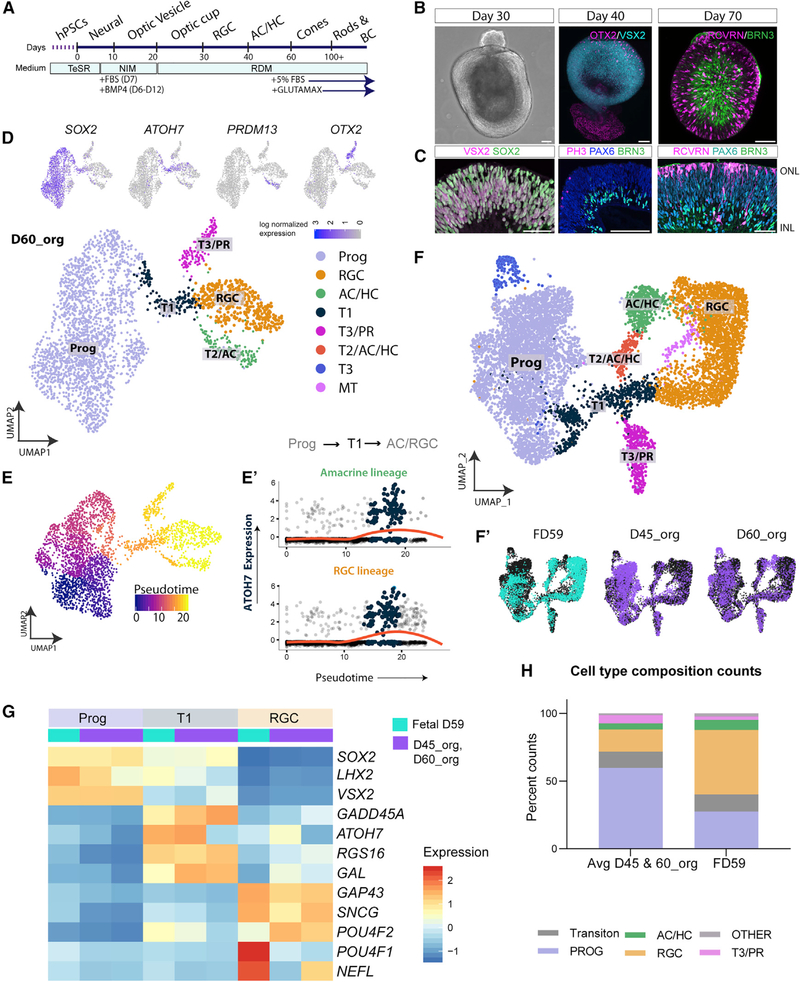
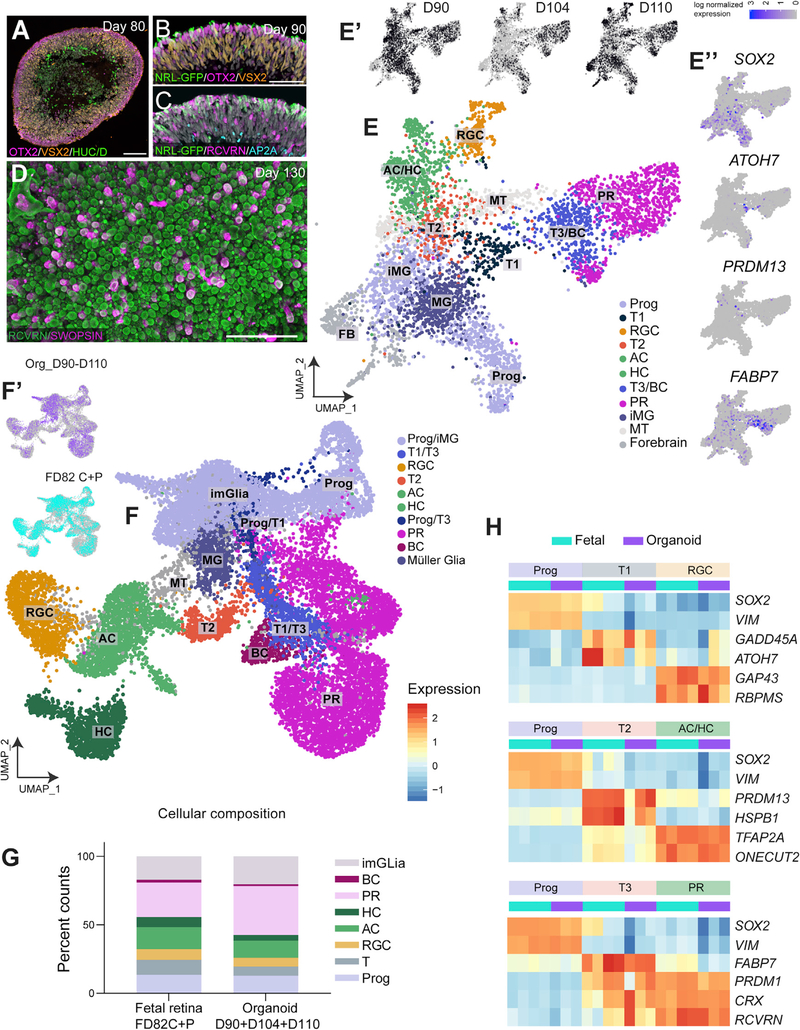
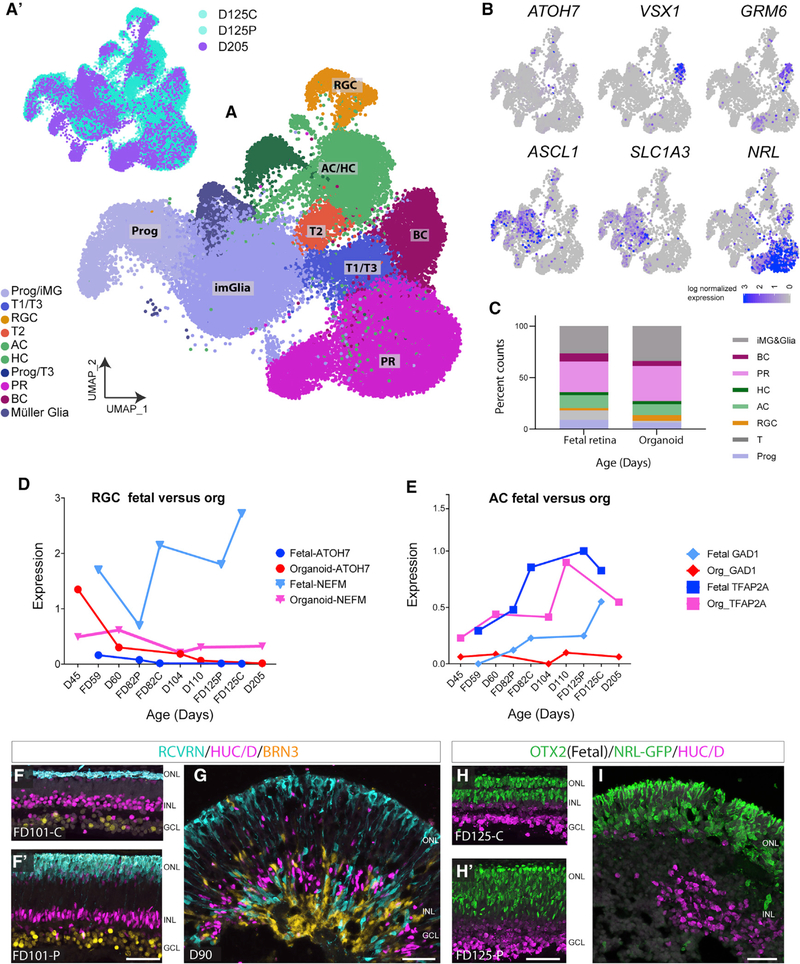
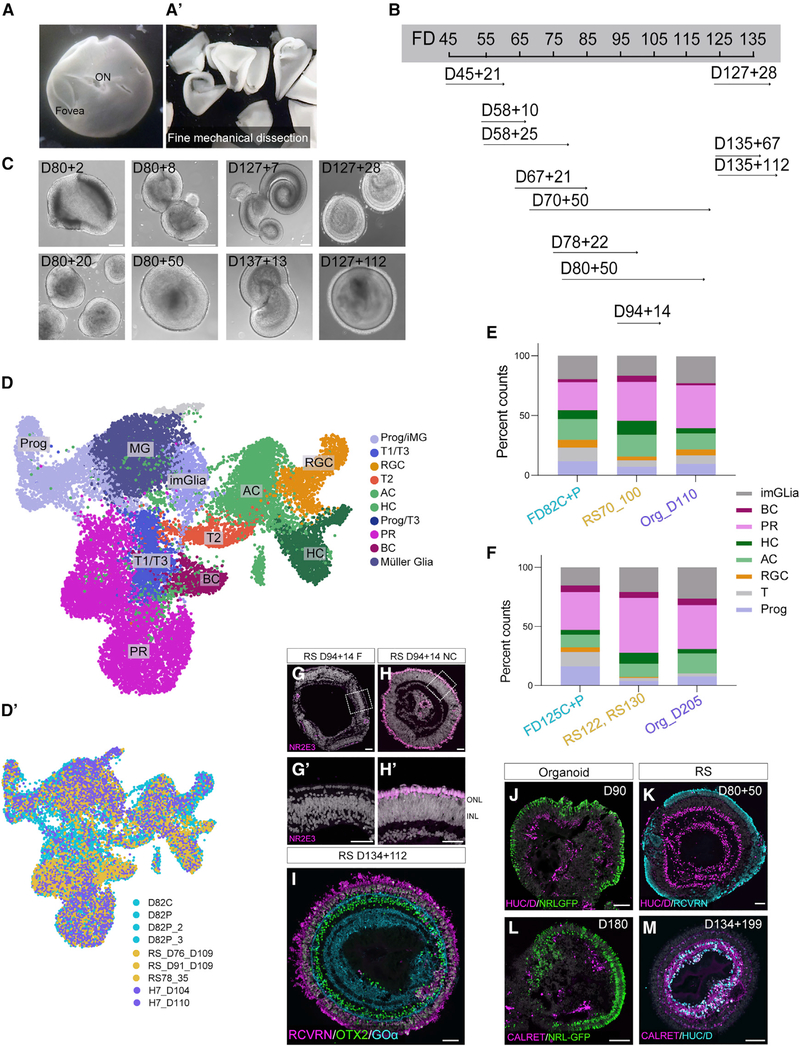
To study the development of the human retina, we use single-cell RNA sequencing (RNA-seq) at key fetal stages and follow the development of the major cell types as well as populations of transitional cells. We also analyze stem cell (hPSC)-derived retinal organoids; although organoids have a very similar cellular composition at equivalent ages as the fetal retina, there are some differences in gene expression of particular cell types. Moreover, the inner retinal lamination is disrupted at more advanced stages of organoids compared with fetal retina. To determine whether the disorganization in the inner retina is due to the culture conditions, we analyze retinal development in fetal retina maintained under similar conditions. These retinospheres develop for at least 6 months, displaying better inner retinal lamination than retinal organoids. Our single-cell RNA sequencing (scRNA-seq) comparisons of fetal retina, retinal organoids, and retinospheres provide a resource for developing better in vitro models for retinal disease.

Keywords: lamination; neurogenesis; organoids; stem cells.


Conflict of interest statement

Declaration of Interests The authors declare no competing interests.

Figures

Figure 1.
Figure 1.. scRNAseq of FD59 Retina
(A) IF of FD59 retina comparing temporal central retina versus periphery, showing RGCs (ganglion cell layer [GCL], HUC/D+ and PAX6+) and progenitors (neuroblast layer [NBL], SOX2+) and some ACs, HCs (AP2A+/ONECUT2+), and PRs (OTX2+) in the ONL. Progenitor cells predominate in peripheral retina. (B) UMAP plot of FD59 retina, recolored and showing major cell types: progenitors (Progs), transition zone 1 (T1), RGCs, amacrine/horizontal cells (ACs/HCs) and cones (PRs). Right panels: feature plots show expression of some of the genes used to define clusters. (C) In situ hybridization for ATOH7 at low (left) and high (right) magnification (top panel) and IF for ATOH7 (red), VSX2 (blue), and SCNG (green). Arrows indicate ATOH7+ and VSX2/ SNCG cells. (D) Pseudotime trajectory with Progs at the root(dark blue loop) and differentiated cells (yellow). (E) Trajectory analysis from Slingshot, with ATOH7 expression plotted along the individual lineages using UMAP coordinates. T1 cluster cells are plotted in blue, and ATOH7 expression is marked as a solid black line. (E) (F) Heatmap highlighting genes present in the T1 cluster. Scale bars, 50 mm. ONL, outer nuclear layer.
Figure 2.
Figure 2.. scRNAseq Analysis of FD82 Retina Highlights Three Transition Zones
(A) IF of central and peripheral FD78 fetal retina(top panels), showing PRs/BCs (OTX2+ cells in the ONL and INL and RCVRN+ cells in the ONL) RGCs (HUC/D+ cells in the GCL), ACs (TFAP2A+), and HCs; the IPL is labeled with VGLUT1. Peripheral retina shows a rudimentary PR layer (OTX2+/ RCVRN+) but no BCs and no defined INL or plexiform layers. Scale bars, 50 μm. (B) UMAP plot of FD82 central retina. Right panels: feature plots showing the expression of genes characteristic of Progs and transition populations in blue. (C) Heatmap showing markers of the three transition states. (D and D’) Monocle pseudotime plot with Progs at the root state and lineages drawn across clusters. Cells shown in gray (RGCs and HCs) were excluded from the trajectory by Monocle. (E) Slingshot analysis plotting T2-specific PRDM13 expression along the amacrine lineage and T3-specific FABP7 and DLL3 along the PR lineage. (F) Summary of the transition populations and trajectories seen in central retina at FD82.
Figure 3.
Figure 3.. scRNAseq of FD125 Retina
(A) IF of FD125 near the fovea shows that neurogenesis is complete: a single layer of PRs (ONL, OTX2+/RCVRN+), BCs (INL, OTX2+/VSX2+), and HCs and ACs (CALBINDIN+/TFAP2A+). The periphery at this stage still has a NBL (VSX2+). Scale bars, 50 mm. (B) UMAP clusters of FD125 central retina (FD125C). Right panels: feature plots showing the lack of ATOH7 (T1 cells); PRDM13 marks T2 cells, and FABP7 marks the T3 population. (C) Heatmap showing genes characteristic of transition clusters in FD59, FD82, and FD125 retinas; T2 and T3 genes are still expressed at laterages. (D) CCA plot of fetal ages combined; clusters are plotted by age (left) or retinal cell type (right). RGCs are over-represented in the FD59 sample (yellow), whereas BCs are over-represented in the FD125 sample (blue). (E) Feature plots showing changes in transition markers across the ages. (F) The ages that contribute to specific retinal cell types were plotted as percent cells per cluster, colored by age.
Figure 4.
Figure 4.. scRNAeq of Early Retinal Organoids
(A) Differentiation protocol highlighting the order and timing of retinal organoid development. (B and C) Retinal organoids at 30 days primarily express Prog markers (VSX2/SOX2; C). By 40 days, whole-mount staining shows OTX2+ cells migrating in the neuroepithelial layer, and a small patch of RPE also expresses OTX2 (B, middle panel). RGCs appear (BRN3/PAX6) at 30–40 days (C, middle panel). By 70 days, RCVRN+ PRs are seen in the apical layers, and BRN3+ RGCs occupy the basal layers, as seen in the whole mount (B, right panel) and sections (C, right panel). (D) UMAP plot showing 5 major clusters at day 60: Progs, T1, retinal ganglion cells (RGCs), transition cells 2/ACs/HCs (T2ACs/HCs), and transition cells 3 (T3) and early cone PRs. Inset: the feature plots used to identify clusters. (E) Pseudotime analysis by Monocle2.99, showing cell ordering with Prog cells at the root. (E’) Slingshot analysis showing similar ordering of cells. Trajectory analysis shows that ATOH7 expression (y axis) is highest in T1 cells (bump in red line) as cells go from Progs to differentiated cell types. (F) Integration of organoid (D45, D60) scRNA datasets with the FD59 dataset (Seurat3); cells were reclustered and replotted. (F’) UMAP plot of the identity of the clusters in (F) (cyan, fetal; purple, organoid). (G) Heatmap showing cluster averages for key genes, highlighting the expression of cells in the Prog, T1, and RGC clusters, plotted for fetal retina (FD59, cyan) and organoids (D45 and D60, purple). (H) Each column corresponds to a single dataset. The stacked bar graph shows the cell type composition of the fetal retina and organoids (average of both ages) from (F). Scale bars in first panels of (B) and (C) represent 100 mm; other scale bars represent 50 mm.
Figure 5.
Figure 5.. scRNAseq of D100 Retinal Organoids
(A) D80 organoids contain a PR layer (OTX2, magenta), an NBL (VSX2, orange), and HUC/D+ ganglion cells and ACs (green). (B and C) Early rods (NRL-GFP) at 90 days of differentiation, along with progenitors (VSX2+) (B) and ACs (AP2A+) (C). (D) Whole-mount staining at day 130 shows RCVRN+ cone PRs (green), some of which express SWS-OPN (magenta). (E) UMAP clusters highlighting the cellular composition at this age. (E’) scRNA-seq analysis of D90, D104, and D110 organoids plotted by origin. (E”) Feature plots showing Prog and transition cell populations. (F and F’) Combined scRNA-seq analysis of fetal retina and organoids; FD82 central and periphery (FD82C+P) with organoids (D90, D104, and D110). (F0) shows the composition by origin (organoid, purple; fetal retina, cyan), and (F) shows the UMAP clusters seen at this age. (G) Stacked plots showing the percent counts from (F), reflecting the composition of the fetal retina and organoids from (F). Counts were calculated for eachdataset and then averaged by fetal or organoid. (H) Heatmaps plotting the cluster averages of key genes, highlighting the 3 lineages seen at this age. Each column corresponds to a single dataset (cyan, FD82C;P [purple], day 90, day 104, and day 110 organoids). Scale bars,50μm.. FB, forebrain; MT, mitochondrial cluster.
Figure 6.
Figure 6.. scRNAseq of Older Organoids Compared to Fetal Retina
(A and A’) Combined scRNA-seq of FD125 central and peripheral datasets with D205 organoids. (A) UMAP clusters showing the cellular composition across the combined dataset. (A’) Plots showing the relative contribution of fetal retina (cyan) and organoid (purple) to the clusters in (A). (B) Feature plots showing the T1 marker ATOH7, bipolar markers (VSX1 and GRM6), Mùller glia markers (RLBP1 and SLC1A3), and rods (NRL). (C) Percent counts calculated from (A), showing the relative proportions of cells in fetal retina (average of D125C+P) and day 205 organoid. (D and E) Average expression of key genes for fetal and organoid RGC and AC subsets across all ages. (E–H) IF comparing lamination across comparative fetal and organoid ages. (F and F’) FD 101 central and peripheral retina: RCVRN+ PRs (cyan), HUC/D+ ACs (magenta), and BRN3+ ganglion cells (yellow) form distinct layers. (G) D90 organoid is similar to the FD101 retina. HUC/D and BRN3-td tomato cells (pseudocolored in yellow; cell line from Sluch et al., 2017) show basic lamination, although there is more mixing of cells from other layers. (H and H’) FD125 central and peripheral retina. OTX2+ PRs and BCs (ONL and INL, green) and HUC/D+ AC and ganglion cells (magenta) show characteristic lamination. (I) The day 180 organoid has a well-laminated ONL (rod PRs are NRL-GFP+) but less organized INL; HUC/D+ cells (magenta) appear to be clumped together. 50μm.
Figure 7.
Figure 7.. Comparison of Fetal Retinal Cultures (Retinospheres) with All Datasets
(A) FD130 retina with fovea and optic nerve head (ON). (A’) Pieces of the retina prior to culture. (B) Age at culture of retinospheres used in this study. FD45+21 refers to a FD45 retina cultured for 21 days. (C) Retinospheres made from older retinas organized into spheres (D127+7, D137+13) and could be cultured for a month (D127+28) or up to 4 months withprominent outer segments (D127+112). (D and D’) Combined UMAP plot of retinoshperess, fetal retina, and organoids. (D’) shows UMAP plotted by tissue of origin: retinospheres (RSD76 [RSD, retinosphere age in days] cultured until day 109, RSD91 cultured until day 109, RSD78 cultured until day113), organoids (day 104 and day 110), and fetal retina (FD82 central and periphery). (E and F) Percent counts from (D) for (E) FD82 retina with equivalent age retinospheres (i.e., retinosphere cultured from D70 to D100) and D110 organoids highlightsimilar composition across all samples. (F) This is also true for older ages of fetal retina (FD125C+P) when compared to older cultures of retinospheres (RSD122 cultured for 14 days and RSD130 cultured for 30 days) and D205 organoids. (G–H’) Fovea-derived retinospheres lack rods (NR2E3, magenta, G and G’), unlike nasal central (NC)-derived retinospheres (H and H’). (I) Retinospheres maintained for 100+ days retain lamination, as seen by RCVRN+ PRs (magenta, ONL) and BCs (RCVRN, OTX2, and Goa). (J and K) RSD80 (K) resemble equivalent age organoids (D90, J) but demonstrate distinct and compact rings of the AC/RGC marker HUC/D. (L) At later ages, organoids express NRL-GFP, and the ONL is well preserved, but calretinin staining does not form a continuous layer. (M) After 134 days in vitro, retinospheres continue to maintain inner retinal layers (CALRET/HUC/D). Scale bars, 50μm.

References

    1. Bae S, Bessho Y, Hojo M, and Kageyama R (2000). The bHLH gene Hes6, an inhibitor of Hes1, promotes neuronal differentiation. Development 127, 2933–2943. - PubMed
    1. Becht E, McInnes L, Healy J, Dutertre CA, Kwok IWH, Ng LG, Ginhoux F, and Newell EW (2018). Dimensionality reduction for visualizing single-cell data using UMAP. Nat. Biotechnol 37, 38–44. - PubMed
    1. Bessodes N, Parain K, Bronchain O, Bellefroid EJ, and Perron M (2017). Prdm13 forms a feedback loop with Ptf1a and is required for glycinergic amacrine cell genesis in the Xenopus Retina. Neural Dev. 12, 16. - PMC - PubMed
    1. Brown NL, Kanekar S, Vetter ML, Tucker PK, Gemza DL, and Glaser T (1998). Math5 encodes a murine basic helix-loop-helix transcription factor expressed during early stages of retinal neurogenesis. Development 125, 4821–4833. - PubMed
    1. Brzezinski JA, and Reh TA (2015). Photoreceptor cell fate specification in vertebrates. Development 142, 3263–3273. - PMC - PubMed

Publication types