. 2020 Jan 31;21(3):931.
doi: 10.3390/ijms21030931.

Genome-Wide Identification, Expression Profile and Evolution Analysis of Karyopherin β Gene Family in Solanum tuberosum Group Phureja DM1-3 Reveals Its Roles in Abiotic Stresses

Affiliations

Genome-Wide Identification, Expression Profile and Evolution Analysis of Karyopherin β Gene Family in Solanum tuberosum Group Phureja DM1-3 Reveals Its Roles in Abiotic Stresses

Ya Xu et al. Int J Mol Sci. .

Abstract

In eukaryotic cells, nucleocytoplasmic trafficking of macromolecules is largely mediated by Karyopherin β/Importin (KPNβ or Impβ) nuclear transport factors, and they import and export cargo proteins or RNAs via the nuclear pores across the nuclear envelope, consequently effecting the cellular signal cascades in response to pathogen attack and environmental cues. Although achievements on understanding the roles of several KPNβs have been obtained from model plant Arabidopsis thaliana, comprehensive analysis of potato KPNβ gene family is yet to be elucidated. In our genome-wide identifications, a total of 13 StKPNβ (Solanum tuberosum KPNβ) genes were found in the genome of the doubled monoploid S. tuberosum Group Phureja DM1-3. Sequence alignment and conserved domain analysis suggested the presence of importin-β N-terminal domain (IBN_N, PF08310) or Exporin1-like domain (XpoI, PF08389) at N-terminus and HEAT motif at the C-terminal portion in most StKPNβs. Phylogenetic analysis indicated that members of StKPNβ could be classified into 16 subgroups in accordance with their homology to human KPNβs, which was also supported by exon-intron structure, consensus motifs, and domain compositions. RNA-Seq analysis and quantitative real-time PCR experiments revealed that, except StKPNβ3d and StKPNβ4, almost all StKPNβs were ubiquitously expressed in all tissues analyzed, whereas transcriptional levels of several StKPNβs were increased upon biotic/abiotic stress or phytohormone treatments, reflecting their potential roles in plant growth, development or stress responses. Furthermore, we demonstrated that silencing of StKPNβ3a, a SA- and H2O2-inducible KPNβ genes led to increased susceptibility to environmental challenges, implying its crucial roles in plant adaption to abiotic stresses. Overall, our results provide molecular insights into StKPNβ gene family, which will serve as a strong foundation for further functional characterization and will facilitate potato breeding programs.

Keywords: abiotic stress; expression analysis; karyopherin; solanum tuberosum.


Conflict of interest statement

The authors declare no conflict of interest.

Figures
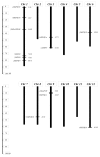
Figure 1
Figure 1
Genomic distribution of StKPNβ genes on S. tuberosum group phureja DM1-3 chromosomes. The chromosome numbers and size are indicated at the top and bottom of each bar, respectively. The arrows next to gene names show the transcription directions. The number on the right side of the bars designated the approximate physical position of the first exon of corresponding StKPNβ genes on potato chromosomes.
Figure 2
Figure 2
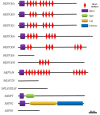
Analysis of conserved domains in StKPNβ proteins. Schematic organization of conserved domains in StKPNβ proteins. The IBN_N domain, HEAT repeats domain, XpoI amd CseI/CAS-CseI domain are shown in purple, red, green and yellow/blue, respectively.
Figure 3
Figure 3
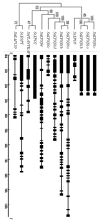
Classification of StKPNβ proteins. Neighbor-joining tree were generated using MEGA X to determine the phylogenetic relationship between StKPNβs (left). The intron-exon organization of StKPNβ genes was plotted using Gene Structure Display Server (Version 2.0). Black boxes represent exons and black lines represent introns (right).
Figure 4
Figure 4
Conserved motifs embedded in the StKPNβ proteins. Conserved motif in StKPNβs was evaluated using the MEME, and the location of novel motifs identified were designated in different colors.
Figure 5
Figure 5
Phylogenetic analysis of StKPNβ proteins in A. thaliana, S. tuberosum, S. cerevisiae and H. sapiens. Neighbor-joining tree was constructed based on the alignment of KPNβ protein sequences from S. cerevisiae (Green triangle), H. sapiens (Blue square), A. thaliana (Red empty circle) and S. tuberosum (Red circle). The percent bootstrap support for 500 replicates is shown on each branch with >50% support.
Figure 6
Figure 6
Expression profiles of StKPNβ genes with hierarchical clustering in different tissues. The Illumina RNA-Seq data were obtained from PGSC database, and the FPKM value of representative transcripts of StKPNβs were used to generate heatmap with hierarchical clustering based on the Manhattan correlation with average linkage using MeV software package. Color scale below heatmap shows the expression level; red indicates high transcript abundance while green indicates low abundance.
Figure 7
Figure 7
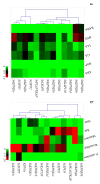
Heatmap representation and hierarchical clustering of StKPNβ genes under abiotic and biotic stresses (a) and phytohormone treatments (b). The Illumina RNA-Seq data were obtained from PGSC database, and the relative expression of StKPNβ genes was calculated with respect to control samples using FPKM values of representative transcripts corresponding to StKPNβ genes. Fold changes of StKPNβ expression were log2 transformed, and the normalized expression data was used to generate heatmap with MeV software package using the same parameters in Figure 6. Color scale below heatmap shows the expression level; red indicates high transcript abundance, while green indicates low abundance.
Figure 8
Figure 8
qRT-PCR analysis of StKPNβ genes in response to salicylic acid (SA), ethylene (ETH), jasmonic acid (JA) and hydrogen peroxide (H2O2). StKPNβ transcript levels measured by real-time RT-qPCR from the various tissues or under phytohormone treatments at indicated time points. Data are means of three biological replicates (eight pooled plants each), and error bars denote SE. The StACT gene was used as an internal control. Stars above the error bars indicate significant differences between treatments and controls (according to student’s t-test). qRT-PCR primers for each StKPNβ genes were provided in Table S1.
Figure 9
Figure 9
StKPNβ3a-silenced potato plants exhibit reduced resistance to salt and H2O2 treatments. Potato plants were infiltrated with Agrobacterium carrying VIGS-control vector (PVX:00) and PVX-StKPNβ3a, and after 2–3 weeks, the StKPNβ3a-silencing lines confirmed by qRT-PCR were used for leaf-disk assay. (a) Leaf-disk assay for plant tolerance to different abiotic stresses. (b) Expression analysis of StKPNβ3 members in StKPNβ3a-silencing and control lines. (c) Phenotype of PVX-StKPNβ3a-Silencing and control potato plants. The photographs were taken before or after 48-hrs salt (300 mM) or H2O2 (100μM) treatments, respectively. qRT-PCR analysis of StKPNβ3a expression in cotton plants infiltrated with VIGS-control vector (PVX:00) and PVX-StKPNβ3a. Error bars indicate SD from three technical replicates of three biological experiments, and asterisks indicate statistically significant differences, as determined by the Student’s t test (**, p < 0.01). The experiments were repeated three times with similar results.

References

    1. Baum D.A., Baum B. An inside-out origin for the eukaryotic cell. BMC Biol. 2014;12:76. doi: 10.1186/s12915-014-0076-2. - DOI - PMC - PubMed
    1. Lane N., Martin W. The energetics of genome complexity. Nature. 2010;467:929–934. doi: 10.1038/nature09486. - DOI - PubMed
    1. Xu X.M., Meier I. The nuclear pore comes to the fore. Trends Plant Sci. 2008;13:20–27. doi: 10.1016/j.tplants.2007.12.001. - DOI - PubMed
    1. Fahrenkrog B., Aebi U. The nuclear pore complex: Nucleocytoplasmic transport and beyond. Nat. Rev. Mol. Cell Biol. 2003;4:757–766. doi: 10.1038/nrm1230. - DOI - PubMed
    1. Fried H., Kutay U. Nucleocytoplasmic transport: Taking an inventory. Cell Mol. Life Sci. 2003;60:1659–1688. doi: 10.1007/s00018-003-3070-3. - DOI - PMC - PubMed

LinkOut - more resources