. 2020 Jan 31;12(2):375.
doi: 10.3390/nu12020375.

Eating Behavior (Duration, Content, and Timing) Among Workers Living under Different Levels of Urbanization

Affiliations

Eating Behavior (Duration, Content, and Timing) Among Workers Living under Different Levels of Urbanization

Natalia M Tiuganji et al. Nutrients. .

Abstract

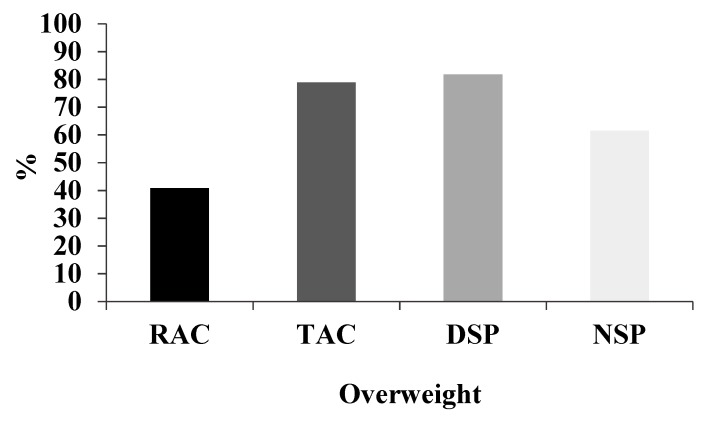
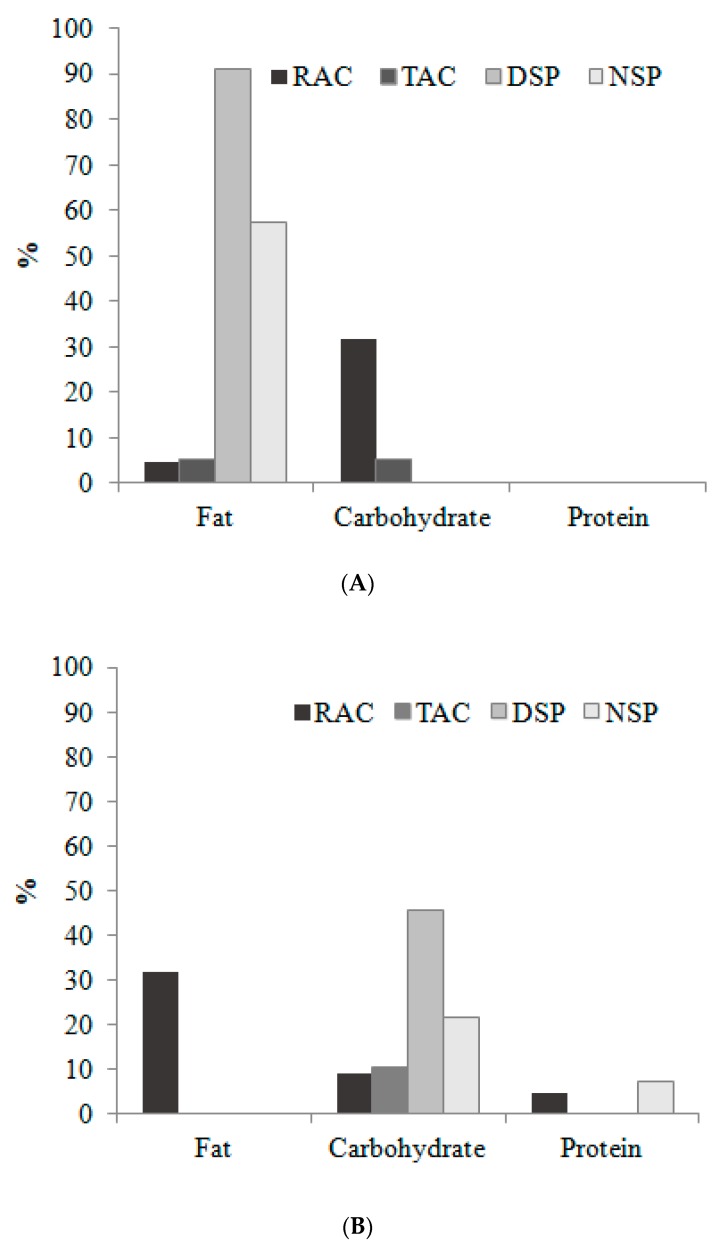
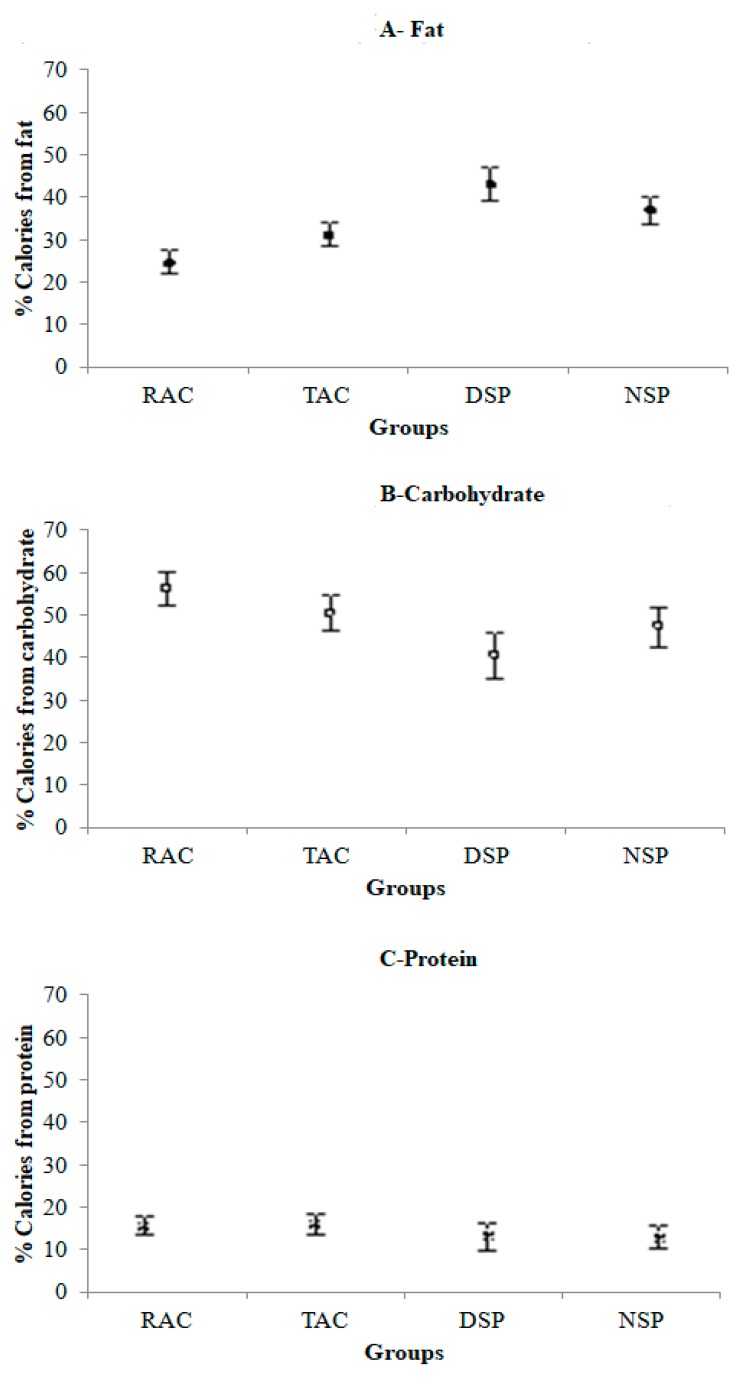
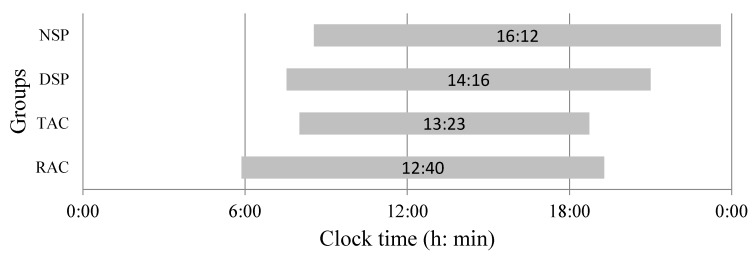
Urbanization has contributed to extended wakefulness, which may in turn be associated with eating over a longer period. Here, we present a field study conducted in four groups with different work hours and places of living in order to investigate eating behavior (duration, content, and timing). Anthropometric measures were taken from the participants (rural (n = 22); town (n = 19); city-day workers (n = 11); city-night workers (n = 14)). In addition, a sociodemographic questionnaire was self-answered and 24-h food recalls were applied for three days. The 24-h food recalls revealed that fat intake varied according to the groups, with the highest consumption by the city-day workers. By contrast, city-day workers had the lowest intake of carbohydrate, whereas the rural group had the highest. In general, all groups had some degree of inadequacy in food consumption. Eating duration was negatively correlated with total energy intake, fat, and protein consumption in the rural and town groups. There was a positive correlation between body mass index and eating duration in both city groups. The rural group had the earliest start time of eating, and this was associated with a lower body mass index. This study suggested that food content and timing, as well as eating duration, differed according to place of living, which in turn may be linked to lifestyle.

Keywords: eating duration; food content; meal timing; urbanization.


Conflict of interest statement

The authors declare that they have no competing interests.

Figures

Figure 1
Figure 1
Percentage overweight among urban and rural workers in Acre (AC) and São Paulo (SP). Rural = RAC, town = TAC, city-day workers = DSP and city-night workers = NSP. Overweight = BMI > 30 kg/m2. Fisher’s exact test revealed differences between groups, p = 0.04.
Figure 2
Figure 2
Macronutrient consumption among rural and urban workers in Acre (AC) and São Paulo (SP). (Panel A) Prevalence of excessive consumption; (Panel B) Prevalence of insufficient consumption. Rural = RAC, town = TAC, city-day workers = DSP and city-night workers = NSP. RAC = 22; TAC = 19; DSP = 11; and NSP = 14 workers. The acceptable macronutrient distribution range (AMDR)% energy estimates for adults; carbohydrate (45%–65%), fat (20%–35%) and protein (10%–35%). No values mean no consumption.
Figure 3
Figure 3
Calories derived from each macronutrient, according to group and adjusted for age. (A) Fat (GLM: F(3, 61) = 23.12, p < 0.001); (B) Carbohydrate (GLM: F(3, 61) = 8.35, p < 0.001); (C) Protein (GLM: F (3, 61) = 1.50, p = 0.225). RAC, n = 22; TAC, n = 19; DSP, n = 11; NSP, n = 14. Rural = RAC, town = TAC, city-day workers = DSP and city-night workers = NSP.
Figure 4
Figure 4
Average eating timing (h:min) and duration (h), according to groups. Mid-points (h:min) of the eating period are shown within the bars. Rural = RAC, town = TAC, city-day workers = DSP and city-night workers = NSP. Mean ± SD eating duration: NSP: 14.6±1.4 h; DSP: 13.2±0.6 h; TAC: 11.7±0.25 h; RAC: 13.4±0.3 h.
Figure 5
Figure 5
Number of eating episodes and calorie intake during different time periods among urban and rural workers in Acre and São Paulo. (A) number of eating episodes per day; (B) caloric intake (%) according to time of day. Eating episodes: 00:01–06:00 h (*KW p < 0.01); 12:01–18:00 h (*ANOVA p < 0.01); 18:01–00:00 h (*KW p < 0.01). Calorie intake: 00:01–06:00 h (*KW p < 0.01); 06:01–12:00 h (*ANOVA p < 0.01); 12:01–18:00 h (*KW p < 0.01).

Similar articles

Cited by

References

    1. Green A., Cohen-Zion M., Haim A., Dagan Y. Evening light exposure to computer screens disrupts human sleep, biological rhythms, and attention abilities. Chronobiol. Int. 2017;34:855–865. doi: 10.1080/07420528.2017.1324878. - DOI - PubMed
    1. Wright K.P., Jr., McHill A.W., Birks B.R., Griffin B.R., Rusterholz T., Chinoy E.D. Entrainment of the human circadian clock to the natural light-dark cycle. Curr. Biol. 2013;23:1554–1558. doi: 10.1016/j.cub.2013.06.039. - DOI - PMC - PubMed
    1. Beale A.D., Pedrazzoli M., Gonçalves B.S.B., Beijamini F., Duarte N.E., Egan K.J., Knutson K.L., von Schantz M., Roden L.C. Comparison between an African town and a neighbouring village shows delayed, but not decreased, sleep during the early stages of urbanisation. Sci. Rep. 2017;7:5697. doi: 10.1038/s41598-017-05712-3. - DOI - PMC - PubMed
    1. De La Iglesia H.O., Fernández-Duque E., Golombek D.A., Lanza N., Duffy J.F., Czeisler C.A., Valeggia C.R. Access to electric light is associated with shorter sleep duration in a traditionally hunter-gatherer community. J. Biol. Rhythms. 2015;30:342–350. doi: 10.1177/0748730415590702. - DOI - PMC - PubMed
    1. Moreno C.R.C., Vasconcelos S., Marqueze E.C., Lowden A., Middleton B., Fischer F.M., Louzada F.M., Skene D.J. Sleep patterns in Amazon rubber tappers with and without electric light at home. Sci. Rep. 2015;5:14074. doi: 10.1038/srep14074. - DOI - PMC - PubMed